Storage construction is still expensive in 2026, and the main story is simple: costs are up, debt is expensive, and site problems can wreck a deal fast.
If I were underwriting a self-storage or boat/RV project today, I’d assume build costs are still 22% to 28% above 2020 levels and still moving up by 3% to 6% per year. I’d also keep a close eye on steel tariffs, concrete swings, labor, loan rates of 7% to 9%, and site work that can swing from a small line item to a budget killer.
Here’s the short version:
- Single-story drive-up storage usually pencils at $70 to $110 per rentable square foot
- Climate-controlled storage costs more, with added HVAC and insulation
- Multi-story storage can reach $100 to $180 per rentable square foot
- Enclosed boat/RV storage often runs $40 to $75 per square foot for the shell
- Covered boat/RV canopy often runs $18 to $35 per square foot for the shell
- Rentable square feet matters more than gross area, because rentable space may be only 75% to 88% of the total footprint
- Contingency of 5% to 10% is common, and rough sites may need more
- Regional gaps are large, with coastal and union markets often 20% to 40% above lower-cost areas
What this means for you: if you’re building, buying, expanding, or planning an exit, replacement cost still shapes value. And in 2026, small mistakes in assumptions on steel, concrete, carry, or site work can change the deal in a hurry.
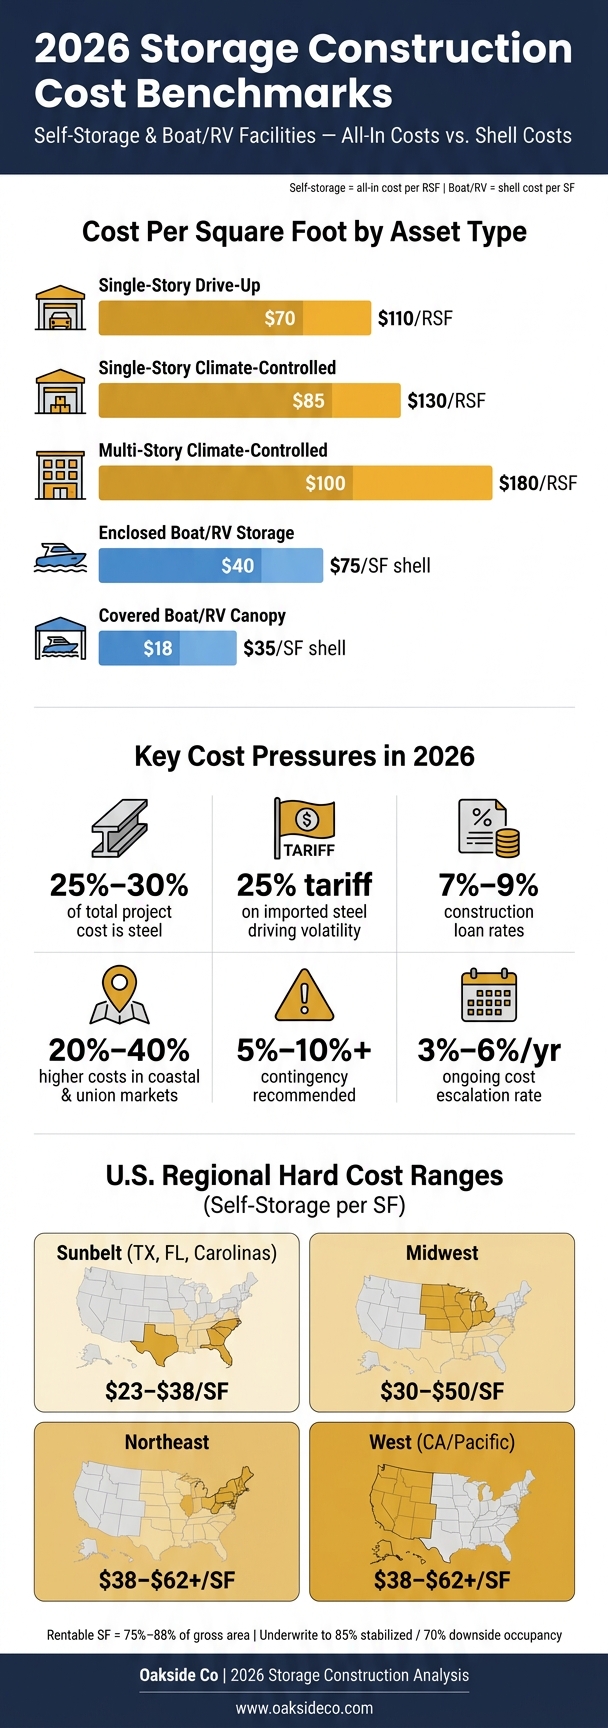
2026 Self-Storage & Boat/RV Construction Costs by Asset Type
Quick comparison
| Asset type | 2026 cost range | Main cost pressure |
|---|---|---|
| Single-story drive-up | $70–$110/RSF | Site work, doors, steel |
| Single-story climate-controlled | $85–$130/RSF | HVAC, insulation, vapor barriers |
| Multi-story climate-controlled | $100–$180/RSF | Elevators, fire systems, structural steel |
| Enclosed boat/RV | $40–$75/SF shell | Height, slab thickness, large doors |
| Covered boat/RV canopy | $18–$35/SF shell | Steel tonnage, wind load, site layout |
If I had to boil the article down to one line, it would be this: high replacement cost is still supporting values, but it leaves far less room for error on new development.
sbb-itb-09b4138
2026 Construction Cost Benchmarks for Self-Storage and Boat/RV Facilities
Per-Square-Foot Cost Ranges by Asset Type
A basic single-story drive-up facility usually lands at $70 to $110 per rentable square foot (RSF) all-in, while a multi-story climate-controlled building can climb to $100 to $180 per RSF. That spread gets much larger on multi-story deals because you’re paying for more than extra floors. Structural steel, elevators, fire suppression, and HVAC zoning all add cost.
Boat and RV storage has a broader range because the site, clear height, and wind-load demands can vary a lot more. Enclosed buildings usually run $40 to $75 per RSF for the shell only. The main reasons: taller eaves, oversized doors, and thicker concrete slabs. Covered canopy structures come in lower at $18 to $35 per RSF for the shell, but total project cost can still jump once you factor in site work and wind-load requirements.
One point matters more than it may seem: underwrite using rentable square feet, not gross area. Rentable space is often just 75% to 88% of gross area. The rest goes to drive aisles, hallways, and wall thickness.
Hard Costs, Soft Costs, and Total Project Budgets
Hard costs usually break into three main parts:
- The building shell – steel framing, concrete, and doors – accounts for 50% to 60% of total hard costs
- Site work and utilities – earthwork, paving, storm drainage, power, and water – make up 20% to 30%
- Equipment and technology such as gates, security, kiosks, and signage add another 5% to 10%
Soft costs sit on top of that and usually equal 8% to 15% of hard costs. That bucket includes architectural and civil engineering fees, permitting, impact fees, legal costs, and financing-related items.
For a mid-sized deal, the budget picture is pretty clear. A 50,000 RSF single-story facility usually needs an all-in budget of $3.5 million to $7 million. A 100,000 RSF multi-story facility usually falls between $10 million and $18 million.
It also makes sense to carry a 5% to 10% contingency. On sites with unknown soil conditions or high water tables, 10% or more is the safer move. That’s one of those line items people hope they won’t need – until they do.
2026 Storage Construction Cost Ranges: Comparison Table
| Asset Type | 2026 Cost Basis (all-in for self-storage; shell only for boat/RV) | Main Cost Drivers |
|---|---|---|
| Single-Story Drive-Up | $70 – $110 all-in | Site work, door count, steel pricing |
| Single-Story Climate-Controlled | $85 – $130 all-in | HVAC zoning, insulation (R-19 to R-30), vapor barriers |
| Multi-Story Climate-Controlled | $100 – $180 all-in | Elevators, fire suppression, structural steel |
| Enclosed Boat/RV Storage | $40 – $75 shell | Eave height, oversized doors, slab thickness |
| Covered Boat/RV Canopy | $18 – $35 shell | Steel tonnage, wind load, paving area |
Sources:
Those ranges can move again when material pricing and supply conditions change.
Climate control adds $15 to $30 per RSF on top of a base building cost, no matter the story count. These benchmarks set the starting point for the steel, concrete, lumber, and paving swings covered next.
Material Prices and Supply Chain Conditions: 2024 to 2026
Steel, Concrete, Lumber, and Paving Price Trends
Steel is still the biggest material cost in storage construction, making up 25% to 30% of total project costs. That covers framing, metal panels, roofing, and roll-up doors. In 2026, steel pricing can move 10% to 20% in a single quarter, which makes it harder to pin down a firm budget. Those benchmark ranges only hold if current material pricing stays in place.
Concrete is now the most volatile input in storage construction. The main risk sits in slab pricing. Standard 4-inch reinforced slabs usually cost $4 to $7 per square foot, but poor soil or a high water table can push that to $10 to $15 per square foot or more. That’s a big jump, and it can hit a budget fast.
Asphalt and site work costs are starting to settle down, but they still depend heavily on the site itself. Site work, including asphalt paving and grading, usually runs $8 to $25 per gross square foot. On tougher sites, that figure can go past $40 per gross square foot.
Lead Times, Tariffs, and Remaining Supply Chain Pressure
Supply shortages have eased, but timing still matters. Procurement delays can still change final pricing, and the 25% tariff on imported steel is still working its way into project budgets. 56% of contractors reported higher construction costs in 2025 because of those tariffs. By early 2026, 28% said overall costs were higher than a year earlier. On top of that, supplier quotes now stay valid for shorter periods, which leaves less room to wait before making buying decisions.
Labor is helping offset some of that pressure. 70% of contractors report that subcontractor prices are declining, which gives owners at least some breathing room when material costs move up.
Year-over-Year Material Cost Changes: Trend Table
| Material | Benchmark / Pricing Reference | 2024–2025 Change | 2025–2026 Change | Key Cause |
|---|---|---|---|---|
| Steel | 25%–30% of total project budget | Moderate increase | High volatility / upward | 25% import tariffs |
| Concrete | $4–$15 per SF for slabs | Stable | High volatility | Most volatile material input |
| Asphalt / Paving | $8–$25 per gross SF for site work | Moderate increase | Stabilizing | Site-specific grading and drainage needs |
Use current steel and concrete quotes when underwriting, and keep contingency allowances loose enough to handle site issues and schedule risk. The next pressure point is labor and financing, not just materials.
Labor, Financing, and Regional Cost Differences
Labor Availability and Schedule Risk
After materials, labor and timing are now driving 2026 budgets. The labor picture is mixed. On one hand, 70% of contractors report lower subcontractor prices. On the other, cheaper subs don’t cancel out swings in material costs or site-related risk. In many cases, the bigger issue is the schedule itself.
Typical build times are 6 to 9 months for single-story drive-up facilities and 9 to 14 months for multi-story projects. That matters because even small delays can get expensive fast. With construction loans priced at 7% to 9%, every extra month can push interest carry up and move lease-up farther down the road.
That’s why many developers are leaning on design-build. It helps them lock in pricing earlier and cut down on change-order risk.
Construction Financing and Underwriting Pressure in 2026
Once labor and schedule risk are on the table, financing becomes the next squeeze point. Higher replacement costs are shrinking development spreads and making lenders more strict.
Here’s what that looks like in practice:
- Most lenders now want at least 1.25x DSCR at stabilization.
- Construction loans usually come with 12- to 18-month terms at 7% to 9%, with carry adding 3% to 5% to total project cost.
- Contingency allowances of 5% to 10% – and sometimes more on hard sites – are now standard.
For underwriting, use 85% stabilized occupancy and 70% downside occupancy in the pro forma. That kind of cushion isn’t just a nice idea. In this market, it’s part of staying out of trouble.
U.S. Storage Construction Costs by Region: Comparison Table
Even when two projects look almost the same on paper, location can shift total cost enough to make or break the deal. Coastal and union labor markets often come in 20% to 40% above Mountain West baselines.
| U.S. Region | Typical Self-Storage Hard Cost (per SF) | Typical Boat/RV Hard Cost (per SF) | Notable Considerations |
|---|---|---|---|
| Sunbelt (TX, FL, Carolinas) | $23–$38 | $15–$30 | Lower labor costs; strong demand for covered storage |
| Midwest | $30–$50 | $20–$35 | Moderate costs; weather limits build windows |
| Northeast | $38–$62+ | $25–$45 | Higher permitting and snow-load requirements |
| West (CA/Pacific) | $38–$62+ | $25–$45 | Higher wages; seismic and zoning complexity |
Impact fees add one more swing factor, especially in higher-cost markets. Depending on the jurisdiction, they can range from $1 to $10+ per square foot. That kind of spread has a direct effect on feasibility and replacement value.
Feasibility Takeaways and Oakside’s Advisory Perspective
How Higher Replacement Costs Affect Development and Valuation
With those cost benchmarks in view, the big issue is simple: does new construction still beat buying an existing asset?
Right now, new development costs about 70% to 85% of a stabilized acquisition on an RSF basis. On paper, that can look attractive. But the margin gets tighter once you factor in lease-up risk and interest carry. That’s where a deal can go from looking strong to looking just okay.
At the same time, higher replacement costs help support values for existing assets, especially in supply-constrained secondary markets where occupancy is above 90%. For owners weighing a sale versus a hold, that matters. It gives more context around what an existing property may be worth today and how hard it would be for new supply to compete.
Ground-up projects can still work in select markets. But there’s less room for error now. Site efficiency, unit mix, and return-on-cost discipline do a lot of the heavy lifting.
That shifts the next edge to execution – especially how a project gets phased and bought out.
Practical Steps for Owners and Investors
Phasing can help cut risk. A common move is to open drive-up units first, then hold later phases until demand shows up. It’s a simple idea, but it can protect capital when market timing feels less certain.
Procurement matters too. Locking in steel pricing early can help limit cost swings. Value engineering can also trim tonnage and labor. In practice, that often means standardizing door sizes and tightening building spans to reduce steel and labor costs.
On the underwriting side, a more cautious stance makes sense:
- Underwrite to 70% occupancy
- Carry at least a 5% to 10% contingency, and more for sites with unknown soil or water conditions
Even if execution improves, a few cost pressures still sit front and center for next year.
Key 2026 Cost Trends to Watch
The main 2026 risks are still steel tariffs, concrete volatility, and financing carry, with regional cost gaps staying wide. That’s why replacement-cost awareness should be part of every deal discussion – whether you’re sizing up a new build, looking at an acquisition, or deciding when to sell.
Oakside Co uses construction-cost analysis to guide feasibility, pricing, and disposition decisions across the investment lifecycle.
FAQs
How do I estimate cost per rentable square foot?
Estimate construction costs using rentable square footage, not gross square footage.
Here’s why that matters: gross square footage includes space that doesn’t make you money, like drive aisles, hallways, and wall thickness. If you use that number, your project can look cheaper than it is and hide how efficient the site actually is.
To get your all-in cost, add up:
- building shell
- site work
- utilities
- soft costs
- FF&E
Then divide that total by your net rentable square feet. That gives you a much clearer view of project feasibility.
When does building make sense יותר than buying?
Building still makes sense when the total project cost supports a workable deal in your market. As Nolen Masserman, Managing Director at Oakside, notes, the core numbers need to hold up even when material prices climb and labor is hard to find.
With construction costs projected to increase 3% to 6% in 2026 and project timelines stretching 12 to 24 months, feasibility is the main test. If your underwriting can’t carry those costs and still support premium rents, buying an existing facility may be the better move.
What site issues can blow up a storage budget?
Unexpected site conditions can blow up a budget fast, adding $5.00 to $40.00 per square foot.
Some of the biggest cost drivers are tough site conditions. Think sloped or rocky land, heavy cut and fill work, a high water table, or poor soil that calls for deep foundations or soil stabilization. Utility connections can also hit hard, often ranging from $40,000 to $500,000+. On top of that, costs can climb with environmental remediation and more complicated storm drainage work.