
If you compare self-storage and boat/RV storage with one raw cost number, you can get the deal wrong. I’d use the same few benchmarks every time: expense ratio, cost per NRSF, cost per occupied unit or space, cost per acre, and capex reserves – but I’d match each one to the asset type first.
Here’s the short version:
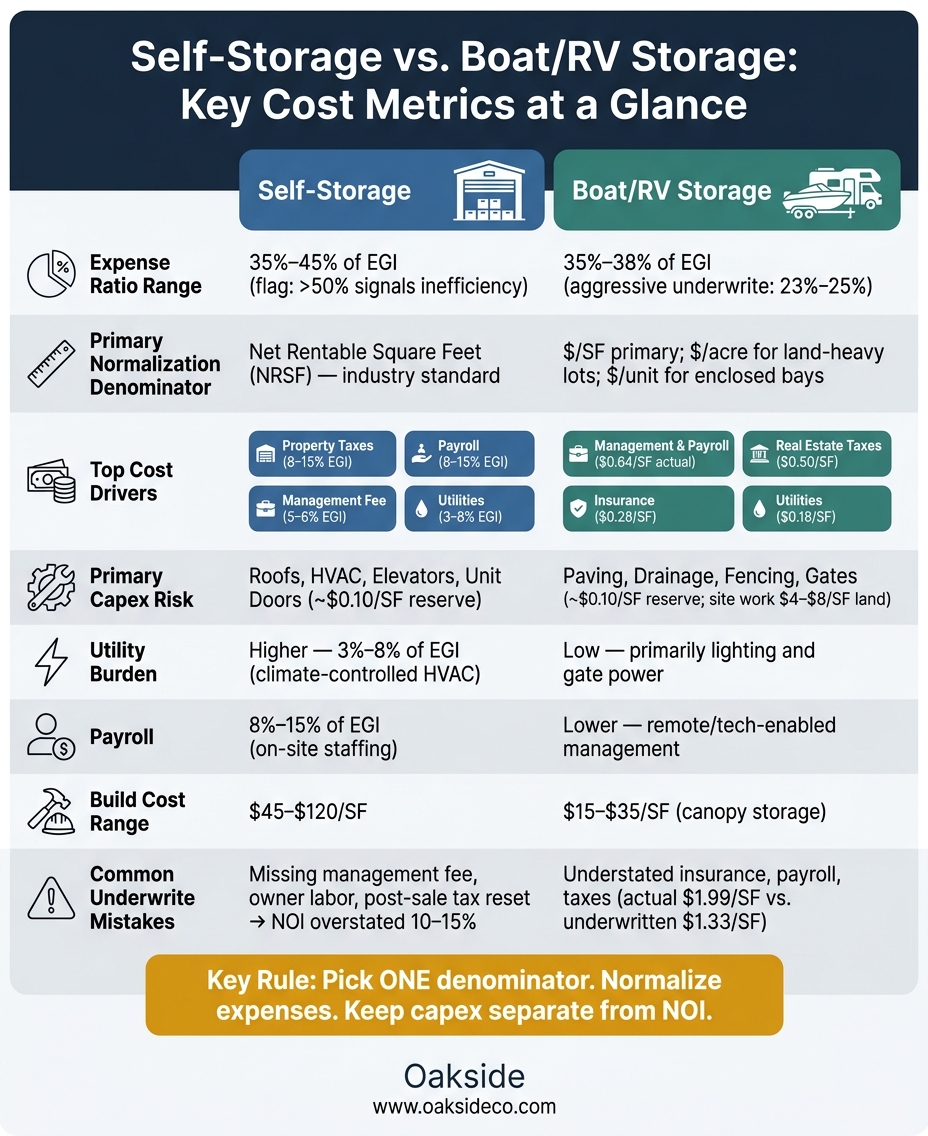
- Self-storage usually runs at 35% to 45% of EGI
- Boat/RV storage often lands around 35% to 38% of EGI
- Self-storage is easier to compare because NRSF is the standard base
- Boat/RV storage needs more care because size, layout, and land use can shift the right denominator
- In self-storage, big cost pressure often comes from taxes, payroll, utilities, and building systems
- In boat/RV storage, misses often show up in taxes, insurance, payroll, and site work
- A common capex reserve for both is about $0.10 per square foot, but the repair risk is different
The main takeaway is simple: pick one denominator, normalize the expenses, and keep capex separate from NOI. If I skip owner labor, post-sale tax resets, or market-rate management fees, the underwrite can look stronger than it should.
Self-Storage vs. Boat/RV Storage: Key Cost Metrics Compared
Quick Comparison
| Metric | Self-Storage | Boat/RV Storage |
|---|---|---|
| Main expense ratio range | 35%–45% of EGI | 35%–38% of EGI |
| Best main denominator | NRSF | $/SF |
| Other useful basis | Cost per unit | Cost per acre, cost per space |
| Common underwrite issue | Missing management fee, owner labor, tax reset | Understated insurance, payroll, taxes |
| Main capex risk | Roofs, HVAC, elevators, doors | Site work, drainage, fencing, gates |
| Utility load | Higher in climate-controlled sites | Usually lower |
If I want a clean read on storage costs, I don’t ask, “Which asset is cheaper?” I ask, “Which metric fits this asset, and what got left out?”
sbb-itb-09b4138
1. Self-Storage Facilities
Self-storage cost analysis usually starts with the operating expense ratio and then shifts to normalization.
Expense Ratio
Self-storage properties often run at 35%–45% of EGI. Once that number gets above 50%, it often points to inefficiency or deferred maintenance.
Normalization Basis
This is where a lot of deals can look better on paper than they should.
Owner-operated facilities often show lower expenses than a buyer will actually face. Private owners may leave out management fees and owner labor, which pushes NOI higher and makes side-by-side comparisons messy. To clean that up, underwriters usually add a 5%–6% management fee and market-rate payroll back into the expense schedule.
If you skip that step, NOI can end up overstated by 10%–15%. That’s not a small miss. The right move is simple: normalize first, then compare line items.
Property taxes also need a hard look. Underwrite them to the likely post-sale assessed value, since reassessment at closing is common. After normalization, the big cost drivers are much easier to spot.
Category Cost Drivers
For stabilized self-storage assets, expenses usually fall into these ranges:
| Expense Category | Typical Range (% of EGI) | Key Driver |
|---|---|---|
| Property Taxes | 8%–15% | Largest fixed cost; reassessment risk at sale |
| Payroll | 8%–15% | Staffing model; reduced by automation and kiosks |
| Management Fee | 5%–6% | Must be imputed even for self-managed sites |
| Utilities | 3%–8% | Higher in climate-controlled facilities |
| Marketing | 2%–5% | Higher during lease-up phases |
| Repairs & Maintenance | 2%–5% | Doors, roofing, and pavement |
Property taxes and payroll account for most of the variance. Sites that use kiosks and remote management can push payroll below the usual 8%–15% range.
Capex Sensitivity
Operating expense ratios don’t show reserve needs, and that matters for cash yield.
Capex sits outside NOI, but it still hits cash flow. Put plainly, NOI excludes capex, but investors still have to underwrite it. A common reserve level is about $0.10 per square foot for gates, doors, and roofing.
Climate-controlled assets tend to have more capex exposure because HVAC systems need more frequent maintenance. Older facilities bring another risk layer too, especially when roofs or pavement have deferred work. Security systems – like gates and keypads – also need recurring reserves to keep working the way they should.
2. Boat/RV Storage Facilities
Boat/RV storage uses the same underwriting setup as self-storage, but the math shifts because the main cost drivers aren’t the same.
Expense Ratio
Compared with self-storage, boat/RV sites often run with leaner day-to-day operations. For a broader look at the asset class, see our self-storage operations guide. But they also face a different kind of fixed-cost load. Well-run boat/RV facilities usually post a 35%–38% expense ratio. Carraway RV & Boat Storage in Magnolia, TX (70,893 SF) reported 35.56%–37.44% from 2021 to 2023 and 36.46% in Q1 2024. By contrast, a more aggressive underwrite may assume 23%–25% if the property uses automation and very lean staffing.
Normalization Basis
That makes the normalization metric a big deal. Use $/SF as the main basis, since unit and parking space sizes can vary a lot.
RevPAF is the clearest single metric because it blends rate and occupancy into one number. Seasonality also plays a big role here. Boat/RV demand tends to peak in spring and fall, so monthly underwriting is more accurate than relying on one annualized figure.
Category Cost Drivers
A few expense lines do most of the damage when an underwrite misses.
Insurance has climbed to about $0.28/SF as carriers price specialty vehicle risk more carefully. Management and payroll can run around $0.58/SF in a staffed facility, and Carraway’s actual result was higher at $0.64/SF. Real estate taxes add about $0.50/SF to the fixed-cost base.
| Expense Category | Actual Cost ($/SF) | Underwritten Estimate ($/SF) |
|---|---|---|
| Real Estate Taxes | $0.50 | $0.43 |
| Property Insurance | $0.28 | $0.16 |
| Utilities | $0.18 | $0.12 |
| Repairs & Maintenance | $0.14 | $0.08 |
| Management & Payroll | $0.64 | $0.34 |
| Total Operating Expenses | $1.99 | $1.33 |
| Expense Ratio | ~37% | ~23% |
Source: Carraway RV & Boat Storage case study, 2021–2024
Carraway’s actual $1.99/SF came in well above the $1.33/SF underwrite, which would squeeze projected NOI. In this asset type, most forecast misses come from insurance, payroll, and taxes. That’s where the spread between pro forma and actuals usually shows up.
Capex Sensitivity
Opex is only part of the story. Capex risk changes by facility format.
Open lots need limited upkeep. Covered canopies and enclosed bays are a different animal. They bring repeat repair needs for roll-up doors, gates, and pavement. A standard reserve of $0.10/SF is often used to keep those mechanical access points working properly. On top of that, site work like grading, drainage, and paving can add $4–$8/SF of land upfront, and that cost does not show up in the operating expense ratio.
Cost Metric Comparison by Category
The same underwriting framework works for both asset types. But each metric matters a bit differently because land use, density, and revenue drivers are not the same. The easiest way to compare them is to read each metric against the right cost base.
Expense Ratio
Both asset types usually land in the mid-30% to low-40% range, but they get there for different reasons. In self-storage, expense ratios tend to move up when climate control is part of the mix, because HVAC adds to construction cost and monthly utility bills.
Boat/RV storage is different. Its ratios react more to land-heavy fixed costs, especially taxes and insurance. Same range on paper, different pressure points underneath.
Normalization Basis
Use $/SF as the main benchmark for both. Then layer in the cost basis that matches the expense line:
- Use cost per unit for self-storage items that move with tenant count
- Use cost per acre for boat/RV sites
- Use % of EGI for management fees and marketing
Once that denominator is locked in, the next step is pretty simple: look at which expense lines move the most.
Category Cost Drivers
| Expense Category | Self-Storage Driver | Boat/RV Storage Driver |
|---|---|---|
| Property Taxes | Building value and improvements | Land value and acreage |
| Insurance | Fire and theft for high-density units | Specialty risk for high-value vehicles |
| Utilities | HVAC for climate-controlled units | Site lighting and gate power |
| Repairs & Maintenance | Elevators, hallways, unit doors | Paving, striping, fence repair |
| Marketing | High – search and SEO-driven | Moderate – niche and local demand |
| Payroll | Higher – on-site retail/customer service | Lower – remote or tech-enabled management |
Taxes are usually the main swing line, but the tax base changes by asset type. Self-storage leans on building value and improvements. Boat/RV storage leans more on land value and acreage.
Operating costs only show part of the picture. Reserve exposure follows the same split.
Capex Sensitivity
Self-storage capex is usually tied to vertical systems. Boat/RV capex tends to sit in site work and access infrastructure. In both cases, reserves should separate routine maintenance from actual replacement costs.
Pros and Cons by Asset Type
Now that the benchmarks are on the table, the next step is simple: figure out which asset type is easier to underwrite and where cost risk tends to hide.
This isn’t only about how much each property spends. It’s also about how easy it is to normalize those numbers without fooling yourself.
Self-Storage: Cost Analysis Pros and Cons
Self-storage is usually the easier asset to benchmark.
Why? The sector has largely settled on Net Rentable Square Feet (NRSF) as the standard denominator. That gives you a clean way to compare properties with different sizes and unit mixes. In practice, well-run assets often land in the 35% to 45% expense ratio range.
The main downside is capex risk. It tends to pile up in building systems, especially roofs, HVAC, and elevators. If one of those has been neglected, the hit can blow past the usual 2% to 5% of EGI repairs budget in a hurry. Utility costs can also climb, especially in climate-controlled facilities.
Boat/RV storage sidesteps a lot of those vertical-building costs. But that comes with a different problem: it’s tougher to benchmark cleanly.
Boat/RV Storage: Cost Analysis Pros and Cons
Boat/RV storage is often simpler to run, but harder to compare from one asset to the next.
Outdoor lots don’t carry much building-system load, and canopy layouts are still much lighter than climate-controlled self-storage. That part is the easy one.
The hard part is consistency. Unlike self-storage, Boat/RV storage doesn’t have one standard denominator that everyone uses. For most comparisons, use $/SF. For land-heavy lots, use $/acre. For enclosed bays, use $/unit. The key rule is plain: do not switch denominators mid-analysis.
Capex risk shows up in horizontal infrastructure instead. Think paving, drainage, fencing, and security systems. Heavy vehicles wear down pavement faster, and many properties need camera and gate upgrades to stay competitive.
The table below lays out that tradeoff.
| Factor | Self-Storage | Boat/RV Storage |
|---|---|---|
| Benchmarking Consistency | High – NRSF is the standard | Lower – format drives denominator choice |
| Expense Ratio Range | 35%–50% of EGI | ~35%–40% of EGI |
| Utility Burden | Higher, especially for climate-controlled facilities (3%–8% of EGI) | Low, primarily lighting and security |
| Payroll | 8%–15% of EGI for staffed facilities | Lower; often remote or tech-enabled |
| Primary Capex Risk | Roofs, HVAC, elevators | Paving, drainage, fencing, gates |
| Build Cost Range | $45–$120/SF | $15–$35/SF for canopy storage |
Conclusion
After looking at both asset types side by side, one point keeps coming up: the right benchmark matters more than the raw number. A solid cost review ties RevPAF, expense ratio, normalized line items, and capex reserves back to the same underwriting base.
The denominator shapes the whole comparison. Pick one and stick with it. Use RevPAF or $/SF for facility-wide comparisons. Use per-unit or per-space only for labor-heavy line items.
Once that denominator is set, clean up the expenses before you trust what you’re seeing. For self-storage, that means imputing management, market payroll, and post-sale taxes, then reserving capex on its own. That step keeps the comparison defensible. After that, local market data works as the final check.
Local comps matter most. Underwriting should stay tied to nearby market data, not broad averages. When you do that well, you get a defensible underwrite and a cleaner hold/sell call.
FAQs
Which cost metric should I use first?
Start with RevPAF (Revenue Per Available Square Foot). As Nolen Masserman, Managing Director at Oakside, notes, it rolls occupancy and rental rates into one standard metric. That makes it much easier to compare self-storage or boat/RV facilities with different sizes and unit mixes.
Then pair RevPAF with the expense ratio. Looking at both together can help you spot possible operational inefficiencies.
Why isn’t one expense ratio enough?
A single expense ratio can give you a quick snapshot. But it can also gloss over problems or risks that are tied to self-storage assets.
The issue is simple: one top-line number doesn’t show how each cost line may move over time. Property taxes can jump after a sale because of tax reassessments. Payroll can shift with inflation. And automation can change staffing costs in ways a broad ratio won’t show.
As Nolen Masserman, Managing Director at Oakside, notes, investors need a granular, category-by-category review. Without it, return projections and valuations can be overstated.
How should I underwrite capex reserves?
For self-storage and boat/RV facilities, underwrite capital expenditure reserves for recurring maintenance so the property stays turnkey and keeps its long-term value intact. A common rule of thumb is $0.10 per square foot.
As Nolen Masserman, Managing Director at Oakside, and Cameron Vale, President at Oakside, note, accurate expense modeling helps protect asset value and avoids overstating cash flow, profitability, and valuation.