

Want to know how small changes can make or break your self-storage investment returns? Sensitivity analysis is your answer. It examines how shifts in key variables – like rent growth or exit cap rates – impact profitability. For example, a 50-basis-point change in cap rates can swing a property’s value by nearly $500,000. Here’s why it matters:
- Revenue Risks: Month-to-month leases and variable occupancy rates make self-storage income highly sensitive to market changes.
- Expense Modeling: Operating costs like property taxes and inflation can erode profits if underestimated.
- Exit Valuation: Cap rate shifts significantly affect returns, with even minor changes altering IRR by ±400 basis points.
In 2026, investors rely on detailed sensitivity tables and scenario analysis to test how deals hold up under different conditions. This approach ensures better decision-making, from underwriting to exit strategies.
Key Variables in Self-Storage Sensitivity Analysis
Revenue Drivers to Stress-Test
Self-storage revenue hinges on two key factors: quoted street rates and the higher in-place rates achieved through scheduled rent increases (ECRIs). At well-run facilities, the difference can be striking. For instance, Public Storage reported that its average in-place rate was 74% higher than its average move-in rate during Q4 2024. To create a realistic NOI forecast, both the frequency and size of ECRIs need to be carefully stress-tested.
Concessions can lower effective rents by 15–20% compared to listed rates, while climate-controlled units typically command a 13–30% premium over standard drive-up units. These units also tend to retain their value better during economic downturns. Additional revenue streams like tenant insurance, late fees, and retail sales further contribute to income. With 70–85% of customers adopting tenant insurance, this alone can add 3–5% to gross income.
"Gross potential rent changes literally every month." – PropRise
For development or value-add projects, lease-up speed is a critical risk factor. The time it takes to reach stabilization (usually defined as 85–90% occupancy) has recently increased from 30 months to 36 months due to current market conditions. Any delays in this process can quickly impact projected yields and increase carry costs.
Once revenue drivers are analyzed, the next step is to evaluate operating expenses and market variables.
Operating Expenses and Inflation
A thorough understanding of operating expenses is essential for completing a self-storage risk assessment. While self-storage facilities typically boast strong NOI margins – ranging from 60% to 78% for well-managed properties – errors in expense modeling can quickly erode profitability. On average, operating expenses consume 25% to 40% of total revenue, and inflation often impacts multiple cost categories at once.
Property taxes are consistently the largest single expense, accounting for 30% to 35% of total operating costs. When a property is sold, a reassessment based on the new purchase price can significantly raise the tax burden from day one. To avoid surprises, it’s crucial to model property taxes at post-acquisition values rather than relying on historical figures. The table below shows key expense categories and the variables that should be stress-tested for each:
| Expense Category | Typical Range (% of EGI) | Key Stress-Test Variable |
|---|---|---|
| Property Taxes | 8% – 15% | Reassessment upon sale |
| Payroll | 8% – 15% | Automation/kiosk adoption |
| Management Fee | 5% – 6% | Imputed cost for self-managed |
| Utilities | 3% – 8% | Climate control requirements |
| Marketing | 2% – 5% | Lease-up vs. stabilized |
| Insurance | 2% – 4% | Regional/climate risk |
| Maintenance | 2% – 5% | Roof, doors, and pavement |
One common mistake is applying a uniform inflation rate across all expense categories. In reality, costs respond differently to inflation. For example, insurance premiums may rise faster in high-risk areas, while payroll expenses could be controlled through automation. Even for self-managed properties, lenders and institutional investors often assume a 5–6% management fee to account for the cost of third-party management. Overlooking this adjustment can lead to inflated return projections and unrealistic asset valuations.
With expenses accounted for, the focus shifts to market valuation and cap rate analysis.
Cap Rates and Exit Valuation Assumptions
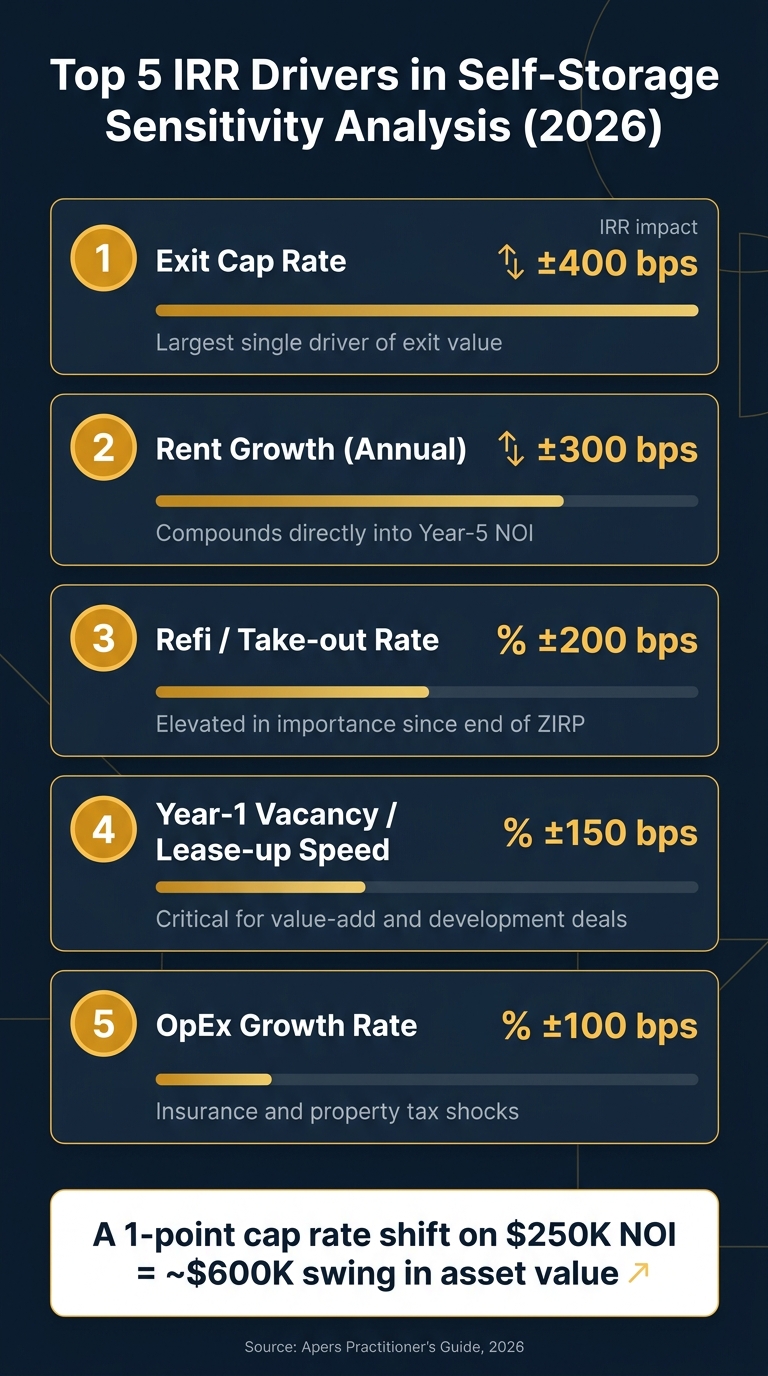
Exit cap rate assumptions play a pivotal role in determining how a deal’s value holds up at disposition. The exit cap rate is one of the most influential variables in self-storage sensitivity analysis, with even small changes significantly impacting returns. For example, a shift in the exit cap rate can alter IRR by ±400 basis points, making it a major driver of return variability in both stabilized and value-add deals. On a facility with $250,000 in stabilized NOI, just a one-point change in the cap rate can swing the value by nearly $600,000.
| Cap Rate | Indicated Facility Value | Value Change from 7% Base |
|---|---|---|
| 6.00% | $4,166,667 | +$595,238 |
| 7.00% | $3,571,429 | Base |
| 8.00% | $3,125,000 | -$446,429 |
| Source: |
As of early 2026, self-storage cap rates have leveled off after expanding by roughly 80 basis points from their 2022 lows. Class A properties are trading near 5.05%, while Class C assets in rural locations can see rates exceeding 8.0%. The experience of deals from 2021–2022 – where sensitivity analyses often modeled only ±50 basis points, while actual market shifts reached 150–200 basis points – highlights the need to align sensitivity ranges with real-world market volatility.
"Small cap-rate differences can create large value differences. That is why the cap rate must be supported by comparable sales, market conditions, facility quality, capital-market context, and the quality of the income stream." – James Lynsard, Certified Business Appraiser, Simply Business Valuation
A practical strategy involves identifying the "equity-wipeout boundary" – the exact combination of cap rate expansion and rent growth decline that would completely erode the initial equity investment. Knowing this threshold before closing provides more actionable insights than simply relying on headline IRR figures.
Integrating Sensitivity Analysis into Self-Storage Underwriting
Top 5 IRR Drivers in Self-Storage Sensitivity Analysis (2026)
Underwriting Workflow and Sensitivity Analysis
Sensitivity analysis is a powerful addition to the underwriting process. The workflow typically starts by collecting key data like rent rolls, expense history, and market comparables. Then, revenue and expense models are built to create a base-case pro forma. At this point, sensitivity analysis shifts the focus from simply asking, "Does this deal work?" to probing, "Under what conditions does it fail?". This shift strengthens the overall risk management strategy.
This perspective is essential because a deal that looks promising at first glance might only succeed under a narrow set of assumptions.
"A deal that performs well across a range of scenarios is fundamentally stronger than one that only succeeds in a narrow, optimistic case." – Hungry-inc
Using Pro Forma Models as a Base Case
The pro forma acts as the foundation for sensitivity testing. It’s built on solid data, including defensible rent rolls, realistic expense ratios, and market-supported cap rates. From this base, key variables influencing return variance are adjusted. According to the Apers Practitioner’s Guide, the following five inputs have the most significant impact on IRR:
| Rank | Input Variable | Typical IRR Impact (±) |
|---|---|---|
| 1 | Exit Cap Rate | 400 bps |
| 2 | Rent Growth (Annual) | 300 bps |
| 3 | Refi / Take-out Rate | 200 bps |
| 4 | Year-1 Vacancy / Lease-up | 150 bps |
| 5 | OpEx Growth Rate | 100 bps |
Self-storage leases operate on a month-to-month basis, and revenue can vary significantly by season. This makes monthly modeling far more accurate than annualized projections, which can distort results by 10–20%. Using Excel‘s XIRR and XNPV functions instead of standard IRR/NPV formulas also helps account for the irregular timing of cash flows often seen in storage deals.
When creating two-way sensitivity tables, identifying the "break-even contour" is particularly insightful. For instance, pinpointing that a 6.50% exit cap combined with 9.5% annual rent growth still meets the target hurdle rate provides a clearer picture than relying solely on a single IRR figure.
Once revenue, expenses, and return drivers are analyzed, attention turns to financing terms.
Debt Structure and Financing Sensitivities
Financing terms play a critical role in self-storage underwriting. The refi/take-out rate, for example, has risen in importance, ranking as the third most impactful variable by 2026 due to the volatility of floating-rate bridge debt in a post-ZIRP environment. Relying on static interest rate assumptions can lead to major missteps in underwriting.
Debt Service Coverage Ratio (DSCR) is another key metric. Instead of treating it as a one-time calculation, it should be modeled as a continuous variable to account for monthly revenue fluctuations. Most traditional lenders require a DSCR between 1.20x and 1.35x. By modeling DSCR on a monthly basis, you can ensure the property remains above the threshold, even during slower revenue months.
Another critical indicator is the spread between levered and unlevered IRR. A wide spread often signals that returns are heavily dependent on financing terms rather than the asset’s performance. This becomes a major risk if interest rates shift unfavorably. For deals at 65% LTV, calculating the percentage decline in value – 35% for 65% LTV deals – that would wipe out equity offers a concrete measure of downside risk.
"A 2026 IC deck that doesn’t walk a committee through exit-cap, rent-growth, and refi-rate sensitivity tables alongside the base-case IRR isn’t getting approved at most institutional shops." – Emily Jonsson, Associate of Technical Staff, Apers
Analytical Methods for Self-Storage Sensitivity Analysis
These methods enhance the evaluation of risks by quantifying how changes in variables influence investment outcomes.
One-Way and Two-Way Sensitivity Tables
A one-way sensitivity table focuses on a single variable – like the exit cap rate – to illustrate its effect on the internal rate of return (IRR) over a range of values. For instance, testing exit cap rates in increments of 0.25% to 0.50% around the base assumption can highlight shifts in returns without making the analysis overly complex.
Two-way sensitivity tables take this a step further by analyzing two variables simultaneously – such as rent growth and exit cap rate – creating a matrix of IRR outcomes. This approach helps pinpoint the "break-even contour", or the combinations of inputs that allow a deal to meet its hurdle rate. Typically constructed using Excel’s Data Table feature, these tables provide a clear and concise view of all potential outcomes.
| Variable | Recommended Test Range | Impact Area |
|---|---|---|
| Rental Growth | 2% – 6% | Cash Flow / NOI |
| Vacancy Rates | ±2% – 3% from base | Revenue / DSCR |
| Exit Cap Rates | ±0.25% – 0.50% | IRR / Sale Proceeds |
| Interest Rates | ±0.50% – 1.0% | Cash-on-Cash / DSCR |
| Operating Expenses | 3% – 7% growth | NOI |
Building on these sensitivity tables, scenario analysis combines multiple variables to simulate broader market conditions.
Scenario Analysis for Risk Assessment
While sensitivity tables focus on the effect of individual inputs, scenario analysis combines several variables to reflect specific market environments. A typical framework involves creating three scenarios: Base, Upside, and Downside. For example, a downside scenario might model cap rate expansion, slower rent growth, and higher operating expenses – factors that often coincide during market downturns.
"The credibility case lives in the sensitivity tables, not the headline." – Emily Jonsson, Associate of Technical Staff, Apers
Avoid using Excel’s built-in Scenario Manager, as it hides inputs within dialog boxes, making them harder to review. Instead, use a tabbed workbook or dropdown-driven input switches to keep assumptions transparent and easy to verify. Scenario analysis also supports stress testing, helping to determine the point at which a deal might lose equity entirely.
For more complex investment scenarios, Monte Carlo simulations can add another layer of precision.
Monte Carlo Simulations
Monte Carlo simulations use statistical techniques to sample inputs from probability distributions, running thousands of iterations to create a range of possible outcomes. Instead of focusing on a single IRR figure, this method provides a probability-based outcome. For example, it might reveal a 78% probability that a deal clears a 15% IRR hurdle.
In May 2026, Apers conducted a Monte Carlo simulation for a $50M value-add acquisition. Using a normal distribution for the exit cap rate – with a mean of 5.75% and a standard deviation of 40 basis points – and running 1,000 iterations, the analysis produced:
- A mean IRR of 19.5%
- A median IRR of 19.6%
- A 10th percentile IRR of 12.8%
This type of analysis can be performed in Excel using the =NORM.INV(RAND(), mean, std_dev) function.
Monte Carlo simulations are most useful for complex deals, such as large portfolios, structured finance products, or transactions with detailed waterfall mechanics. For standard self-storage acquisitions, however, a well-designed two-way sensitivity table focusing on variables like exit cap rate and rent growth is often sufficient.
"The probability statement is only as defensible as the distributions feeding it. If exit cap volatility was assumed at 25 bps but realized at 200 bps, the probability statement is fiction." – Emily Jonsson, Associate of Technical Staff, Apers
sbb-itb-09b4138
Applying Sensitivity Analysis to Institutional Investment Strategy
Identifying the Variables That Drive Risk and Return
In 2026, institutional investors prioritize variables based on their impact on IRR. The top three factors are exit cap rates (±400 bps), rent growth (±300 bps), and the refinance/take-out rate (±200 bps). Rent growth directly affects Year-5 NOI, while the refinance/take-out rate has climbed in importance, moving from sixth to third place since the end of the zero-interest-rate environment. This shift has fundamentally changed how deals are underwritten.
| Rank | Variable | IRR Impact (±) | Why It Matters in 2026 |
|---|---|---|---|
| 1 | Exit Cap Rate | 400 bps | Largest driver of exit value |
| 2 | Rent Growth | 300 bps | Compounds into Year-5 NOI |
| 3 | Refi / Take-out Rate | 200 bps | Elevated since end of ZIRP |
| 4 | Lease-up Speed | 150 bps | Critical for value-add and development |
| 5 | OpEx Growth | 100 bps | Insurance and tax shocks |
For value-add deals, lease-up speed is a critical but often underestimated factor. If occupancy drops below 85–90% for even a short period, it can significantly reduce yields and increase debt costs – making this variable especially important in today’s market conditions.
Making Decisions Based on Sensitivity Findings
Sensitivity analysis plays a direct role in shaping strategic decisions. Investors use these findings to fine-tune bid strategies, structure debt, and time their exits. By mapping the break-even points for exit cap rates and rent growth, they can determine how to meet hurdle rates. For instance, a deal with a base-case IRR of 19.8% at a 5.75% exit cap and 9% rent growth might still work at a 6.50% exit cap – but only if rent growth stays above 9%. Understanding this threshold helps investors decide how aggressively to bid and what protections to negotiate.
"A deal that performs well across a range of scenarios is fundamentally stronger than one that only succeeds in a narrow, optimistic case." – Hungry-Inc
Since refinance risk now ranks as the third most influential factor for IRR, investors are placing greater emphasis on structuring debt and lock-out periods to manage rate volatility. Institutional IC memos in 2026 increasingly include threshold statements – specific benchmarks detailing the percentage of value decline a deal can withstand before equity is impacted. These benchmarks are often aligned with the Federal Reserve‘s 2026 severely adverse scenario, which assumes a 40% drop in commercial real estate values. Such thresholds guide decisions on both debt structuring and exit timing.
How Oakside Co Supports Sensitivity Analysis for Self-Storage Investors

Oakside Co exemplifies how sensitivity analysis can refine underwriting and strategy. Their approach goes beyond simple models, incorporating deep market insights to stress-test critical variables like exit cap rates, rent growth, and refinancing risks over different hold periods. Oakside Co specializes in self-storage and boat & RV transactions, offering institutional clients the tools to navigate these complexities with precision.
Conclusion: Using Sensitivity Analysis to Make Stronger Self-Storage Investment Decisions
Sensitivity analysis plays a critical role in effective self-storage underwriting. For instance, a 50 basis point shift on a property with $320,000 NOI can result in a nearly $500,000 change in asset value. Integrating this type of analysis throughout the underwriting process ensures better risk management and more informed decision-making.
By testing key variables and modeling different scenarios, you can see how small changes – like occupancy rates, pricing strategies, lease-up timing, or expense adjustments – can have a significant impact on NOI, exit value, and overall returns. These findings are directly tied to the sensitivity models and risk factors discussed earlier.
"Small changes in occupancy, pricing discipline, staffing, or controllable expenses can materially impact NOI, which is why lenders and buyers focus on it so heavily." – Self-Storage Investment Analysis & Underwriting Model
Institutional investors who rigorously stress-test across scenarios gain a competitive edge. They can bid with confidence, structure debt wisely, and time their exits effectively. For example, maintaining a DSCR between 1.20x and 1.35x under less favorable conditions, distinguishing between climate-controlled and standard rates, and forecasting monthly cash flows all contribute to sharper underwriting practices.
Oakside Co brings a high level of analytical expertise to self-storage transactions, helping institutional clients create robust sensitivity frameworks. These frameworks stand up to scrutiny in everything from internal reviews to lender negotiations. Using the techniques outlined here, disciplined sensitivity analysis remains a cornerstone for achieving the best possible outcomes.
FAQs
What sensitivity ranges should I use for exit cap rates and rent growth?
When conducting sensitivity analysis for self-storage investments, it’s crucial to account for potential market fluctuations. Here’s how to approach it effectively:
- Exit Cap Rates: Test these in increments of 25–50 basis points. Ensure your analysis covers at least 400 basis points around your base assumption. This range helps you evaluate how shifts in the market could impact your investment.
- Annual Rent Growth: Analyze this within a range of ±300 basis points. Doing so allows you to understand how changes in rent growth could compound over the hold period, ultimately affecting your projected net operating income.
By applying these methods, you can better prepare for varying market conditions and make more informed investment decisions.
How do I model month-to-month leases and seasonality in a storage pro forma?
To accurately model self-storage investments, steer clear of using annualized data. Since leases in this sector are typically month-to-month, revenues can fluctuate significantly. Instead, opt for a pro forma with 12 monthly columns per year, allowing you to assign specific rate and occupancy assumptions for each month. This approach helps capture seasonal demand cycles – such as peak months from May to September – and provides a clear view of lease-up velocity until the property reaches stabilization.
For projections, rely on trailing 12-month data. This method reflects actual market trends and avoids the distortions that annualized averages can create. It’s a more reliable way to align your model with real-world performance patterns.
What’s the quickest way to find the “equity-wipeout” point in my deal?
To figure out your equity-wipeout point, you’ll need to run a sensitivity analysis. This means tweaking key performance factors in your underwriting model until cash flow or returns hit zero. Pay close attention to stress-testing Net Operating Income (NOI) by examining factors like occupancy rates, operating expenses, and debt service coverage ratios. For a more detailed approach, companies like Oakside Co provide institutional-grade analysis, helping investors assess these risks and maximize value throughout the investment process.