
Competitive analysis is essential for investors in the storage sector. It helps identify market saturation, analyze demand, and assess competitor positioning. This process impacts every phase of investment – acquisition, development, and eventual sale. Overlooking local trends can lead to costly mistakes like mispricing or mismatched unit offerings. Implementing effective pricing strategies can help mitigate these risks and maximize NOI.
Key takeaways:
- Storage demand is hyper-local: 70% of renters live within 20 minutes of their unit.
- Competitor tiers matter: Primary competitors use dynamic pricing and strong marketing, while tertiary ones may lack digital presence.
- Data normalization is critical: Adjust rates for concessions and separate unit types for accurate comparisons.
- Market risks include: New supply, seasonal demand swings, and reliance on single demand drivers (e.g., universities or military bases).
Defining the Competitive Set and Trade Area
To address the risks and saturation concerns discussed earlier, the first step in effective market positioning is defining your competitive set. Simply put, you need to know exactly which facilities you’re competing against. This means setting clear boundaries, which are essential for accurate pricing benchmarks and saturation assessments.
How to Establish Trade Areas for Self-Storage
The size of your trade area largely depends on population density. Here’s how it typically breaks down:
- Urban and primary markets: A 1- to 3-mile radius is the usual starting point.
- Suburban and secondary markets: A 3- to 5-mile radius works best.
- Rural and tertiary markets: These areas can span 5 to 10 miles – or even farther in sparsely populated regions.
However, relying on straight-line distance can be misleading. Physical barriers like rivers, highways, or railroads can limit accessibility. For instance, a facility might be geographically close but practically out of reach if separated by a major interstate.
To refine your trade area, start by mapping where your current customers live. Property management software can help you identify your facility’s actual geographic pull and highlight nearby competitors your customers might have considered instead. Tools like Radius+ can add demographic data and drive-time analysis to make this evaluation even more precise.
Boat and RV storage, however, operates under different trade area considerations.
Trade Area Factors Specific to Boat and RV Storage
When it comes to boat and RV storage, the rules shift significantly. Trade areas for these facilities can extend up to 50 miles, depending on population density and proximity to recreational destinations like lakes, national parks, and outdoor activity hubs. In this case, the primary demand driver isn’t household density but access to leisure spots.
Other factors, like HOA or municipal restrictions on RV parking, as well as premium amenities such as wash bays or dump stations, can expand the effective trade area beyond what is typical for self-storage. Pricing also varies: some facilities charge per stall, while others charge by the linear foot. Standardizing these pricing metrics is critical for making fair comparisons across your trade area.
Once you’ve defined your trade area, the next step is to categorize competitors based on their relevance.
Classifying Competitors by Relevance
Breaking competitors into tiers helps you better understand their impact on your market. Here’s a simple framework:
| Tier | Characteristics |
|---|---|
| Primary | State-of-the-art facility, active Google Ads campaigns, dynamic pricing, strong online presence, online rental capabilities |
| Secondary | Functional facility, basic website, static pricing, minimal marketing efforts |
| Tertiary | Outdated facility, no digital presence, poor accessibility, lacks climate control |
For example, a tertiary competitor with low curb appeal and fixed pricing has a very different market impact than a well-funded operator using aggressive paid search campaigns and daily rate adjustments. Treating them the same skews your analysis. To get the most accurate insights, group competitors by unit type and then by tier within each category. This approach ensures your comparisons are meaningful and actionable.
sbb-itb-09b4138
Collecting and Organizing Market and Competitor Data
Once you’ve defined your competitive set, the next step is to gather reliable data and organize it effectively. The accuracy of this data is critical – mistakes here can lead to faulty assumptions and impact the outcome of a deal. It’s also essential to evaluate market-level factors that influence storage demand.
Market-Level Data Inputs
At the market level, several factors shape demand for storage spaces. These include population density, household income levels, housing characteristics (like the ratio of renters to homeowners and average home sizes), and local employment trends. Keeping an eye on permits, active construction projects, and recent completions can also help identify supply gaps.
Tools like Radius+ make this process easier by combining demographic insights with supply tracking. For historical rate trends in a specific trade area, many operators rely on platforms like Store Track.
Competitor-Level Data Collection
When it comes to competitor data, a combination of online research and direct outreach works best. Aggregator websites such as SpareFoot, SelfStorage.com, and Storage.com are great starting points for comparing rates and availability. However, these platforms often miss key details like real-time promotions or dynamic pricing strategies tied to occupancy levels.
To fill in the gaps, secret shopping is invaluable. This approach uncovers details like current occupancy, waitlist availability, move-in promotions, and the overall condition of a facility. For boat and RV storage, it’s also important to confirm whether pricing is quoted per stall or per linear foot, and to verify the type of enclosure offered (fully enclosed, three-sided, or roof-only).
Once you’ve collected the raw data, the next step is to normalize it for clearer insights and actionable conclusions.
Normalizing and Structuring Data for Analysis
Raw data from different sources rarely aligns perfectly, which is why normalization is a vital step. For example, it’s important to separate climate-controlled units from non-climate-controlled ones rather than blending them – failing to do so can skew rate assumptions.
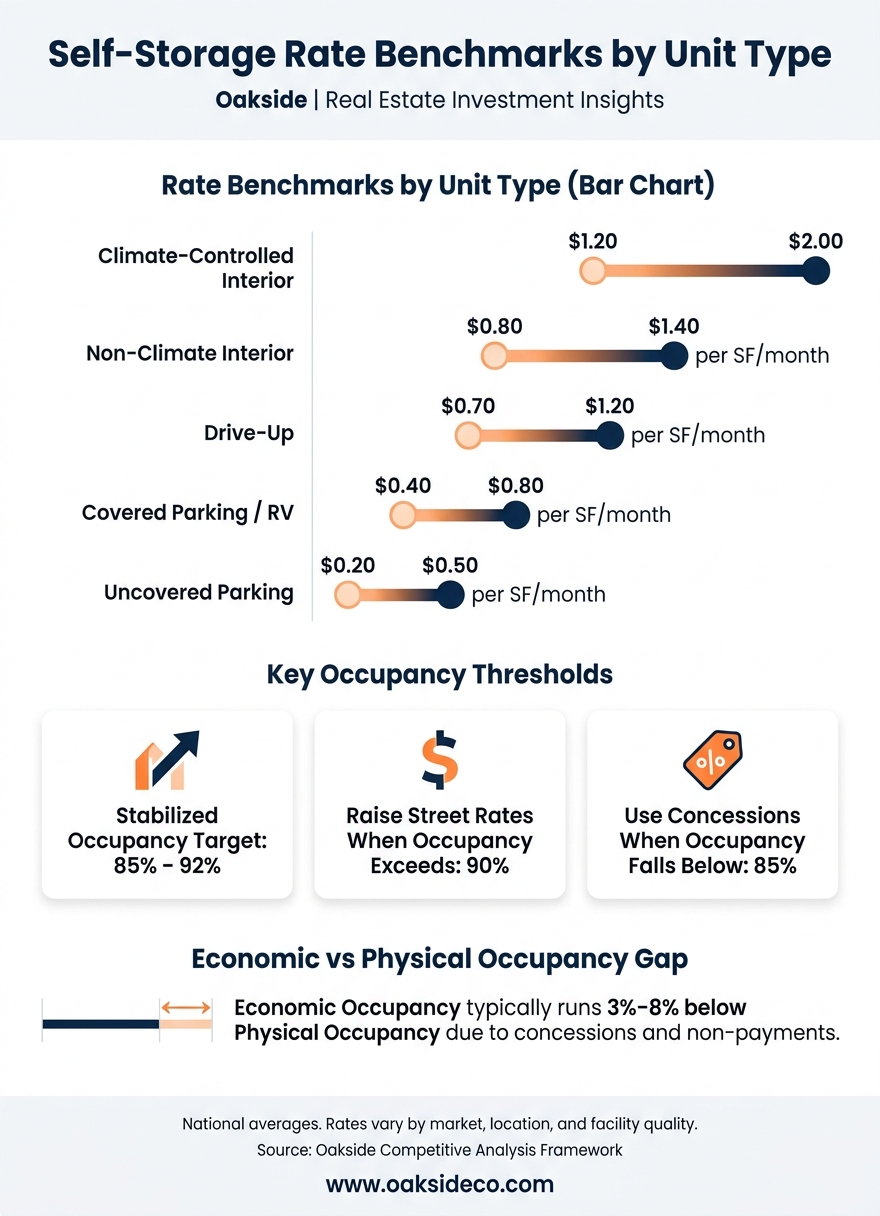
Additionally, advertised rates should be adjusted for concessions like “first month free” deals. Economic occupancy, which accounts for discounts and promotions, typically falls 3% to 8% below physical occupancy.
Certain metrics are key to understanding performance:
- Revenue Per Available Square Foot (RevPAF): This is calculated by dividing annual rental revenue by the total rentable square footage. It measures overall performance, regardless of facility size.
- Revenue Per Occupied Square Foot (RevPOF): This metric divides annual rental revenue by occupied square footage, showing the effective rate achieved for rented units. It’s particularly useful for spotting areas where pricing might lag behind market rates.
- Economic Occupancy: This is determined by dividing actual revenue by gross potential revenue. It reflects the impact of concessions and non-payments on revenue.
| Metric | Formula | What It Indicates |
|---|---|---|
| RevPAF | Annual Rental Revenue ÷ Total Rentable SF | Overall performance, independent of facility size |
| RevPOF | Annual Rental Revenue ÷ Occupied SF | Effective rate on rented units compared to advertised rates |
| Economic Occupancy | Actual Revenue ÷ Gross Potential Revenue | Revenue effects of concessions and non-payments |
For owner-operated facilities, including a 5–6% management fee and market-rate payroll ensures consistency when comparing market and competitor data. This refinement ties directly back to earlier trade area evaluations, giving you a clearer picture of performance and opportunities.
Analyzing Market Position and Competitive Risks
Self-Storage Rate Benchmarks by Unit Type
With normalized data in place, it’s time to evaluate your asset’s position in the market and identify potential risks.
Assessing Market Saturation and Demand
Start by analyzing demand at the unit level rather than relying solely on overall facility occupancy. Here’s why: a facility might show 90% overall occupancy, but that figure could mask the fact that its 10×10 climate-controlled units are fully rented while larger drive-up units sit at only 70% occupancy. This detailed view is crucial for setting effective pricing strategies.
Strong demand indicators include competitors reaching full occupancy in specific unit sizes, active waitlists, and stable or increasing street rates. For boat and RV storage, factors like enclosure type play a big role – fully enclosed stalls typically fetch higher rates than open or three-sided options. Amenities such as wash or dump stations can also influence demand and pricing.
Stabilized facilities generally aim for physical occupancy rates between 85% and 92%. If competitors in your trade area consistently exceed this range, it might signal room for additional supply. On the flip side, if occupancy rates are falling below this target, new supply could be affecting the market. These granular insights provide a foundation for comparing your asset’s pricing and occupancy performance.
Benchmarking Pricing and Occupancy
Once you’ve assessed demand, the next step is to benchmark your asset’s rates and occupancy against competitors. A key metric to use here is RevPAF (Revenue Per Available Square Foot), which combines rate and occupancy into one figure for easy comparison.
Differentiate between the street rate – the advertised move-in price – and the market rate, which reflects the median asking rate among competitors. The market rate is a reliable benchmark for pro forma assumptions. If your asset’s RevPAF is lagging behind the market rate, it might be time to consider rent adjustments to stay competitive.
Here’s a look at typical national rate benchmarks by unit type:
| Unit Type | Typical Rate/SF/Month |
|---|---|
| Climate-Controlled Interior | $1.20 – $2.00 |
| Non-Climate Interior | $0.80 – $1.40 |
| Drive-Up | $0.70 – $1.20 |
| Covered Parking / RV | $0.40 – $0.80 |
| Uncovered Parking | $0.20 – $0.50 |
A good rule of thumb: increase street rates when your occupancy exceeds 90% to maximize revenue. Conversely, use concessions strategically to attract tenants when occupancy drops below 85%. Keep an eye on economic occupancy, though – aggressive promotions might inflate physical occupancy but won’t necessarily improve cash flow. Accurate benchmarks can also help you spot risks that could impact performance.
Identifying Competitive Risks
One of the biggest risks in storage underwriting is new supply entering the market. For example, a new 80,000 SF facility opening within three miles could reduce occupancy by 5% to 10% and force rate reductions across the area. Desktop research often misses projects still in the entitlement or permitting stages, so it’s worth checking local planning commission agendas, active permits, and supply pipeline tools like Radius+ to stay ahead of upcoming developments.
Demand drivers can also present risks. Markets heavily reliant on a single university, military base, or major employer may appear stable but could be vulnerable to policy changes, base closures, or employment shifts. Seasonal demand swings are another factor – revenue can fluctuate by 10% to 15% within a single quarter, with peak activity typically occurring from May through September. Relying solely on peak-season rates without accounting for off-season performance can lead to costly mistakes.
Large institutional operators often use dynamic pricing models that adjust rates daily based on unit-type occupancy. Independent operators should pay close attention to these trends. Secret shopping can be an effective way to gather real-time data on availability, promotions, and pricing adjustments. By understanding these risks, you’ll be better equipped to make informed strategic and underwriting decisions , often requiring sensitivity analysis to stress-test your assumptions, setting the stage for the next steps in your analysis.
Turning Analysis into Strategy and Underwriting
Once you’ve gathered competitive data and completed risk assessments, the next step is turning those insights into practical underwriting strategies.
Setting Realistic Rent and Occupancy Assumptions
Break down pro formas by unit type instead of blending occupancy rates across all units. Each type – like climate-controlled, drive-up, or RV and boat storage – has its own demand patterns and pricing potential.
Use the market rate (the median asking rate among competitors) as your baseline. This metric reflects broader supply-demand trends better than fluctuating street rates. Structure pro formas with 12 monthly columns to account for seasonal peaks, particularly from May to September. For RV and boat storage, confirm whether local pricing is based on linear feet or per stall. For smaller acquisitions, include a 5–6% management fee and market-rate payroll in your expense calculations to avoid overestimating NOI.
Strategic Adjustments for New Developments and Expansions
Once you’ve established realistic assumptions, tailor your strategy to fill market gaps. If competitors dominate in standard units but lack premium options like climate-controlled spaces, focus on differentiating your asset.
During lease-up, set initial rates near the lower end of the market to attract tenants. Once occupancy stabilizes – typically 85–92% – transition to a revenue-driven pricing model. For a 50,000-square-foot facility, this stabilization usually occurs within three to four years.
Planning for Hold Periods and Exit Strategies
Underwriting doesn’t stop after acquisition. Refine your strategy throughout the hold period by updating competitive data quarterly. This allows you to stay ahead of market shifts. Operators who monitor competitor pricing and occupancy trends are better prepared to make informed, proactive decisions.
When planning an exit, consider local supply-demand dynamics and watch for softening street rates, which can signal a good time to list the asset. Competitive analysis also plays a key role in supporting refinancing efforts.
At Oakside, we use detailed market analysis to help clients position their assets effectively – whether they’re refinancing, selling, or holding for the long term.
"The operators and investors who consistently win on exit are the ones who’ve been tracking their competitive position throughout the hold – not just when they decide to sell." – Nolen Masserman, Managing Director at Oakside
Conclusion: Getting the Most from Competitive Analysis
Competitive analysis isn’t a one-and-done task – it’s a continuous process that influences every step of an investment, from buying to operations and the final exit. Investors who embrace this approach consistently make smarter choices than those relying on outdated information or gut instincts.
The main lesson here is simple: data outperforms guesswork. Consider these benchmarks: the national average street rate stands at $1.50 per square foot, over 40% of new supply is climate-controlled, and a typical 50,000-square-foot facility reaches stabilization within three to four years. These figures provide a reliable starting point for underwriting decisions. Understanding self-storage cap rates is equally vital for accurate valuation.
But numbers are only part of the story. Competitive analysis also uncovers qualitative gaps that translate into actionable opportunities. Pinpointing at least three unique selling points (USPs) based on competitors’ weaknesses – like poor curb appeal, limited online rental options, or weak follow-up practices – can significantly enhance performance.
Tracking key metrics such as RevPAF, physical and economic occupancy, and quarterly pricing trends provides a clear snapshot of competitive standing. When building pro formas, use 12 monthly columns instead of annual averages to better capture the impact of seasonal demand fluctuations.
This thorough approach keeps your strategy adaptable in a constantly changing market.
"The operators and investors who consistently win on exit are the ones who’ve been tracking their competitive position throughout the hold – not just when they decide to sell." – Nolen Masserman, Managing Director at Oakside
FAQs
What’s the fastest way to define my storage facility’s true trade area?
To pinpoint your true trade area, start by analyzing where your tenants are coming from. Use property management software to map customer locations and compare these with competitor maps. This comparison helps you understand the radius that’s driving demand for your property.
For urban locations, the trade area often spans 1–3 miles, while rural facilities may draw customers from as far as 10 miles away. To fine-tune your analysis, leverage tools that provide demographic overlays and drive-time insights. These features can give you a clearer picture of your property’s reach and potential customer base.
How do I normalize competitor rates when they offer concessions or use dynamic pricing?
To get a clear picture of competitor rates, start by collecting street rates – these are the publicly listed prices. Gather this data daily over a period of 60 to 90 days. Why? This timeframe helps you account for fluctuations caused by seasonality or demand-driven pricing algorithms. The result is a more stable and accurate rate sheet.
But don’t stop there. Include concessions in your audit. Concessions, like move-in discounts or promotional offers, can significantly impact the actual price customers pay. By factoring these into your calculations, you’ll arrive at effective rates – a more realistic reflection of market-supported rents rather than just the lowest advertised prices. This approach ensures your comparisons are grounded in real-world pricing dynamics.
Which underwriting assumptions change most when new storage supply is coming?
When fresh storage supply hits the market, it shakes up near-term demand and pricing dynamics. Occupancy rates often feel the strain, especially for unit types that overlap with the new supply. This can result in reduced base rents and a heavier focus on promotions to attract tenants. To stay competitive, adjust your projections to align with updated rent growth timelines and revenue expectations. Consider factors like competitor pricing strategies, the volume of local supply in the pipeline, and the specific dynamics of your trade area.