
Picking the right location for a storage facility isn’t just about costs – it’s about ensuring there’s enough demand to make it profitable. Skipping demand analysis can lead to costly mistakes, even if national trends look promising. Here’s what you need to know:
- What is Market Demand Analysis?
It’s a method to assess how much storage space (Net Rentable Square Footage or NRSF) an area can support. This includes evaluating local supply, demographics, and planned developments. - Why It Matters:
Local markets don’t always match national trends. A site might seem like a good investment, but without proper analysis, you risk oversaturation or poor returns. - Key Steps in Demand Analysis:
- Define the Trade Area: Use drive-time analysis to identify where customers will likely come from.
- Measure Supply: Look at existing facilities and upcoming projects to assess market balance.
- Analyze Demographics: Study population density, income, and housing trends to predict demand.
- Use Performance Metrics: Metrics like occupancy rates and rent trends can act as demand proxies.
- Emerging Trends:
Sun Belt states like Florida and Texas are seeing higher demand due to migration. Seasonal factors, like snowbird communities or RV/boat storage near lakes, also influence demand patterns. - Risk Management:
Scenario testing and sensitivity analysis help investors prepare for risks like slower lease-ups or unexpected competition.
Data Inputs for Demand Analysis
The quality of a demand analysis hinges on the data you use. To effectively model supply-demand dynamics or evaluate development scenarios, you need to focus on four key areas: trade area boundaries, existing and planned supply, demand drivers, and performance metrics.
Defining the Trade Area
The trade area represents the geographic region where a storage facility can realistically attract customers. This is typically defined using drive-time analysis, adjusted for barriers like highways, rivers, or railroads that might limit access.
Drive-time thresholds depend on the market type:
- Urban areas: 1–3 minutes
- Suburban areas: 3–5 minutes
- Rural areas: 10–15 minutes or more
Getting this boundary wrong can skew every subsequent calculation. Tools like GIS mapping software can help visualize these boundaries, pinpoint demand hotspots, and identify underserved areas.
Once the trade area is defined, the next step is to assess the current supply and any planned developments.
Measuring Existing Supply and Planned Pipeline
Market balance is often measured using NRSF (Net Rentable Square Feet) per capita. Industry databases now track over 70,000 facilities across the U.S., offering granular data on existing supply.
However, current supply is only half the picture. It’s equally important to monitor the development pipeline. Local building permits provide insight into planned projects, which could shift a seemingly undersupplied market toward saturation within 24–36 months. Reviewing unit mix is also critical to capture specific demand nuances.
After understanding supply metrics, the next step is to analyze the demographic factors driving demand.
Demand Drivers and Demographic Indicators
Demographics reveal why people in a specific area might need storage. Key indicators include population density, household formation rates, median income, and housing trends. Income levels, for example, influence the type of storage a market can sustain – higher-income areas often see stronger demand for climate-controlled units, indoor RV/boat storage, or even niche options like wine storage.
For RV and boat storage, two factors are particularly important:
- Proximity to recreational water bodies
- Local restrictions on residential parking or outdoor storage
Areas with strict HOA rules or municipal codes against storing boats or RVs at home often show higher demand for dedicated storage facilities. Additionally, tracking housing and commercial development activity can help predict future demand from new residents and businesses.
These demographic insights are essential for informed site selection and investment strategies.
Using Performance Metrics as Demand Proxies
When direct demand data isn’t available, facility performance metrics can act as reliable indicators. Here’s a breakdown of key metrics and what they reveal:
| Performance Metric | What It Signals |
|---|---|
| Verified Occupancy Rate | Shows how much of the current supply is being used; high occupancy suggests unmet demand. |
| Achieved Rents vs. Asking Rents | Reflects the actual prices consumers are willing to pay, beyond advertised rates. |
| Lease-up Rate | Indicates how quickly new supply is absorbed; faster rates point to stronger demand. |
| Historical Rate Trends | Provides insight into market performance over time, across various economic conditions. |
| Ancillary Income | Revenue from extras like insurance or retail sales signals intense facility usage. |
The growing reliance on verified, facility-level data – sourced from CMBS disclosures and reported financials – has significantly improved the accuracy of underwriting. This approach eliminates the risks associated with relying on web-scraped prices or anecdotal occupancy estimates. By analyzing how a market has performed historically, rather than relying on operator claims, investment decisions become far more grounded.
These metrics provide a strong foundation for data-driven strategies, ensuring better alignment between market realities and investment goals.
sbb-itb-09b4138
Methods for Conducting Market Demand Analysis
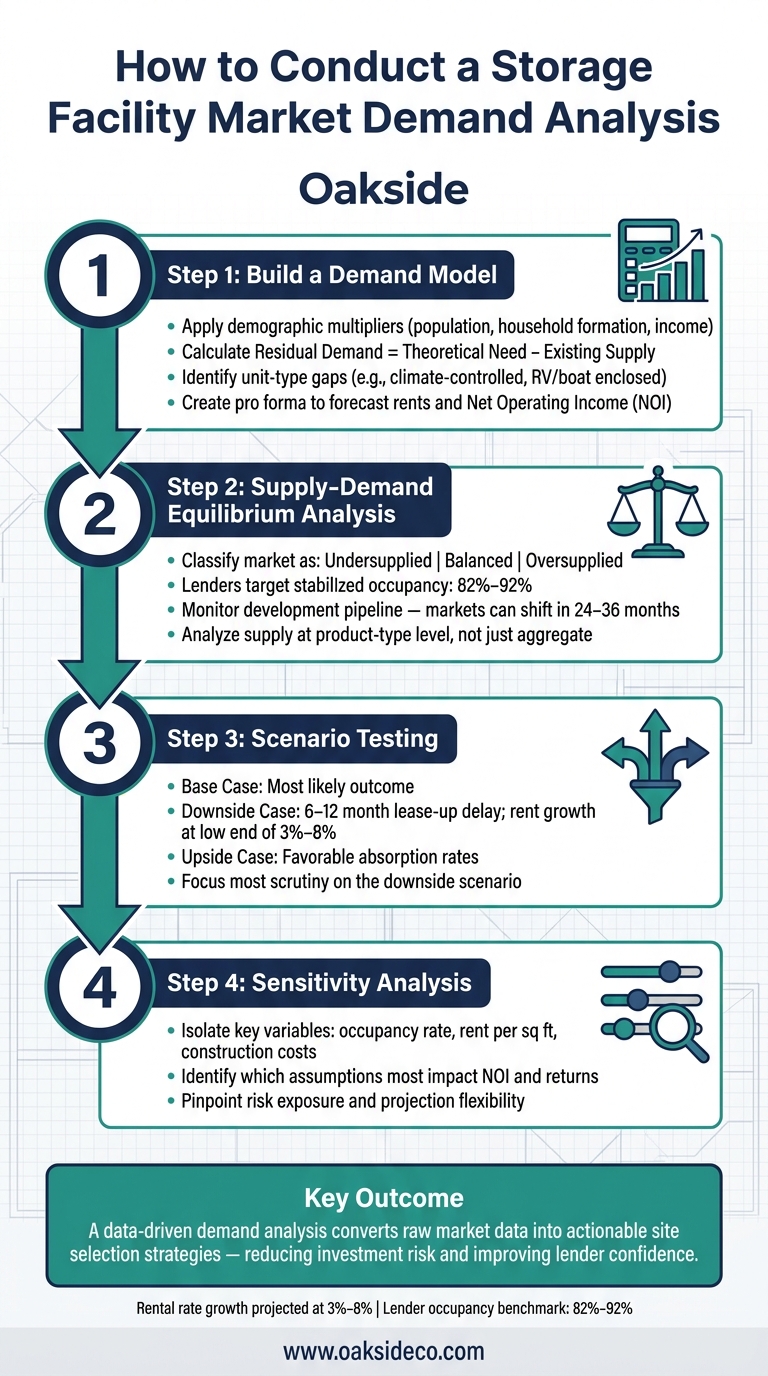
Storage Facility Market Demand Analysis: 4-Step Framework
Turning raw data into actionable insights is key for effective site selection. By using defined trade areas, supply metrics, demographic data, and performance indicators, you can apply several analytical methods to assess market demand.
Building a Demand Model
A demand model translates demographic data into an estimate of storage demand. The main output here is Residual Demand – the Net Rentable Square Footage (NRSF) that a market can accommodate beyond its current supply.
To calculate this, apply demographic multipliers like population, household formation, and income levels across the trade area to estimate the theoretical need for storage. Then, subtract the existing supply to determine residual demand. For a more detailed analysis, adjust the model to focus on gaps in specific unit types. For instance, while overall demand might look sufficient, the market could still lack climate-controlled units or enclosed RV/boat storage options, even if traditional drive-up units are plentiful.
For RV and boat storage, it’s important to account for the different storage tiers – open parking, steel canopy-covered spaces, and fully enclosed industrial warehouses – since demand and pricing vary significantly for each type.
Finally, create a pro forma to forecast potential rents and Net Operating Income (NOI). Compare these projections with the current and planned supply to identify whether the market is balanced or skewed.
Supply-Demand Equilibrium Analysis
This method directly compares the demand model’s results to the existing and upcoming supply, categorizing the market as undersupplied, balanced, or oversupplied. These classifications are critical for shaping the investment strategy.
An undersupplied market, where occupancy rates are high and rents are climbing, often signals a strong opportunity to build or buy. On the flip side, oversupplied markets – or those with already high per capita NRSF – may demand caution. Lenders typically look for stabilized occupancy rates between 82% and 92% when assessing market health and tend to avoid areas where supply metrics are stretched.
It’s also essential to examine supply at the product-type level. The development pipeline plays a major role here – what looks like an undersupplied market today could become saturated in 24–36 months if multiple projects currently in the permitting stage come to fruition. Relying on aggregate supply figures alone can miss these nuances.
To handle these uncertainties, scenario testing becomes essential.
Scenario Testing and Sensitivity Analysis
Run three scenarios to test your projections: a base case for the most likely outcome, a downside case for slower lease-ups and weaker demand, and an upside case for favorable absorption.
The downside scenario deserves the most attention. Given current market conditions, lenders are more cautious, often underwriting longer stabilization periods and higher vacancy rates than they did a few years ago. For this scenario, consider a 6–12 month delay in lease-up and assume annual rent growth at the lower range of 3%–8%.
Sensitivity analysis further helps by isolating variables like occupancy rates, rent per square foot, and construction costs. This process identifies which assumptions most affect NOI and returns. By pinpointing the most sensitive variables, investors can better understand both the risks and the flexibility in their projections.
Key Findings from Recent Market Studies
Recent research highlights emerging trends, seasonal shifts, and diverse customer needs, reinforcing the importance of a data-driven approach in the self-storage industry.
National and Regional Trends
Sun Belt states like Florida, Texas, Arizona, and the Carolinas are leading the pack in storage demand, fueled by migration from Northern states and California. This population movement, often driven by retirees seeking warmer climates, is creating an immediate need for new storage facilities in these regions.
On a national scale, the market is showing signs of stabilization following a slower period after the pandemic. New construction activity has slowed compared to previous years, which has helped existing facilities maintain occupancy levels and increase rental rates. Currently, rental rate growth is projected between 3%–8%, and the industry boasts a lower default rate compared to other commercial property types. Looking ahead, the sector is expected to grow by $4.5 billion through 2024, further solidifying its position as a resilient asset class.
These regional shifts provide valuable context for understanding the behavioral and seasonal factors influencing storage demand.
Behavioral Patterns and Seasonal Demand
Storage demand often stems from major life events like housing changes, job relocations, and family transitions such as divorce or a child leaving for college. These events, combined with regional migration trends, create predictable seasonal patterns.
For example, snowbird communities in Florida, Arizona, and coastal South Carolina experience occupancy peaks in the fall as retirees settle in for the winter, followed by declines in late spring. Similarly, tourist-heavy areas near lakes and coastal regions see seasonal spikes in RV and boat storage demand, aligning with camping and boating seasons. As a result, lenders are now accounting for longer lease-up periods and higher initial vacancy rates when underwriting new projects in these markets.
Customer Segments and User Profiles
Different customer groups drive storage demand, each with unique preferences and behaviors. Understanding these profiles is key to identifying market opportunities:
| Customer Segment | Primary Need | Storage Preference | Behavior |
|---|---|---|---|
| Homeowners / Downsizers | Decluttering, heirloom storage | Climate-controlled units | Long-term, stable occupancy |
| Small Businesses | Inventory overflow, expansion | Standard drive-up or larger units | Moderate-term, volume-sensitive |
| RV / Boat / Vehicle Owners | Secure off-site parking | Open lots, canopy, or enclosed bays | Seasonal, tier-based pricing |
Small businesses stand out as a growing segment. Many are opting for self-storage as a cost-effective alternative to traditional commercial leases, using larger units for inventory management. This behavior contributes to revenue stability for storage operators.
In the RV and boat storage sector, demand is becoming more nuanced. Some customers prefer basic gravel lots, while others seek premium options like canopy-covered spaces or fully enclosed warehouses with valet services. These varying preferences create opportunities for operators to cater to specific customer needs and maximize revenue.
Recognizing these customer behaviors and trends is critical for making informed investment decisions in both self-storage and specialized RV/boat storage markets.
Applying Demand Analysis to Site Selection
Turning robust market demand insights into actionable site selection strategies involves a series of critical steps.
Using Demand Data to Inform Investment Decisions
Once you’ve quantified market demand, the next step is converting that data into actionable project strategies. A key tool here is residual demand analysis, which determines the Net Rentable Square Footage (NRSF) a trade area can support. This eliminates uncertainty about the market’s capacity.
The results of this analysis directly influence key decisions, such as unit mix. For example, if the data reveals a higher concentration of homeowners in a submarket, you might prioritize climate-controlled units to align with local needs. In recreational areas near lakes or coastal regions, the demand data may suggest opportunities for open paved lots or canopy-covered spaces for RVs and boats. Revenue projections are then built around facility-level occupancy rates and achieved rents.
Assessing Risks and Building Mitigation Strategies
To ensure project viability, it’s essential to monitor the development pipeline and avoid oversaturation. Stress-testing assumptions – such as occupancy rates, rent growth, and vacancies – helps identify potential risks and refine strategies accordingly.
To further strengthen investment outcomes, Oakside relies on a proven, data-focused approach.
Oakside‘s Data-Driven Approach

Effective demand analysis goes beyond crunching numbers. It requires identifying the metrics that matter most for a specific asset type in a specific market. Oakside Co applies a rigorous, investment-banking-level approach to self-storage and RV/boat projects. By combining verified market data with operational expertise, Oakside creates strategies that hold up under institutional scrutiny.
"Our team blends investment-banking-level analysis with real operator expertise, delivering strategies that are deeply informed, data-driven, and aligned with each client’s unique objectives." – Cameron Vale, President at Oakside
With over 24 years of combined experience and more than 41 completed transactions in the self-storage and RV/boat space, Oakside’s focused expertise provides insights that generalist approaches often miss. This specialization is key to turning demand data into offering materials that inspire confidence in both buyers and lenders.
FAQs
How do I choose the right drive-time trade area?
Selecting the right drive-time trade area requires a careful look at market data and trends. Begin by identifying your target audience, studying demographic details, and estimating the demand for net rentable square footage. Geographic Information System (GIS) tools can help by generating heatmaps to evaluate market potential. It’s also important to consider site-specific details such as visibility and ease of access. As Nolen Masserman, Managing Director at Oakside, puts it, using a well-researched, data-focused approach is key to finding locations with strong potential.
What NRSF per capita is “too much” for a market?
There’s no one-size-fits-all number for net rentable square footage (NRSF) per capita that determines market oversupply. The health of a market hinges on factors like local supply, demand, and growth trends. According to Nolen Masserman, Managing Director at Oakside, the company uses data-driven analysis to assess key elements such as demographics, competitive saturation, and incoming supply. This ensures that their site-specific feasibility studies can pinpoint whether a location is still a promising investment.
How do I factor new projects in the pipeline into demand?
To account for new projects in demand planning, start by analyzing the competitive landscape. This means identifying the pipeline supply by reviewing active permits and upcoming developments in your target market. Understanding how future inventory could impact both existing and proposed facilities is crucial. Including this data in a feasibility study allows for a better evaluation of market saturation and the potential success of a project. As Oakside highlights, using data-driven strategies is essential to ensure projections align with investment objectives.