
Rental rate growth is about more than increasing prices – it’s about improving property value through smarter decisions. Operators who use real-time data outperform those relying on outdated methods. By analyzing market trends, occupancy, and tenant behavior, you can optimize pricing to boost revenue without risking occupancy.
Key takeaways:
- Rental rate growth drives NOI (net operating income), directly impacting property valuation.
- Data-driven pricing strategies, like dynamic pricing and tenant segmentation, help maximize revenue.
- Metrics such as street rates, achieved rates, and occupancy levels reveal pricing opportunities.
- Market trends, like population growth in the Southeast and Southwest U.S., influence demand and rates.
Operators using tools like TractIQ and focusing on localized data can refine their strategies to align with market conditions. This approach not only improves rental rates but also strengthens lender and investor confidence.
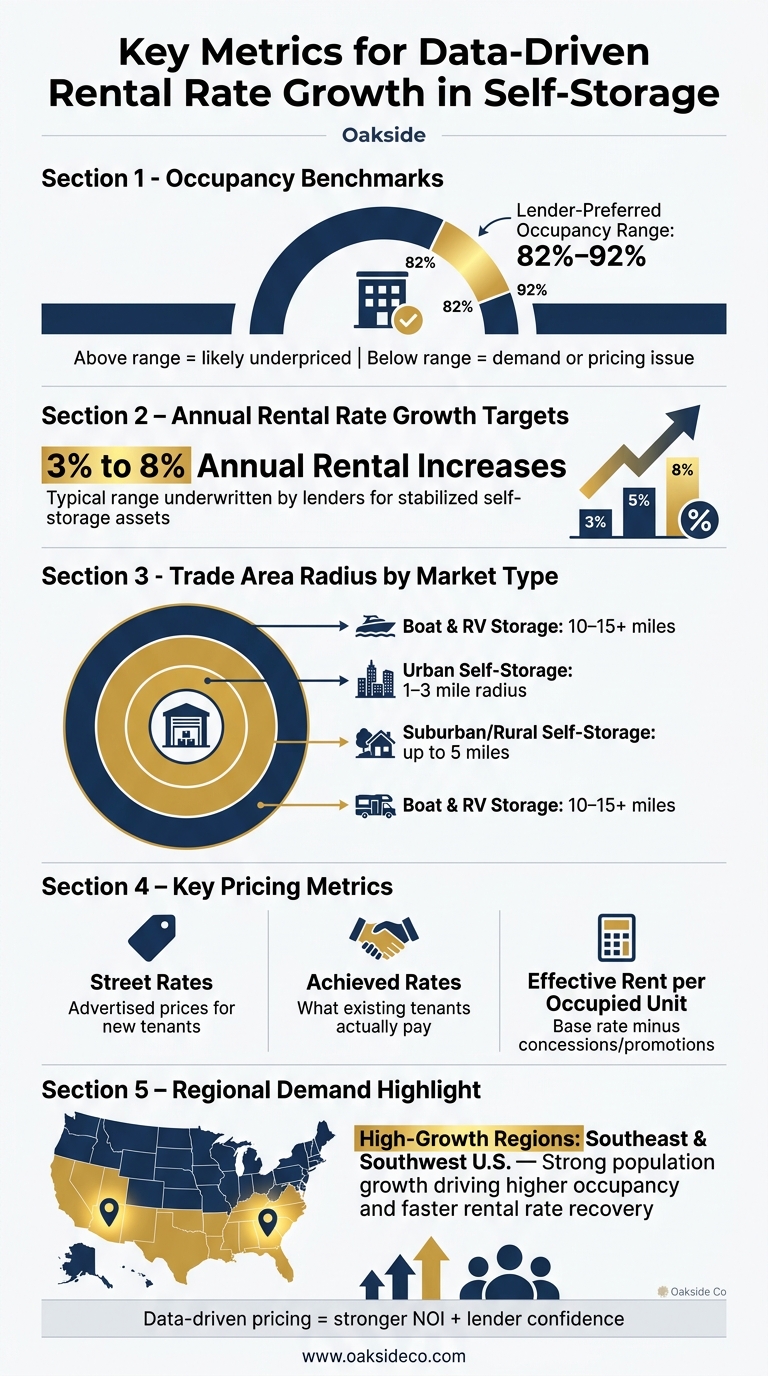
Key Metrics for Data-Driven Rental Rate Growth in Self-Storage
Key Metrics That Affect Rental Rate Growth
Building on the importance of data in price optimization, this section explores the key metrics that drive rental rate growth and how they connect to broader operational and market trends.
Defining Rental Rate Metrics
Rental rate metrics provide a window into different aspects of a facility’s performance. For example, street rates represent the advertised prices for new tenants, while achieved rates reflect what existing tenants actually pay. Comparing these two can reveal how effectively pricing strategies are being implemented and where there might be room for growth.
Another critical metric is effective rent per occupied unit, which goes beyond base rates by including concessions and promotions. This gives a clearer picture of the true revenue generated per unit. Together, these metrics help assess how factors like occupancy and tenant retention impact a facility’s net operating income (NOI).
Occupancy, Churn, and NOI Indicators
Occupancy rates, when analyzed alongside tenant churn and average stay length, provide a more comprehensive view of a facility’s overall health. Lenders typically look for stabilized occupancy levels between 82% and 92%, with annual rental increases projected in the 3% to 8% range. Facilities operating above these thresholds might be underpriced, while those below could be struggling with demand or pricing issues.
Tenant churn, or the rate at which renters leave, has a direct impact on NOI. High churn leads to increased marketing and leasing costs, cutting into profitability. On the other hand, longer tenant stays often indicate satisfaction, creating opportunities to gradually raise rates without risking significant move-outs. Keeping churn low and occupancy stable is essential for maintaining strong NOI margins, which is critical for gaining the confidence of lenders and investors.
How Demand and Market Trends Shape Rates
Local demand metrics, such as web inquiries, reservations, and call volume, provide valuable insights into the market’s capacity to absorb higher rates. For instance, an increase in both inquiries and move-ins suggests a prime opportunity to test higher street rates. These real-time indicators often offer a more immediate understanding of market dynamics than historical data.
Larger market trends also play a crucial role. In regions like the Southeast and Southwest U.S., steady population growth has fueled demand for self-storage, pushing rental rates upward. By early 2026, many of these markets are stabilizing and recovering due to reduced new construction and sustained demand. For specialized storage sectors, such as boat and RV storage, growing institutional interest highlights the importance of detailed market-level rate analysis. These demand trends are central to crafting a successful, data-driven pricing strategy.
sbb-itb-09b4138
Building a Data-Backed Pricing Strategy
Use data to make precise pricing decisions that drive revenue growth.
Setting Street Rates Based on Market Data
Start by examining local competitors’ pricing based on unit type, size, and amenities. Break this information down and adjust rates seasonally. This is especially important in sectors like boat and RV storage, where demand surges in spring and early summer. These periods are ideal for testing higher street rates without risking occupancy. Keep an eye on inquiry volumes and conversion rates to assess whether the market can handle these adjustments. Tools like TractIQ provide verified facility-level data on occupancy and financial performance, helping you base pricing decisions on actual market trends rather than guesswork.
This market-driven approach lays the groundwork for ongoing adjustments using dynamic pricing strategies.
Dynamic Pricing and Revenue Management
Dynamic pricing means adjusting rates in real-time based on current market conditions instead of relying on past data. For example, high occupancy levels might indicate it’s time to raise street rates, while low occupancy could signal the need for rate reductions to attract new tenants. By aligning pricing with occupancy trends, you can optimize revenue as conditions change.
When making these adjustments, consider the long-term value of tenants. A tenant with a strong payment history over time often contributes more to your bottom line than a new customer brought in through heavy discounts.
These real-time adjustments prepare you to implement targeted rate increases for your most valuable tenants.
Raising Rates for Existing Tenants
Segmenting tenants is key to increasing revenue effectively. Not all tenants should experience rate hikes simultaneously. Factors like payment history, length of stay, and tenant type play a crucial role in determining who should see an increase.
Long-term tenants with a history of timely payments are generally more open to moderate rate increases, especially if those adjustments are tied to market conditions rather than arbitrary changes. A typical annual increase of 3% to 8% aligns with what lenders often underwrite for stabilized self-storage assets. This range serves as a reasonable and market-supported benchmark for many tenants. Month-to-month tenants in high-occupancy facilities, who usually have less bargaining power, can be a logical starting point for rolling out rate increases.
Timing is everything. Align rate adjustments with peak demand periods identified through market data to maintain occupancy while maximizing net operating income (NOI). Data on tenant churn and average stay durations can help you determine the best time to implement these changes.
Using Analytics to Inform Asset Strategy
Analytics play a crucial role in shaping not only current pricing strategies but also the long-term positioning of assets across market cycles.
Trade Area and Competitive Set Analysis
Self-storage facilities typically attract customers within a 1- to 3-mile radius in urban areas, while suburban and rural markets may extend that range to 5 miles. For boat and RV storage, customers often travel farther – sometimes 10 to 15 miles or more. Once you’ve defined your trade area, the next step is to build a competitive set of similar facilities. This involves benchmarking metrics like unit mix, amenities, street rates, and occupancy to determine your facility’s standing in the market. This broader perspective helps lay the groundwork for diving into specific analytics that influence market strategy.
Platforms like TractIQ can provide detailed, verified data on occupancy and financial performance at the facility level. Lenders today are placing greater emphasis on granular trade area data rather than relying on generalized market assumptions.
Demand Drivers for Self-Storage and Boat/RV Storage
The factors driving demand vary significantly between self-storage and boat/RV storage, and these differences should shape your pricing approach.
- Self-Storage: Key drivers include population density, household formation, and in-migration. The Southeast and Southwest U.S., with their strong population growth, have consistently supported higher occupancy rates and faster rental rate recoveries.
- Boat and RV Storage: Demand here is influenced by trends in RV ownership, proximity to recreational areas, and local zoning regulations. Seasonal fluctuations are more pronounced in this sector, requiring pricing to adjust accordingly. The rise of institutional capital in this space has also heightened competition, making it critical for operators to understand their local demand drivers.
By analyzing these demand drivers, operators can refine their pricing strategies to align with local market conditions, complementing earlier insights on dynamic pricing.
Pricing Through Market Cycles
Rental rate growth is closely tied to market conditions. During periods of economic growth, rising occupancy allows for more aggressive street rate increases. Conversely, during slower periods, the focus shifts to maintaining occupancy and protecting net operating income (NOI) through targeted tenant segmentation rather than across-the-board rate reductions.
As of early 2026, many self-storage markets are transitioning from a phase of stagnant or declining rates to stabilization. Lenders are now underwriting rental increases in the 3% to 8% range for assets in strong markets, reflecting growing confidence in the sector’s fundamentals. This range is based on what the market has historically been able to absorb without significantly impacting occupancy.
The key is to stay aligned with your specific market’s cycle instead of relying on national trends. For example, a facility in a high-growth Sun Belt suburb operates under very different dynamics than one in a stagnant Midwest market. Regular feasibility studies and supply-demand analyses tailored to your trade area are essential for keeping pricing strategies grounded in actual market conditions.
Oakside incorporates these analytics into its overall asset strategy to maximize rental rate performance.
Conclusion: Using Data to Grow Rental Rates
Every decision rooted in data lays the groundwork for better asset performance. Consistent rental rate growth doesn’t happen by chance – it’s the result of careful, informed choices made throughout the investment process. From analyzing occupancy trends and churn rates to applying dynamic pricing strategies and tenant segmentation, each step builds toward improving both NOI and asset value.
When revenue management is driven by data, the results speak for themselves. Strategic rate adjustments based on real market trends – not assumptions – have led to noticeable revenue growth.
For lenders, granular trade-area data is essential. They need to see clear evidence of rental increases and stabilized occupancy before offering favorable terms. Facilities that present strong, defensible data at the facility level experience smoother progress through the capital stack. These insights not only optimize rental rates but also boost credibility with investors.
For owners of self-storage or boat/RV storage facilities, working with Oakside Co can be a game-changer. Whether it’s refining pricing strategies or preparing for a sale, their expertise helps maximize value and simplify transactions.
Data is the backbone of smart asset management decisions.
FAQs
Which data should I use to set my street rates?
To establish effective street rates, it’s essential to look beyond simple rent comparisons. Instead, combine verified facility-level performance data with broader market insights for a more comprehensive approach. Nolen Masserman, Managing Director at Oakside, emphasizes the importance of considering factors like occupancy trends, historical rent data, and hyper-local trade area analysis.
By diving deeper, you can also account for elements such as demographic changes, supply-demand imbalances, and the performance of specific unit types (like climate-controlled versus non-climate-controlled units). This method helps uncover revenue opportunities, ensures optimal occupancy levels, and positions your rates strategically within the market.
How do I raise tenant rates without increasing churn?
To boost tenant rates without driving tenants away, focus on detailed, trade-area-specific data rather than applying broad rate increases. Using advanced revenue management techniques and thorough market analysis can help strike the right balance between rental rates and occupancy levels. Nolen Masserman, Managing Director at Oakside, emphasizes the need for a disciplined, data-driven strategy, especially as markets now require pricing backed by solid verification. Oakside offers tools and strategies designed to increase asset value while keeping occupancy rates strong.
What trade area should I benchmark for my facility?
To assess your facility’s trade area effectively, dive into a thorough examination of the nearby environment. Today’s investment strategies emphasize local market conditions, like rental prices and the level of competition in the immediate area. Broad regional statistics won’t cut it. As Nolen Masserman, Managing Director at Oakside, points out, using accurate, data-driven insights is essential for spotting growth potential and optimizing the value of your property.