Your sale price can move by more than $1 million just from a small cap rate shift. At $500,000 NOI, a 6.0% cap rate points to about $8.3 million, while a 7.5% cap rate points to about $6.7 million.
If I boil this guide down, the message is simple: buyers in 2026 pay for proven income, tight expense control, and clean records. They are leaning on trailing 12-month NOI, checking collections, watching expense creep, and cutting value when data is messy or income looks shaky.
Here’s the full picture in plain English:
- Income quality comes first. Buyers look at physical occupancy, economic occupancy, rent growth, collections, and fee income.
- Expenses matter more than many owners expect. Taxes, insurance, payroll, utilities, and repair trends can cut NOI fast.
- Market conditions shape pricing. In 2026, advertised storage rates were down 2.0% year over year in March, after 1.2% in February and 0.4% in January.
- Underwriting is strict. Buyers test the T-12, rent roll, occupancy history, expense levels, and near-term capex.
- Prep affects offers. Missing reports, weak collections, and unsupported add-backs can push pricing down.
A few numbers stand out:
- Economic occupancy can run 8 to 14 points below physical occupancy when collections are weak.
- Ancillary income like insurance and fees can add 8% to 15% of total revenue when it shows up month after month.
- Buyers often want 6 to 24 months of occupancy history and 12 to 24 months of income support by source.
- Before going to market, sellers should have 3 to 5 years of financials and 24 to 36 months of occupancy reports ready.
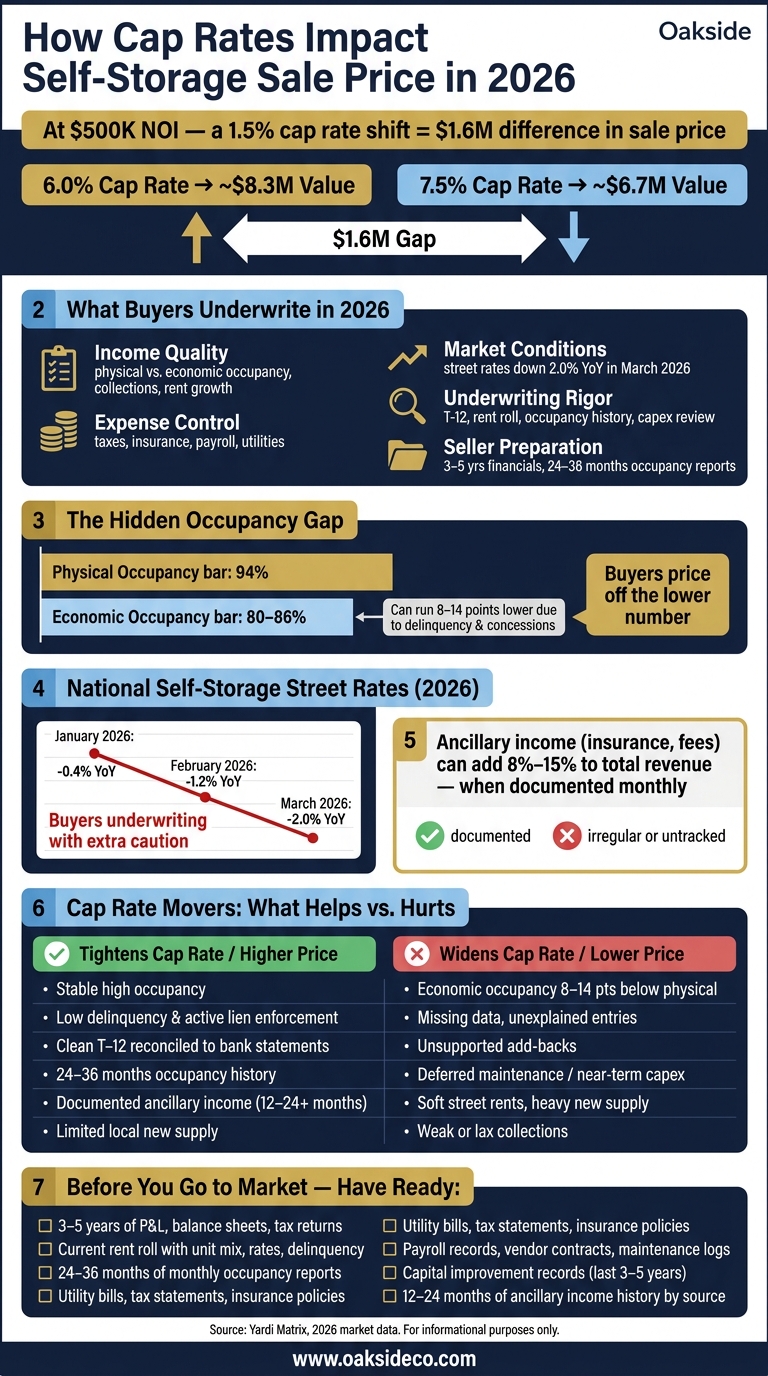
How Cap Rates Impact Self-Storage Sale Price in 2026
Quick comparison
| Area | What helps pricing | What hurts pricing |
|---|---|---|
| Income | Stable occupancy, clean collections, steady rent growth | Delinquency, concessions, uneven revenue |
| Expenses | Taxes, insurance, payroll, and utilities that look steady | Cost spikes, resets after sale, heavy staffing |
| Market | Limited new supply and better rent support | Soft rates and weak absorption |
| Underwriting | Clean T-12, matched records, low capex needs | Missing data, add-backs, deferred maintenance |
| Seller prep | Data room with full backup | Gaps, guesswork, poor support |
Bottom line: if I want a better sale outcome in 2026, I need to make my NOI easy to trust. (You can estimate your property value based on current income and expenses.) That means clean records, steady collections, normal expense history, and a clear story backed by data.
sbb-itb-09b4138
Income quality: the first driver of cap rate
Income quality is where cap rates usually start. Buyers are pricing the cash flow they believe will still be there after closing. If the income looks solid and well documented, they tend to accept a tighter cap rate. If it looks shaky or hard to back up, they push the cap rate out to cover more risk.
Occupancy, rent growth, and collection quality
Physical occupancy and economic occupancy are not the same thing, and buyers pay close attention to that gap. Physical occupancy is the share of units that are rented. Economic occupancy is the share of expected revenue that actually gets collected after concessions, delinquency, and unpaid balances. At facilities with poor collection habits, economic occupancy often runs 8–14 percentage points below physical occupancy. So a property that shows 94% physical occupancy but only 88% economic occupancy – due to move-in specials, old receivables, or tenants behind on payments – will usually be priced off the lower figure.
Rent growth gets the same close look. Buyers compare street rates, in-place rates, and the rent trend over the trailing 12–24 months. Growth driven by broad rate increases and solid retention suggests real pricing power. Growth driven by short-term promotions or one-off jumps tends to look temporary, so buyers are less likely to give it full credit. And with street rents down more than 10% for two straight years in 2023 and 2024, buyers in 2026 are far more careful about assuming last year’s gains will stick.
Ancillary income that supports stronger NOI
Tenant insurance, late fees, admin fees, and similar recurring charges can add 8–15% to total revenue at well-run facilities. Buyers will count that income when it shows up month after month and the records support it. If ancillary revenue looks uneven, recently padded, or tied more to a manager’s habits than to the property itself, buyers often trim it back or exclude part of it from NOI.
The difference here is pretty simple. A clean record of tenant insurance participation, fee income by month, and year-over-year trends gives buyers comfort. A single "other income" line with no detail tends to do the opposite.
Strong vs. weak income profile: a side-by-side comparison
Here is how buyers read strong versus weak income in practice.
| Income Factor | Strong Profile | Weak Profile |
|---|---|---|
| Physical occupancy | High and stable | Volatile or trending down |
| Economic occupancy | Close to physical occupancy; low delinquency | 8–14 points below physical; high delinquency |
| Rent growth | Broad-based rate increases; supported by market | Driven by short-term promotions or one-time spikes |
| Collection quality | Consistent monthly collections; consistent lien enforcement | Aged receivables; occupied units that are not paying |
| Ancillary income | Documented, recurring, consistent year-over-year | Irregular, recently added, or poorly tracked |
| Pricing impact | Tighter cap rate; stronger pricing | Wider cap rate; lower offer price |
Strong income supports pricing. Expenses decide how much NOI makes it through underwriting.
Expense trends and market tone: what widens or tightens cap rates
Strong income doesn’t go as far when expenses chip away at NOI.
Expense line items buyers watch most closely
After income, expenses are usually the next place buyers trim value.
Property taxes and insurance sit at the top of the list because owners can’t do much to control them. If taxes are likely to reset higher after a sale, buyers will underwrite a lower year-one NOI. Insurance is also still expensive in many areas due to weather risk and higher replacement costs.
Payroll and management fees come next. Facilities with automation or lean staffing can show a lower labor load, which helps margins if occupancy and collections stay solid. On the flip side, properties with heavy on-site staffing and no clear operating upside tend to get a more cautious look. Utilities are a big issue for climate-controlled sites, where heating, cooling, and humidity control can make monthly costs swing more than buyers like. If the property doesn’t have energy controls or tenant bill-backs, underwriting usually gets tighter.
Marketing, repairs, and maintenance also get close attention. A jump in either one can signal a one-time issue, or it can hint at a pattern. Buyers want proof that these costs are steady and make sense for the asset’s size and age.
Local supply, demand, and market tone in 2026
Even tight cost control can’t make up for a weak rent market.
In 2026, softer rent growth and slower absorption are pushing buyers to underwrite with more caution. Yardi Matrix reported that national advertised self-storage rates fell 2.0% year over year in March 2026, after drops of 1.2% in February and 0.4% in January. Revenue growth is expected to be flat to slightly negative in many markets this year.
Supply growth is slowing, and that should help rents find a floor over time. But absorption is still uneven. Markets with heavier new supply usually trade at wider cap rates than markets with tighter supply. Buyers are watching one thing in particular: whether new space is hitting the trade area faster than demand can soak it up.
That changes pricing. The same asset can look steady in one market and pressured in another.
Stable vs. pressured operating environment: a side-by-side comparison
| Factor | Stable Environment | Pressured Environment |
|---|---|---|
| Property taxes | Predictable; low reassessment risk | Likely to reset upward after sale |
| Insurance | Stable premiums; no unusual exposure | Rising premiums; higher weather risk |
| Payroll / management | Lean and consistent; automation in place | Heavy staffing costs without clear benefit |
| Utilities | Controlled; modest year-over-year growth | Volatile; climate-controlled exposure without tenant bill-backs |
| Repairs and maintenance | Steady; proportionate to asset age | Irregular spikes; unusual volatility |
| Local supply | Limited new construction; healthy absorption | New supply entering trade area; slow absorption |
| Rent direction | Flat to modest growth; rents keeping pace with costs | Declining street rates; soft or negative revenue growth |
| Cap rate impact | Tighter cap rate; stronger buyer confidence | Wider cap rate; more conservative pricing |
That’s why the same property can trade at different cap rates under different market conditions. Even a clean operator can price wider in a supply-heavy market.
How buyers underwrite storage deals in 2026
Those performance signals don’t just sit on a page. Buyers turn them into underwriting, and underwriting is what turns property performance into cap rate.
The main underwriting checks behind buyer pricing
Buyers price storage deals based on documented cash flow, not seller projections. It starts with the T-12. From there, buyers test occupancy, rent history, normalized expenses, and near-term capital needs.
They usually review 6 to 24 months of occupancy trends to see whether the property is steady or all over the place. Stable occupancy helps support value. Big swings do the opposite.
Rent history tells another part of the story. Buyers want to see whether revenue growth came from steady rate management or from short-term moves that may not stick. Expenses get adjusted to market levels. If the property is self-managed, buyers often add a market-rate management fee into the numbers.
Near-term capex can also hit pricing fast. If a property needs work soon, buyers will often cut price or use a wider cap rate. And if the deal is still in lease-up, they won’t just accept a seller’s stabilized forecast at face value. They usually underwrite with conservative absorption assumptions instead.
Each one of these checks does one of two things: it either supports NOI or pushes buyers to discount it.
Red flags that push cap rates higher
When the numbers don’t hold up, buyers widen cap rates to cover risk. The most common issues are pretty straightforward:
- Deferred maintenance points to near-term capex and weaker operations, so buyers widen the cap rate.
- Missing months, mismatched figures, or unexplained entries hurt confidence, so buyers widen the cap rate.
- Weak collections lead buyers to underwrite lower economic occupancy and higher bad debt, so buyers widen the cap rate.
- Unsupported add-backs get reversed fast, which lowers underwritten NOI and widens the cap rate.
- Ancillary income without 12 to 24 months of history is often discounted or ignored, so buyers widen the cap rate.
Fixing these problems before launch can help pricing. Clean data and lower risk usually lead to a tighter cap rate.
Buyer-friendly signals vs. underwriting red flags: a side-by-side comparison
| Underwriting Factor | Buyer-Friendly Signal | Underwriting Red Flag |
|---|---|---|
| Reporting | Clean T‑12 reconciled to bank statements and rent roll | Missing months, unexplained entries, or mismatched figures |
| Occupancy | Stable high occupancy over multiple seasons | Volatile swings or recent decline |
| Rent trend | Consistent rate increases backed by market data | Aggressive spikes or heavy concession use |
| Expenses | Normalized; reflects market-rate management costs | Self-managed with no fee; underreported payroll or maintenance |
| Collections | Low delinquency; active lien process; minimal write-offs | High delinquency; lax collections; frequent bad debt |
| Ancillary income | 12 to 24+ months of documented, consistent performance | New or inconsistent revenue with no track record |
| Capex | Well-maintained; no major near-term projects | Deferred maintenance; major capex on the horizon |
| Cap rate impact | Supports tighter cap rate; stronger buyer confidence | Pushes cap rate higher; more conservative pricing |
Each red flag lowers NOI and widens the cap rate. Clean reporting, steady income, and modest capex tend to support tighter pricing. That’s why prep work before a market launch matters more than last-minute pricing arguments.
Seller preparation steps to support a stronger sale outcome
What owners should organize before going to market
Once buyers move from pricing into diligence, the seller’s job gets pretty simple: remove friction.
The biggest thing you can do before a sale is make underwriting easy. Put together one digital data room that lets buyers review the deal fast and with as little guesswork as possible.
That room should include:
- 3 to 5 years of financials: P&L statements, balance sheets, and business tax returns, reconciled to bank statements
- Current rent roll: unit mix, sizes, rates, move-in dates, concessions, and delinquency status
- 24 to 36 months of monthly occupancy reports
- Utility bills, property tax statements, and insurance policies
- Payroll records, vendor contracts, and maintenance logs or work orders
- Capital improvement records: gate and camera upgrades, roof replacements, paving, or unit door replacements from the last 3 to 5 years – label each project by date, cost, and scope so buyers can separate repairs from capital upgrades
For ancillary income, share at least the trailing 12 months of monthly history by source. If you have 24 to 36 months, even better. Include any program agreements or revenue-share contracts too. That gives buyers a clean way to underwrite that income at full value instead of treating it like a maybe.
How to show upside without weakening credibility
Once the base numbers are clean, show upside only when the current data backs it up.
That part matters. Buyers will look at upside, but they don’t want a story held together with hope. Keep in-place NOI and pro forma NOI clearly separated in your materials, then let buyers judge each one on its own.
Three proof points tend to matter most:
- Rent gap: If rents sit below market, show a simple table that compares in-place rates with current market averages by unit type, backed by market data.
- Operational change: If you recently added revenue management software, a call center, or a digital marketing push, connect those moves to measurable results, like occupancy momentum or lead conversion over the past six to 12 months.
- Lease-up pace: If lease-up is part of the pitch, support it with local demand indicators and your own leasing velocity over that same period.
Use projections that are clearly labeled and conservative, with demand indicators to support them. Push the upside too hard, and buyers can lose confidence fast. When that happens, cap rates often move higher.
Oakside Co structures sale materials to present current performance and upside in a format buyers can underwrite quickly.
Conclusion: the clearest ways to influence cap rate in 2026
Clean income, controlled expenses, and complete records are what help buyers justify a tighter cap rate. Performance drives cap rate, and preparation helps buyers trust that performance.
FAQs
What is a good cap rate in 2026?
A “good” cap rate in 2026 usually sits near the low end of the market range for your asset type and risk level.
For stabilized U.S. self-storage deals in August 2026, most properties trade at about 5.0% to 7.5%+.
Here’s how that usually breaks down:
- Class A in primary markets: about 5.0%–5.75%
- Class C in tertiary markets: about 7.25%–7.5%+
If a deal comes in below that range, the pricing may be too aggressive. If it lands above that range, it often points to higher risk, softer performance, or both.
Why does economic occupancy matter more than physical occupancy?
Economic occupancy is a better way to judge performance because it shows actual cash collected, not just how many units are leased.
Physical occupancy tells you the share of units that are occupied. Economic occupancy goes a step further. It reflects things like concessions, bad debt, free rent, and delinquency.
That difference matters more than it may seem at first glance. A property can look 95% full on paper and still bring in weak revenue. And when revenue slips, net operating income drops too. Once NOI falls, property value usually follows.
That’s why buyers pay close attention to the gap between physical and economic occupancy. It gives them a clearer read on revenue quality, not just unit count.
How can I improve my cap rate before selling?
Increase NOI and show a steady, professional operation. Because value comes down to NOI and cap rate, even small gains can improve sale proceeds.
- Increase revenue by putting ECRIs in place 6 to 12 months before listing, tightening pricing, and cutting concessions
- Normalize expenses, including a 6% to 8% management fee, and strip out one-time or personal costs
- Present 12 months of clean records and take care of deferred maintenance before going to market