If rent growth stays below inflation, storage values stay under pressure. I see that as the main takeaway from this study: in 2026, self-storage is still dealing with soft rent growth and cost pressure, while self-storage vs boat and RV storage performance shows boat and RV storage is holding up better on pricing.
Here’s the short version:
- Inflation is still near 3.4% to 3.5%, which keeps pressure on payroll, insurance, utilities, and property taxes.
- Self-storage rents are not keeping up. Street rents are flat to down, and achieved rents at about +1.6% year over year still trail inflation.
- Boat and RV storage is in better shape on rates. Advertised parking rates were up 4.4% year over year to $6.38 per square foot.
- Occupancy is stable but below past highs. Self-storage physical occupancy was 84.4% in Q4 2025, far below the 93.9% peak in 2021.
- Expenses are still climbing. Insurance jumped 15% to 20% in some high-risk states, and property tax increases of 4% to 18% have hit some portfolios.
- Values have reset. Strong self-storage assets are trading around 5.0% to 5.5% cap rates, while boat/RV storage is around 7.5% to 8.5%+.
- Deal volume is lower. H1 2026 self-storage sales totaled $2.8 billion, down from $3.8 billion in H1 2025.
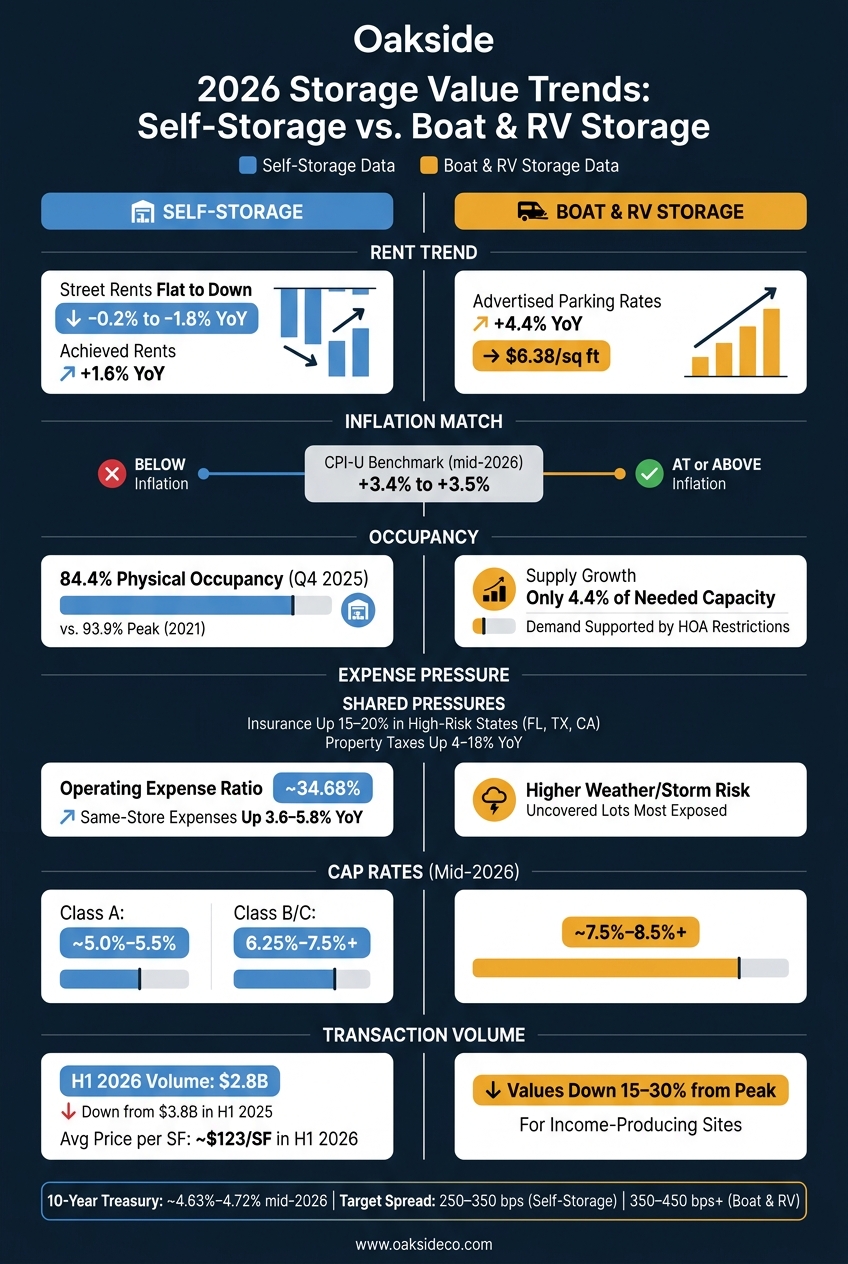
Self-Storage vs. Boat & RV Storage: 2026 Value & Performance Snapshot
Quick Comparison
| Segment | Rent trend | Inflation match | Cost pressure | Value trend |
|---|---|---|---|---|
| Self-storage | Flat to down street rents; achieved rents about +1.6% | Below inflation | Taxes, insurance, payroll, utilities | More stable, but below peak pricing |
| Boat & RV storage | Rates up 4.4% YoY | At or above inflation | Insurance and weather risk vary by format | Sharper value reset, then more steady pricing |
My read: owners and buyers should focus on NOI, expense control, cap rates, and financing spreads, not old peak-cycle pricing. In this market, pricing power matters more than headline inflation alone.
That sets up the rest of the article: where rents are holding, where margins are getting squeezed, and how buyers are pricing storage deals in 2026.
sbb-itb-09b4138
Revenue trends: rents, occupancy, and pricing power
Self-storage rent and occupancy patterns from 2024 to 2026
U.S. self-storage occupancy has leveled off, but it’s still well below the pandemic peak. Physical occupancy came in at 84.4% in Q4 2025, which is 9.5 points lower than the 93.9% high reached in 2021. That said, some stabilized portfolios are still beating the market, with occupancy above 94%.
Street rates are still under pressure. TractIQ’s 10×10 benchmark was about $1.29 per square foot in 2026, down about 39% from the 2021 peak of roughly $2.12. One small bright spot: the gap between asking rents and achieved rents narrowed from 20.2% to 18.1%. That points to a market that may be settling down, even if pricing is still soft.
To keep revenue moving, operators are leaning more on current tenants. That includes pricing strategies like scheduled rent bumps, post-promo step-ups, and tiered unit pricing. Achieved rents were running at about +1.6% year over year, but that still trails CPI. In plain terms, rents may be up on paper, yet they’re not outpacing inflation. That same pricing spread is now feeding straight into buyer underwriting and return targets. This shift makes sensitivity testing critical for protecting equity against shifting cap rates.
Boat and RV storage demand and rate movement
Boat and RV storage has held up better on pricing. Advertised parking rates moved from $5.99 per square foot in March 2025 to $6.38 in September 2025, a 4.4% year-over-year increase. That puts the segment roughly in line with, or a bit ahead of, mid-2026 CPI.
Tight supply is a big reason. Only 4.4% of needed boat and RV storage space was added over the past year, while HOA rules and a large installed base keep demand in place. Those firmer rates matter. They give owners a bit more room to deal with the same cost pressure hitting the rest of the storage world.
Nominal rent growth versus inflation: a direct comparison
With CPI-U at 3.4% to 3.5% in mid-2026, operators need rent growth above that level just to stay ahead in real terms. Self-storage street rents are still losing ground after inflation. Achieved rents are positive, but not by enough. Boat and RV rates stand out as the clearest winner here.
| Metric | 2025–2026 Reading | Inflation-Adjusted Result |
|---|---|---|
| U.S. CPI-U (mid-2026) | +3.4% to +3.5% YoY | Costs rising at that pace |
| Self-storage street rent | ~−0.2% to −1.8% YoY | Negative in real terms |
| Self-storage achieved rents | ~+1.6% YoY | Still below inflation |
| Boat and RV advertised parking rates | +4.4% YoY; $6.38/sf | Roughly at or above inflation |
Boat and RV assets show the strongest pricing hold. Self-storage, by contrast, is still leaning more on rate tactics than on broad market rent growth.
Expense pressure: how inflation is still compressing margins
Operating cost inflation for self-storage assets
Rent growth may be settling down, but NOI still comes down to one simple thing: can revenue grow faster than expenses?
That’s where the squeeze shows up.
The toughest cost lines to control are usually property taxes, insurance, and payroll. Repairs and maintenance, utilities, and site-level upkeep add pressure too. And these costs don’t move in sync with rent. They reset on their own timelines, often tied to wage increases, insurance renewals, and tax reassessments.
Property taxes alone can account for about 30% of total operating expenses. That’s a big chunk. In some portfolios, reassessment-driven tax increases of 4% to 18% year over year have hit hard. Insurance has been another stubborn problem. Several large operators saw premiums climb 15% to 20%, with much of that pressure concentrated in Florida, Texas, and California, where climate-risk repricing pushed costs much higher.
The national average operating expense ratio is 34.68%. Put differently, about one-third of rental income gets eaten up by operating costs before debt service or capital expenditures. Public Storage reported same-store expense growth of 3.6% year over year in Q4 2025, while CubeSmart’s Q1 2026 same-store expenses rose 5.8%, with snow removal alone adding 120 basis points to that figure.
Slower inflation doesn’t erase what already happened. If a facility went through three years of compounding cost increases, the damage doesn’t disappear just because the pace cools. The cost base is still higher. So margin recovery only happens if expense growth slows enough for revenue to catch up. If revenue growth trails cost inflation, the first place the pain usually shows up is NOI.
Expense risks for boat and RV storage by asset type
Boat and RV storage deals with the same inflation issue, but the expense mix shifts based on the format. That matters more than it may seem at first glance.
Boat and RV storage does not carry the same cost profile as standard self-storage. And the risk can change a lot depending on whether the facility is uncovered, covered, or enclosed.
Uncovered lots usually cost less to build, but they’re also the most exposed to weather. That leaves owners open to uneven repair bills from storm damage and surface wear. Hurricane Milton reportedly cost Extra Space Storage over $10 million in storm-related expenses, a sharp example of how fast weather events can hit repairs, maintenance, and insurance deductibles at large exterior sites.
Covered facilities bring a different kind of burden. Owners have to stay on top of canopy structures and lighting systems, which creates a steady upkeep bill. Enclosed boat/RV storage can come with higher fire suppression costs and more building maintenance. The tradeoff is that enclosed formats often support stronger rents, which can help absorb some of those costs.
That format gap matters for valuation, not just day-to-day operations.
Insurance stays a pressure point across all three formats, especially in hurricane, hail, flood, or wildfire corridors.
Margin pressure by storage format: a side-by-side comparison
| Expense Category | Traditional Self-Storage | Boat & RV Storage |
|---|---|---|
| Labor / payroll | Moderate; on-site management and staffing | Variable; depends on format and security requirements |
| Insurance | Elevated; 15–20% increases in high-risk states | Higher volatility; storm and liability exposure by format |
| Property taxes | Sticky; reassessment risk post-sale | Similar risk; assessments can reset upward after transaction values cool |
| Utilities | Moderate; climate control adds cost for some units | Higher for enclosed formats (lighting) |
| Site maintenance | Relatively stable; roofs, gates, asphalt | Greater exposure; paving, canopy upkeep |
| Storm / weather risk | Lower for interior units | High for uncovered and covered formats |
| Margin pressure | Moderate; revenue softness and expense growth are the main risks | Variable; depends heavily on format and location |
These cost differences flow straight into underwriting and valuation. Buyers are paying close attention to insurance, payroll, and taxes, and 2026 deal assumptions need to reflect that. On the ownership side, renewals, tax appeals, maintenance planning, and capital timing all need a tight grip. These operational improvements are critical components of self-storage exit planning to ensure maximum value at sale. That pressure is already showing up in buyer pricing and cap-rate assumptions, which often diverge from seller expectations.
Capital markets and valuation changes in 2026
Inflation has cooled, but owners and buyers are still dealing with higher operating costs and slower rent growth. That pressure is squeezing margins, so buyers are underwriting with more caution. You can see it in both deal volume and pricing.
Buyer behavior and transaction volume
Since 2022, the buyer pool has gotten smaller, and buyers have become far more selective. Institutional buyers – REITs, private equity platforms, and large operators – are still in the market, but they’re leaning toward core and core-plus assets in strong metros with steady NOI histories. High-leverage deals simply don’t pencil the way they used to, especially with permanent financing running 6%–7%+ for many non-core assets.
That has opened the door for cash-heavy and low-leverage buyers. In boat and RV storage, in particular, family offices and regional sponsors now show up more often in the buyer mix. The appeal is pretty simple: steadier income and less reliance on lender terms. As a result, offers are less tied to financing, due diligence timelines have tightened, and pricing is leaning more on cash yield targets. For owners, that means underwriting now puts more weight on rent steps, fee income, and expense control than on nominal growth.
Transaction volume shows the same pattern. H1 2026 self-storage volume totaled $2.8 billion, down from $3.8 billion in H1 2025. There are fewer closings, but the deals that do trade are cleaner and more selective than they were in 2022. That shift is now showing up in cap rates and price metrics.
Cap rates, price per square foot, and price per acre
By mid-2026, stabilized institutional-quality self-storage in major metros is trading around 5.0%–5.5%, while weaker assets need much higher yields to move. Class C and tertiary product often lands in the 7.0%–8.0% or higher range.
H1 2026 averaged about $123/SF, up about 26% year over year, largely because more of the trades getting done involve higher-quality assets.
Boat and RV storage has seen a sharper reset. Stronger facilities moved from the low-6% to mid-7% range in 2022 to about 7.5%–8.5%+ by mid-2026. Per-acre pricing has also swung more. In many markets, values are down 15%–30% from peak levels for income-producing sites, with even steeper drops for minimally improved or speculative land.
The table below shows what that reset looks like across self-storage and boat/RV assets.
Valuation markers: 2022 peak, reset, and stabilization compared
The 10-year Treasury has stayed a headwind. At about 4.63%–4.72% in mid-2026, it has limited cap-rate compression and pushed buyers to target spreads of 250–350 basis points over Treasuries for stabilized self-storage and 350–450 basis points or more for boat and RV assets. At this point, that spread is basically the starting line for underwriting.
| Metric | 2022 Peak | 2024–2025 Reset | Mid-2026 |
|---|---|---|---|
| Self-storage cap rates (Class A, primary) | ~4.0%–4.75% | ~5.25%–6.25% | Stabilizing around ~5.0%–5.5% for strong assets |
| Self-storage cap rates (B/C / secondary) | ~5.0%–6.0% | ~5.75%–6.5%+ | ~6.25%–7.5%+ for weaker product |
| Self-storage price per SF | Above current reset levels | Lower as financing costs rose | About $123/SF in H1 2026 |
| Boat/RV storage cap rates | Low-6% to mid-7% range | Widened materially | ~7.5%–8.5%+ by mid-2026 |
| Transaction volume (H1) | Elevated, peak-cycle activity | Slower and more selective | $2.8B in H1 2026 |
| 10-year Treasury | ~1.5%–2.0% pre-2022 | Rising through 2023–2025 | ~4.63%–4.72% mid-2026 |
The clearest takeaway is that the market has moved beyond the sharpest part of repricing. Bid-ask spreads have narrowed for well-positioned assets, and cap-rate guidance is starting to look more consistent. This is what stabilization looks like: not a snap back to 2022, but a market that feels more predictable for owners and buyers who have already reset expectations.
Conclusion: 2026 takeaways for owners, investors, and sellers
Key findings from the 2026 study
Inflation still shapes storage values in 2026, but the market has already reset around higher rates and softer rent growth. So if you’re deciding whether to hold, refinance, or sell, use current cap rates and today’s financing costs as your guide, not 2022 pricing.
Indicators to watch through year-end 2026
As 2026 moves along, keep an eye on self-storage market trends, including cap rates, financing spreads, and lender appetite. Those factors will drive bids and exit pricing through year-end 2026.
If you’re thinking about selling, Oakside Co can help line up pricing, timing, and buyer targeting with current inflation and rate conditions.
FAQs
Why is boat and RV storage outperforming self-storage in 2026?
Boat and RV storage is beating traditional self-storage in 2026 for a pretty simple reason: there isn’t enough supply, and tenants tend to stick around much longer.
The gap shows up fast in the numbers. Monthly churn usually lands around 1% to 2% for boat and RV storage, compared with 3% to 5% for self-storage. On top of that, average tenant stays often run 2 to 5 years.
Demand also gets help from HOA parking rules, which leave many owners with few places to keep a boat or RV at home. At the same time, new development is hard to push through because zoning can be restrictive, and these projects often need 7- to 10-acre sites. That combination keeps supply tight.
The result: projected revenue CAGR through 2031 sits at 12.5% for boat and RV storage, versus 4.1% for traditional self-storage.
How does inflation affect storage property values?
Inflation can drag self-storage property values lower in two main ways: it pushes operating costs up and can lead to cap rate expansion.
As expenses climb, NOI gets squeezed. Property taxes, utilities, and labor all eat into cash flow. And that matters because value is based on NOI divided by the cap rate.
So when NOI falls and cap rates move up, market value can drop fast.
What should buyers focus on when underwriting storage deals now?
Underwrite to the property’s current stabilized cash flow and realistic borrowing costs – not wishful projections. Then back up every input with diligence-grade documents, including the rent roll, T-12, and expense history.
The main goal is to get to normalized NOI. That means cleaning up the numbers, fixing expense assumptions, and separating one-off items from the property’s steady performance.
From there, pressure-test the big variables:
- Exit cap rates
- Rent growth
- Lease-up timing and pace
- Downside cases for income and expenses
- Supply, entitlement, and exit risk
Be conservative across the model. If the deal still works under tighter lease-up assumptions, softer rent growth, and a harder exit, you’re looking at a much stronger case. If it only works when everything goes right, that’s a red flag.