
Selling self-storage properties in 2026 is more complex than ever. Many sellers misprice their facilities by clinging to outdated data from the pandemic boom. Here’s what you need to know:
- Cap Rates Have Increased: Rates are up 75–150 basis points since 2021, significantly lowering valuations. For example, a 0.5% cap rate shift can reduce a property’s value by hundreds of thousands of dollars.
- Local Market Trends Matter More: Self-storage demand is hyper-local. National trends don’t always reflect conditions within a 3–5 mile radius of your facility.
- Economic Occupancy Over Physical Occupancy: High physical occupancy doesn’t mean high revenue. Buyers scrutinize economic occupancy and metrics like RevPAF (Revenue Per Available Square Foot).
- Accurate Expense Reporting Is Key: Misreporting expenses, like leaving out management fees or ignoring property tax reassessments, can lead to lower offers.
- Missed Revenue Opportunities: Dynamic pricing and ancillary income streams (e.g., tenant insurance) are often underutilized, leaving money on the table.
- Institutional Buyers Are Thorough: Buyers demand detailed financial and operational records. Lack of preparation can derail deals.
Sellers must focus on current market data, accurate financials, and untapped revenue streams to maximize their sale price in today’s market.
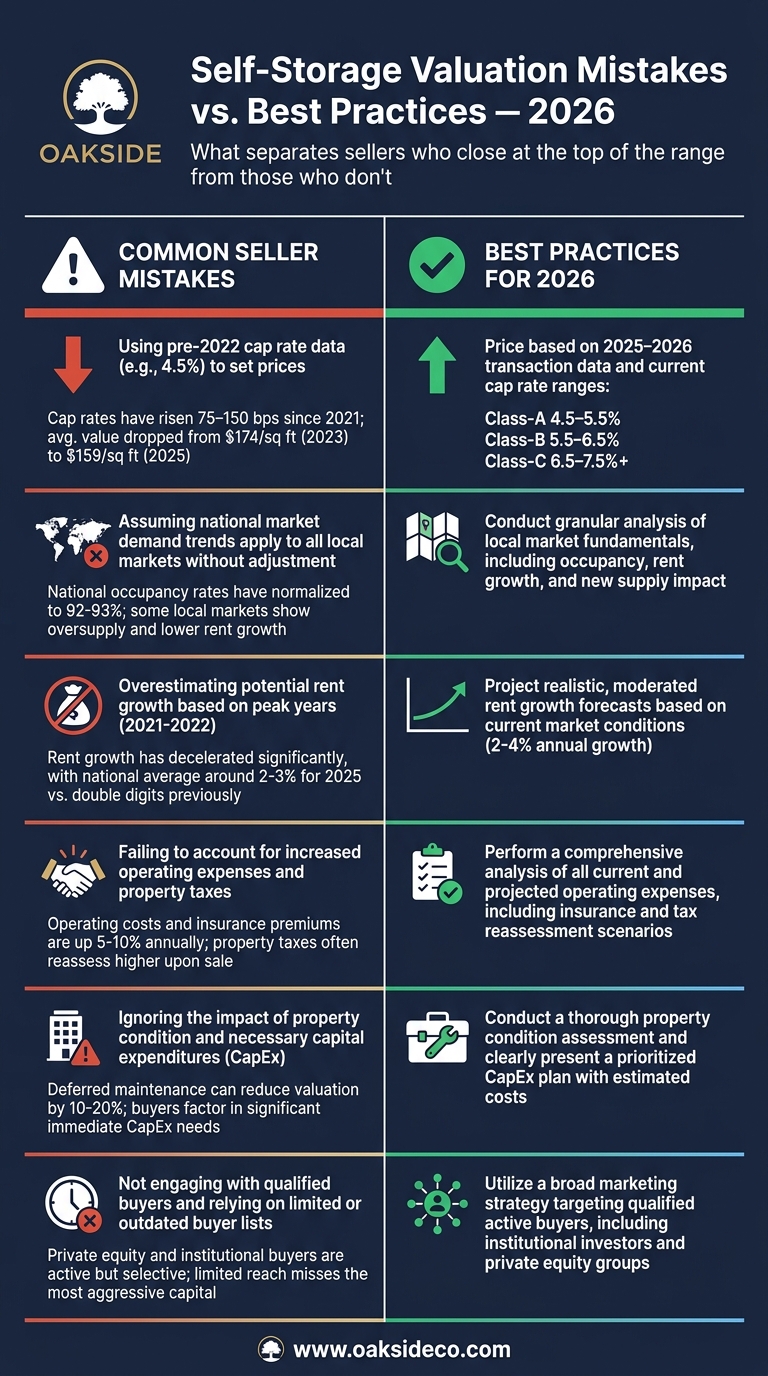
Self-Storage Valuation Mistakes vs. Best Practices in 2026
Misreading Market Trends and Cap Rates
Accurate self-storage valuations in 2026 require more than just updated financial data – they demand a solid grasp of local market dynamics. One of the biggest and most expensive mistakes sellers make is relying on how the market operated in the past instead of how it’s functioning today. These outdated assumptions can create a disconnect between what sellers expect and what buyers are willing to offer, often leading to failed deals.
Using Pre-2022 Cap Rate Data to Set Prices
The years 2021 and 2022 were far from typical. During that time, cap rates for Class-A assets dropped below 5%, fueled by low interest rates and an unusual surge in demand tied to the pandemic. However, those conditions no longer exist. Since then, cap rates have increased by 75 to 150 basis points, and even a half-point shift in cap rates can slash the sale price of a mid-size facility by over $300,000. This shift is already visible in average valuations, which have dropped from a high of $174 per square foot in 2023 to $159 per square foot in 2025.
Buyers in today’s market – especially institutional ones – focus on current cash flow and borrowing costs rather than speculative future projections. Sellers who base their pricing on 2021 comparisons are setting themselves up for disappointment. For example, if a seller prices their property with a 4.5% cap rate while buyers are underwriting at 6.5%, the deal doesn’t renegotiate – it collapses entirely. To remain competitive in 2026, sellers need to focus on 2025–2026 transaction data instead of clinging to the inflated values of the pandemic era.
| Asset Class | Market Tier | 2026 Cap Rate Range | Implied NOI Multiple |
|---|---|---|---|
| Class-A | Primary | 4.5% – 5.5% | 18x – 22x |
| Class-B | Secondary | 5.5% – 6.5% | 15.4x – 18.2x |
| Class-C | Tertiary | 6.5% – 7.5%+ | 13.3x – 15.4x |
| Value-Add / Lease-Up | Any | Exit + 100–150 bps | 8x – 12x (trailing) |
Along with aligning cap rates to current conditions, sellers must also account for local demand trends.
Assuming Demand Is the Same in Every Market
Self-storage has long been considered "recession-proof", and while that reputation holds some truth, it’s often misused. Sellers frequently rely on this label to justify high valuations, regardless of where their property is located. This approach can lead to inaccurate pricing.
Demand for self-storage is highly localized. For instance, a facility in a Sunbelt market like Phoenix, Tampa, or Atlanta faces a very different market environment than one in the Midwest or Northeast. Consider Florida: net migration inflows dropped 93% from their 2022 peak by early 2026, directly impacting rental activity and pricing in the region.
The reality is that the market for any self-storage facility is typically confined to a 3–5 mile radius. Factors like new competitors entering the area, a nearby residential project being delayed, or a competitor cutting rates can have a far greater impact than national trends. Sellers who overlook this local analysis and lean on the broad "recession-proof" narrative risk giving buyers reasons to lower their offers. In 2026, understanding the local supply pipeline and what’s driving demand in your specific trade area isn’t just helpful – it’s essential.
sbb-itb-09b4138
Ignoring Key Performance Metrics
Accurate operational metrics are just as critical as understanding market trends when determining a property’s true value. One common mistake sellers make is presenting these numbers inaccurately. Buyers in 2026 are thorough and dig deeper than surface-level stats. Let’s break down two common pitfalls: overemphasizing physical occupancy and misreporting expenses.
Prioritizing Physical Occupancy Over Economic Performance
At first glance, a facility boasting 93% physical occupancy might seem impressive. But if that occupancy is driven by discounts or outdated rental rates, the actual cash flow could tell a very different story. While physical occupancy measures how much space is rented, economic occupancy reflects the rent collected compared to the potential income at market rates. Often, economic occupancy trails physical occupancy by 5 to 15 percentage points.
Buyers also pay close attention to metrics like RevPAF (Revenue Per Available Square Foot). This metric provides a clearer picture by combining occupancy and rental rates into one figure, allowing for easy comparisons across facilities of varying sizes and unit types. For example, a facility with 88% physical occupancy and a strong RevPAF might be more profitable than one with higher physical occupancy but heavily discounted rents. To address gaps between physical and economic occupancy, sellers can implement existing customer rate increases (ECRIs) 6 to 12 months before listing the property. This demonstrates that rental income is both reliable and sustainable.
Misreporting Expenses and Profit Margins
Underestimating expenses can be a costly mistake for sellers. Since a property’s value is calculated by dividing its Net Operating Income (NOI) by the cap rate, even a single dollar of unreported expenses can significantly lower the valuation. For example, at a 6% cap rate, missing just one dollar of expenses could reduce the property’s value by about $16.67.
One common oversight is leaving out a professional management fee, especially when the owner manages the property themselves. Buyers typically adjust for this by applying a 6% to 8% fee on revenue. If this cost isn’t reflected in the NOI, buyers will adjust the numbers themselves, which can make the seller’s asking price seem inflated. Similarly, personal expenses like vehicle costs, owner salaries, or one-time legal fees should be removed from the financials to present a clean and accurate NOI.
Another factor to consider is property tax reassessment. In many states, a sale triggers a tax recalculation based on the new purchase price. If the current tax bill is based on an older, lower valuation, buyers will account for the higher post-sale tax burden in their offer. For instance, if taxes increase from $50,000 to $140,000 after the sale, the resulting drop in NOI can significantly impact the property’s valuation. Sellers who calculate and disclose this adjustment upfront often face smoother negotiations.
| Expense Category | Typical Range (% of Effective Gross Income) |
|---|---|
| Property Taxes | 8% – 15% |
| Payroll | 8% – 15% |
| Management Fee | 5% – 8% |
| Utilities | 3% – 8% |
| Insurance | 2% – 4% |
| Marketing | 2% – 5% |
In general, a well-managed and stabilized facility operates with expenses totaling 28% to 38% of its effective gross income. If the expense ratio falls below 28%, it could indicate deferred maintenance or under-investment. On the other hand, ratios above 45% might signal inefficiencies, prompting buyers to apply a higher cap rate, which reduces their offer.
Missing Revenue Management Opportunities
Revenue management is often an underutilized tool in self-storage valuations. Many sellers rely on flat pricing models or fail to track additional income streams, leaving significant revenue untapped. This doesn’t mean their property is underperforming – it simply means they haven’t fully captured its earning potential.
Not Using Dynamic Pricing
Static pricing can undervalue a self-storage facility. Operators relying on manual spreadsheets often miss out on 8% to 15% of potential revenue compared to those using professional rate management tools.
Why? Static pricing doesn’t adapt to changes in demand. Sophisticated operators, on the other hand, adjust rates in real time based on occupancy levels. For example:
- When occupancy exceeds 90%, rates are increased to maximize revenue.
- When occupancy drops below 85%, rates are lowered to attract more customers.
Additionally, relying solely on street rates for benchmarking can be misleading. In 2026, the more critical metric is the "achieved" or "in-place" rate, which reflects what tenants actually pay each month. The difference can be dramatic. For instance, by Q4 2025, Public Storage reported in-place rents that were 74% higher than their average move-in rates.
Beyond dynamic pricing, it’s equally important to account for ancillary revenue streams to maximize a facility’s total income.
Overlooking Ancillary Income Streams
Ancillary income streams are another often-missed opportunity that can significantly increase revenue. These include income from tenant insurance, late fees, administrative fees, retail sales, or even premium offerings like covered RV and boat parking. Professionally managed facilities typically see ancillary revenue contribute 4% to 7% of their total income. At a 6% cap rate, every additional dollar of net operating income translates to approximately $16.67 in added property value.
Tenant insurance, in particular, is a common area where revenue is left on the table. Industry benchmarks for insurance "attach rates" range between 70% and 85%. Facilities with attach rates below 50% are missing out on a substantial revenue stream. Institutional buyers know these benchmarks well, and if they see underperformance in this area, they’ll adjust their offers to account for the untapped potential.
The solution is straightforward but requires proper systems. Partnering with a reputable insurance provider and using modern property management software – like storEDGE or SiteLink – allows sellers to track attach rates and present verifiable data. This reassures buyers and strengthens cap rate assumptions. On the flip side, poorly tracked ancillary income can signal operational inefficiencies, which buyers often perceive as risk.
Being Unprepared for Institutional Buyer Due Diligence
In today’s market, institutional buyers are digging deeper than ever before. Beyond just pricing and operational metrics, their due diligence process can make or break the final sale price. Even sellers with solid revenue and strong occupancy numbers risk losing deals – and significant profits – if they’re not fully prepared for this level of scrutiny.
Buyers in 2026 are methodical, stress-testing every assumption. If your records are disorganized or your financial packages incomplete, buyer confidence can plummet quickly, potentially derailing the deal.
Not Having the Right Financial and Operational Documents Ready
Institutional buyers today demand a comprehensive, well-organized document package from the outset. This includes everything from rent rolls to financial statements. For example, a rent roll should detail unit mix, square footage, rental rates, and tenant records. Even a small discrepancy, like a $20,000 income error, can have a massive ripple effect. At a 6× multiple, that single error could slash $120,000 off the property’s value.
To instill confidence, pair your rent roll with a trailing twelve-month (T12) income statement and at least two years of monthly occupancy history broken down by unit type. Buyers also expect to see three years of profit and loss (P&L) statements, tax returns, balance sheets, lien sale compliance documents, a Phase I Environmental Site Assessment, and vendor contracts.
Here’s a quick breakdown of what buyers typically expect:
| Document Category | What’s Required |
|---|---|
| Financial | 3 years of P&L (monthly), tax returns, balance sheets, debt schedule |
| Operational | Current and 24-month rent rolls, unit mix summary, delinquency/AR aging, lien sale logs |
| Legal/Compliance | Phase I ESA, Certificate of Occupancy, ADA audit, zoning verification |
| Administrative | Vendor contracts, insurance declarations, 12 months of utility bills |
| Property | Property Condition Assessment (PCA), CapEx history, site plans |
A smart move is to upload all these documents into a virtual data room before listing the property. This can shave 30 to 60 days off the due diligence timeline, reducing the risk of buyer fatigue and avoiding last-minute renegotiations.
While documentation is critical, the physical state of your asset is just as important in shaping buyer perceptions.
Underestimating How Asset Condition Affects Offers
The condition of your facility plays a huge role in how buyers assess risk – and, ultimately, how much they’re willing to pay. For instance, if a property needs $150,000 in repairs, buyers may lower their offers by $300,000 or more. Why? They’re not just accounting for repair costs but also the uncertainty of uncovering additional issues.
Deferred maintenance is a major red flag. Problems with roofing, asphalt, or gate systems can completely derail a deal. And in today’s market, buyers also factor in technology infrastructure when evaluating a property’s condition. A facility with a modern website, online rental options, and cloud-based management software signals operational efficiency and scalability. On the flip side, outdated systems or manual processes can raise doubts about data accuracy and long-term viability.
To avoid these pitfalls, consider commissioning a professional Property Condition Assessment (PCA) at least a year before listing your property. Addressing $30,000–$80,000 in deferred maintenance upfront can save you from price reductions of $150,000–$300,000 later. Simple steps like fixing leaks, patching asphalt, and upgrading technology can go a long way in preserving your facility’s value and attracting serious institutional buyers.
Conclusion: How to Build a Stronger Valuation Strategy for 2026
To succeed in 2026’s market, sellers need to rethink their approach and align their strategies with current buyer expectations. The top-performing sellers have one thing in common: they stop relying on outdated benchmarks and start treating their property as a serious institutional asset. This means basing asking prices on trailing-12-month NOI (Net Operating Income) instead of outdated metrics like gross revenue or square footage. It also involves narrowing the gap between physical and economic occupancy, normalizing expenses with a market-rate management fee of 6–8%, and showcasing revenue growth through dynamic pricing and additional income streams.
Why does this matter? Even a small 0.5% change in cap rates can shift property values by hundreds of thousands of dollars. Sellers who understand this sensitivity and focus on operational metrics are better positioned to succeed.
The key is not just in the documents but in understanding how buyers evaluate properties today. This is where Oakside’s advisory team can make a difference, providing expert guidance to help sellers achieve superior outcomes.
"The mistake most storage owners make is benchmarking against gross revenue or facility size. The reality: self storage trades on cap rates applied to stabilized NOI." – Nolen Masserman, Managing Director at Oakside
Oakside Co specializes in helping self-storage sellers craft valuations that meet institutional standards. Their process includes NOI normalization, operational benchmarking, and positioning sellers competitively for buyers. In a 2026 market where preparation often outweighs luck, this data-driven approach can be the deciding factor between a good deal and an exceptional one.
As Cameron Vale, President at Oakside, explains: "Sellers who understand the full picture – cap rates, economic occupancy, deferred maintenance, and buyer psychology – are the ones who close at the top of the range. Our job is to make sure every seller we work with walks in with that advantage."
FAQs
How do I find the right cap rate for my facility in 2026?
To identify the appropriate cap rate for a property, start by reviewing 5–10 recent sales of similar properties in your area. For each property, take the trailing-12-month Net Operating Income (NOI) and divide it by the sale price. This calculation will give you a market-based cap rate.
According to Nolen Masserman, Managing Director at Oakside, cap rates can vary significantly depending on factors like market location, property quality, and demand. For example, Class A facilities in major markets typically have cap rates ranging from 4.5% to 6.5%, while Class C properties or those in rural areas often see cap rates climb to 8%–10% or higher.
What’s the fastest way to raise economic occupancy before selling?
One of the fastest ways to improve economic occupancy is by tightening delinquency management. Make sure your collections policies are consistently enforced, and take action – like conducting auctions – to remove non-paying tenants. This ensures your occupancy numbers reflect actual paying customers.
Another key step is reviewing your rent roll. Identify units with high demand, adjust pricing accordingly, and cut back on unnecessary concessions. These adjustments can help narrow the gap between physical and economic occupancy, ultimately increasing your net operating income and boosting your property’s value before putting it on the market.
What documents do institutional buyers expect during due diligence?
Institutional buyers often need a range of documents to evaluate a property’s financial health and physical condition. To meet these requirements, you should prepare the following:
- Financial Records: Include three years of audited or reviewed financial statements, along with a detailed rent roll and 24 months of occupancy history. These documents help buyers understand the property’s income and tenant stability.
- Property Assessments and Compliance: Provide a Phase I Environmental Site Assessment, zoning permits, proof of ADA compliance, and certificates of occupancy. These ensure the property meets legal and environmental standards.
- Contracts and Agreements: Gather vendor contracts, insurance policies, utility agreements, and any records of liens or easements. These documents clarify operational and legal obligations tied to the property.
Store all these materials in a secure digital data room for easy access and review by potential buyers. A well-organized data room can streamline the due diligence process and make your property more appealing to institutional investors.