If NOI is weak, I don’t stop at occupancy. A site can be 95% full and still post low margins when discounts cut rent, high-value spaces sit empty, or payroll and repair costs drift up.
Here’s the short version:
- I look at four metrics first: discounting, vacancy by unit type, payroll drift, and repair spend
- I compare results to a rough baseline of 65%–75% NOI margin and 25%–35% OER
- I check the gap between physical occupancy and economic occupancy
- I review covered, enclosed, and uncovered spaces separately because each empty space does not cost the same
- I track payroll per occupied space and R&M per occupied space each month
A few numbers matter right away:
- A first month free offer on a 12-month lease cuts annual rent by about 8%
- Economic occupancy often runs 3 to 8 points below physical occupancy
- Boat and RV storage often targets 63%–74% NOI margins
If I had to sum it up in one line, it’s this: low NOI usually comes from one broken revenue metric or one drifting expense line, not from occupancy alone.
| Metric | What I check | What it can tell me |
|---|---|---|
| Discounting | Effective rent vs. street rate | Rent is too soft |
| Vacancy mix | Empty spaces by unit type | High-rent units are dragging revenue |
| Payroll | Payroll as % of EGI | Labor cost is out of line |
| Repairs & maintenance | Spend vs. budget and per occupied space | Fix-now habits are eating margin |
Below, I’d turn that into a simple action plan: fix pricing rules, focus on high-rent unit vacancy first, and watch expense drift every month.
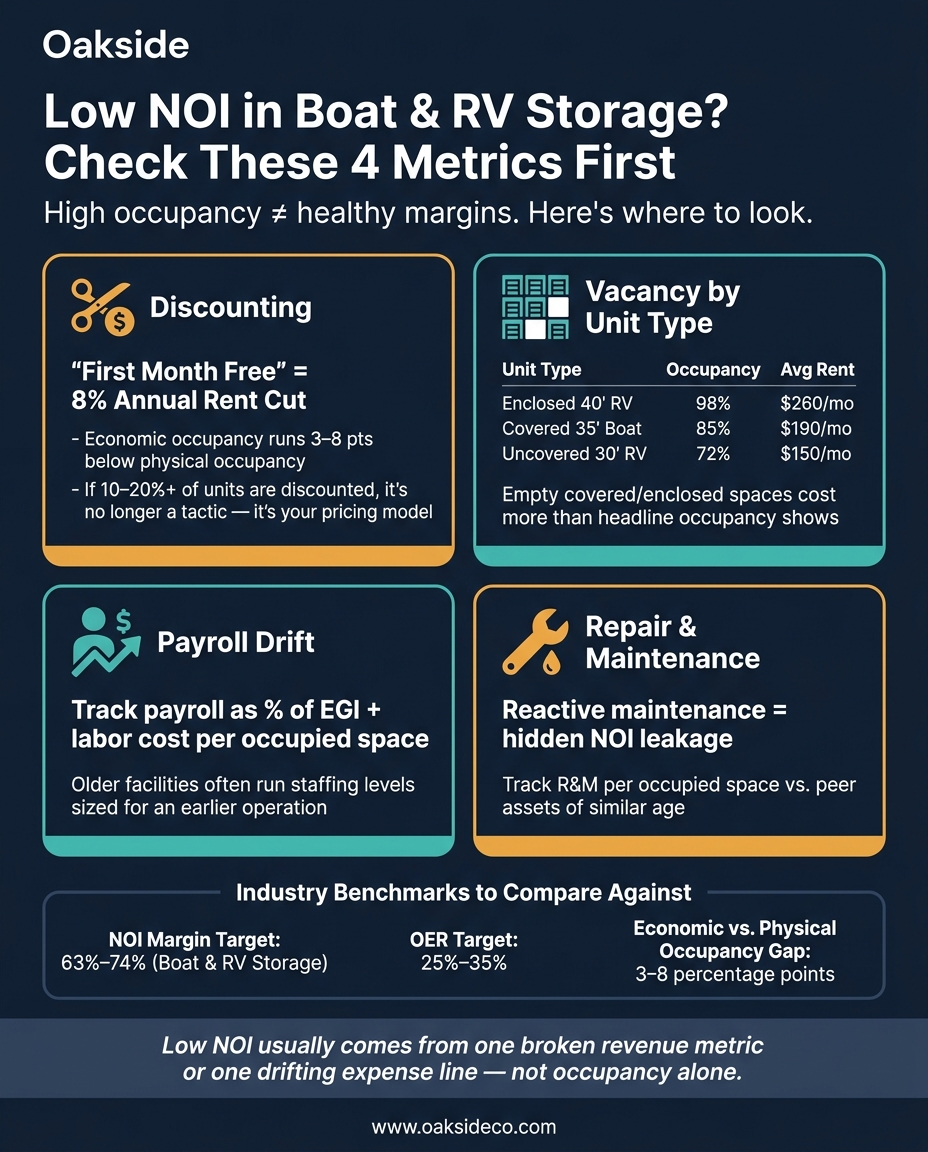
Boat & RV Storage NOI: 4 Key Metrics That Reveal Hidden Losses
Revenue Leaks: Discounting and Vacancy by Unit Type
The gap between physical occupancy and economic occupancy tells you where money is slipping out. Economic occupancy measures actual revenue against gross potential rent. And across the industry, it usually lands 3–8 percentage points below physical occupancy because of discounts, concessions, and non-paying tenants.
That gap matters. A small spread is normal. But when it gets too wide, it usually means one of two things: your discount policy is dragging down income, or your unit-type mix is working against you. Either way, EGI takes the hit.
Discounting Metrics That Compress Effective Rent
The usual problem is simple: a discount program that began as a lease-up tactic and then stuck around too long.
A "first month free" deal on a 12-month lease sounds harmless. In practice, it’s an 8% annual discount. Add another concession, and effective rent can slide even farther below street rate.
To spot the problem, track these four items:
- Discount penetration by unit type
- Effective rent vs. street rate
- Concession length and extension rate
- Discount use by leasing channel
If more than 10%–20% of occupied units are discounted, or if online move-ins still depend on promo codes, discounting is no longer a short-term tool. It’s become part of the pricing model.
That creates a chain reaction. Heavy discounting pulls down effective rent, squeezes NOI, and makes later rent growth harder. Over time, renewal rates and street rates can both drift lower because operators try to limit churn.
If discounting looks under control and NOI is still soft, the next step is to dig into vacancy by unit type.
Vacancy Review by Covered, Enclosed, and Uncovered Spaces
Not all vacancy hurts the same way.
Empty covered and enclosed spaces burn more revenue than uncovered spots because they rent for more. That means a property-level occupancy number can hide the real issue. If vacancy is piling up in enclosed 40-foot RV bays or covered boat slips, the revenue loss per empty unit is much steeper than the headline occupancy figure suggests.
Here’s how a unit-type view can point to the right move:
| Unit Type | Current Occupancy | Avg. In-Place Rent | Market-Comparable Rent | Recommended Action |
|---|---|---|---|---|
| Enclosed 40′ RV | 98% | $260/month | $250–$270/month | Maintain rate; test modest lift |
| Covered 35′ Boat | 85% | $190/month | $180–$200/month | Improve marketing; test short promo |
| Uncovered 30′ RV | 72% | $150/month | $130–$140/month | Reduce rate to align with market |
Occupancy on its own doesn’t tell the whole story. Pair it with time to lease and turnover by unit type. That’s how you tell whether the issue is price, weak marketing, or both.
sbb-itb-09b4138
Expense Drift: Payroll and Repair Costs
If pricing and vacancy look stable, the next place to look is expense drift. Revenue leaks usually get the spotlight, but rising costs can squeeze NOI just as fast. At mature boat and RV assets, payroll and maintenance often creep up so slowly that they slide under the radar. High occupancy doesn’t shield NOI if operating expenses climb faster than revenue. And that’s what makes this tricky: no single line item may look big enough to set off alarms, but together they can quietly eat into margins.
Payroll Drift and Labor Cost Benchmarks
Payroll drift often points to a labor setup that’s too manual or simply too large for current demand. A good way to spot it early is to track payroll as a share of EGI and labor cost per occupied space. Those ratios can show drift before total payroll makes it obvious. At older boat and RV facilities, the labor setup was often never reset, so staffing levels and workflows stayed sized for an earlier version of the operation.
If payroll ratios hold steady, move on to maintenance spend.
Repair and Maintenance Costs That Hide NOI Leakage
R&M is one of the toughest expense lines to benchmark. Strong occupancy can cover up inefficient spending, so the leak may only show up when you track R&M as a share of EGI and per occupied space, then compare the asset against peers with a similar age and product type.
In many cases, the problem is reactive maintenance. In plain English, that means fixing things after they break instead of preventing issues on a set schedule. Canopy integrity, specialized paving, and other infrastructure tied to vehicle storage can create hidden leakage when they aren’t managed through a preventive budget. Newly delivered Class A facilities usually have a very low R&M baseline in year one, which makes them a poor peer comp for mature assets.
These cost ratios should sit on the same monthly dashboard as occupancy and effective rent. Track them every month so payroll and R&M drift show up before NOI takes the hit.
Metric-Based Fixes for Low NOI
Once you know which metric is dragging down NOI, turn that finding into a clear rule for pricing, staffing, or maintenance.
Set Unit-Level Pricing and Discount Rules
Link discounts to demand at the unit level. As a property gets closer to stabilization, tighten concession limits. Short-term promo rates can help during lease-up, but they should stay just that: short-term.
Set a discount cap for each unit type. Covered and enclosed spaces should have the strictest limits. Uncovered spaces can handle more targeted promos, but each one needs a clear end date and a monthly review trigger. The point isn’t just to fill spaces. It’s to improve effective rent and lift NOI per space.
The data backs that up. A suburban facility that used price floors and caps by unit type moved occupancy from 78% to 91%. Another operator that split discount rules for new tenants and existing tenants posted 8% revenue growth across multiple sites. That’s why unit-level caps tend to work better than portfolio-wide concessions.
Premium unit types need tighter discount rules as well. Write those rules by unit class and enforce them at move-in.
If your pricing rules are already tight, shift your attention to labor and repair variance.
Build Monthly Dashboards and Quarterly Reviews
A fix only matters if you keep watching it. A monthly dashboard should track these four items: discount penetration by unit type, vacancy by unit type, payroll per occupied space, and repairs and maintenance variance versus budget.
Looking at those four metrics together makes it easier to spot where NOI pressure is coming from before it gets worse. Each one should lead to a set response, such as:
- a pricing reset
- a marketing change
- a staffing adjustment
- a maintenance correction
Quarterly reviews push the team to act. If a metric misses the mark for three straight months, assign one owner and one deadline for the fix.
Conclusion: Turn Low NOI Into a Specific Action Plan
Low NOI usually comes back to four metrics: discounting, unit-type vacancy, payroll drift, and repair creep.
When you isolate those four, the baseline tells you which lever to pull. Once that baseline is in place, any deviation points to the metric causing the drag. From there, you can move down to the unit level on revenue and the line-item level on expenses, so you don’t throw the wrong fix at the wrong problem.
That means tightening discount rules by unit class, closing vacancy gaps in covered and enclosed spaces first, bringing payroll back in line with EGI, and shifting repair spend toward prevention instead of reaction. Metric discipline moves NOI.
The fix only works if those same metrics stay under watch. Monthly dashboards catch drift early. Quarterly reviews create accountability. That gives you a repeatable process to keep NOI tracked and moving in the right direction.
FAQs
Why can NOI stay low at 95% occupancy?
Even when a property is 95% physically occupied, NOI can still lag if the asset isn’t performing well on the income side. One common reason is a big gap between physical occupancy and economic occupancy. That usually points to heavy discounting, too many concessions, or trouble collecting rent.
Low NOI at high occupancy can also point to flat pricing. If rents aren’t moving up even when demand is strong, the property can end up with a lot of tenants paying below-market rates. And that puts a cap on revenue fast.
What’s the difference between physical and economic occupancy?
Physical occupancy is the share of units or space that’s rented right now. Economic occupancy is the rent you collect compared with the property’s gross potential revenue at market rates.
Put simply, physical occupancy tells you how full a facility is. Economic occupancy tells you how much money that occupied space is bringing in.
Those two numbers don’t always move together. A property can show high physical occupancy but low economic occupancy if rent is discounted, concessions are in play, or tenants fall behind on payments.
Which unit types should I review first when NOI is weak?
Start by reviewing occupancy by unit type: climate-controlled, drive-up, and boat/RV options like open parking, steel canopy, and fully enclosed spaces.
This helps you spot which categories are losing tenants faster than they’re gaining them, and which high-demand units may be priced too low. Also check RevPAF by unit type to find revenue leaks and chances to improve your unit mix or rental rates.