If you want higher NOI, I’d watch expenses as closely as rent. In self-storage, margin loss often starts with small monthly leaks: payroll drift, utility spikes, weak ad spend, loose vendor terms, or repair bills that keep inching up.
Here’s the short answer: I’d review the P&L every month, split fixed costs from controllable costs, and track a few core ratios. The main expense lines are property taxes, insurance, payroll, utilities, marketing, repairs and maintenance, software or management fees, and G&A. The cost lines I’d check first are usually labor, contracts, utilities, and repeat repair work.
At a glance, the article comes down to this:
- NOI depends on both income and costs
- Some costs move slowly like taxes and insurance
- Some costs can shift fast like payroll, utilities, marketing, and repairs
- Monthly variance checks help catch cost drift early
- Benchmarks matter, especially:
- operating expense ratio
- expense per rentable square foot
- payroll as a share of revenue
- utilities as a share of revenue
- repair trends
- Boat and RV storage has a different cost mix, with more focus on lot upkeep, drainage, fencing, lighting, and insurance
- Vendor bids should be checked every 12 to 18 months, and I’d start 90 days before renewal
- Tenant basics still matter: access, response time, and site safety should not be cut
One point stood out to me: even a phone line can change the math. The article notes that some older copper lines may cost $100 to $300 per line per month, while cellular or IP options may land around $20 to $45. That kind of gap adds up fast across a site or a portfolio.
If I had to sum it up in one line, it would be this: watch the line items you can control, benchmark them every month, and cut waste without making the property harder to rent or run.
Understanding the Expense Structure of a Self-Storage Property
Fixed Costs, Variable Costs, and What Owners Can Influence
Start by separating the costs you can affect from the ones you mostly can’t.
Not every expense gives an owner the same amount of control. Some line items barely move with day-to-day decisions. Others change fast based on how the property is run. That split tells you where your attention should go.
Fixed costs are the expenses owners have less direct control over. Property taxes, insurance, and contracted fees already in place usually fit here. These costs matter, of course, but they often don’t change much just because you adjust daily operations.
Variable costs are where owners usually have more room to act. Utilities, payroll, marketing, and routine maintenance all respond more directly to operating decisions. Those are the line items worth watching most closely.
Operating Expense Ratios and Line-Item Checks
Once you know which costs can move, compare them against revenue and square footage.
Two metrics help you measure efficiency: total operating expenses as a percentage of gross revenue and expense per rentable square foot. Together, they show how much of your income is being eaten up by operating costs.
Track these ratios every month to set a baseline and catch cost drift early. Once you have that baseline, it’s much easier to see where savings may be hiding.
sbb-itb-09b4138
Where Owners Can Cut Expenses Without Hurting Operations
Once you’ve pinned down controllable costs, start with labor and recurring contracts. Those two line items usually have the biggest effect on NOI, and they’re often the fastest places to trim spend without touching the asset itself.
Payroll and Staffing
A lot of routine work can be handled through automation – billing, account checks, and basic support are common examples. The key is having clear handoff rules, so staff step in when an issue gets more involved.
From there, match labor to actual occupancy and call volume. Don’t staff for a version of the property that doesn’t exist. Look at billing history, service tickets, and escalation trends to see where employees are spending time on tasks that don’t need a person in the loop.
Vendor Contracts
Once staffing is in good shape, turn to vendor contracts for the next round of savings. At each renewal, check how much of the service you’re using, compare that usage to the scope in the agreement, and renegotiate – or cancel – services that no longer justify their cost.
Pay close attention to:
- renewal timing
- scope creep
- service-level pricing
That’s often where extra cost slips in. The aim is simple: lower expense without weaker service.
Budgeting, Benchmarking, and Portfolio-Level Oversight
Self-Storage Expense Benchmarks: 5 Key Metrics Every Owner Should Track
Once owners know which costs move, the next step is setting targets and checking variance against the plan. Budgets and variance reviews help catch expense drift before it cuts into NOI.
Building a Budget With Clear Targets for Each Expense Line
Build the budget around taxes, insurance, payroll, utilities, marketing, repairs and maintenance, and G&A. Give each line both a dollar target and a revenue-percent target.
A budget only works if every line is tied to something specific. If the target is vague, the review will be vague too.
Benchmarking One Facility Against Portfolio and Market Norms
Use three comparisons: actual vs. prior period, actual vs. budget, and actual vs. portfolio average. Each one tells you something a little different.
Prior-period results can show drift at the same property. Budget shows whether the team is hitting the plan. Portfolio average helps you see if one site is standing out for the wrong reasons.
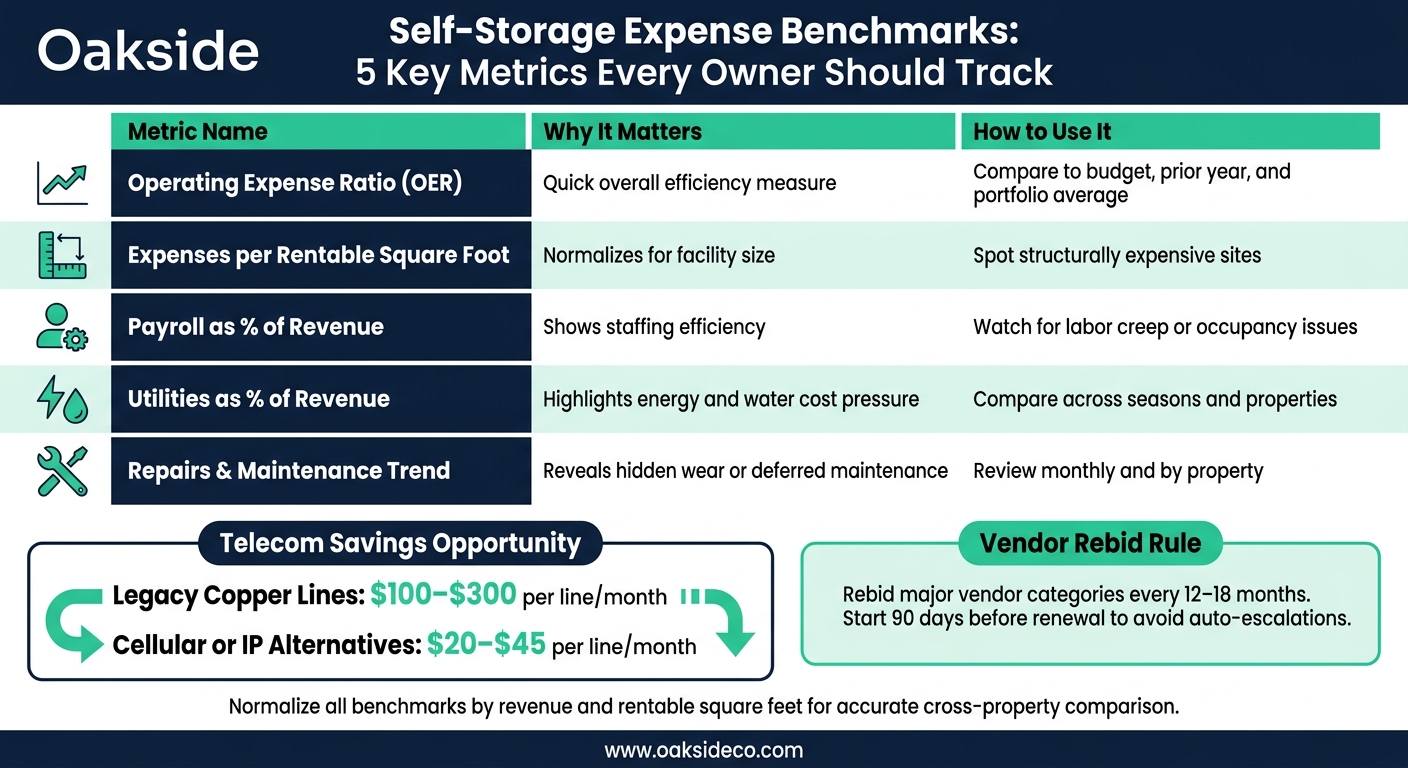
Track these five benchmarks at the property level:
| Benchmark | Why It Matters | How to Use It |
|---|---|---|
| Operating expense ratio (OER) | Quick overall efficiency measure | Compare to budget, prior year, and portfolio average |
| Expenses per rentable square foot | Normalizes for facility size | Spot structurally expensive sites |
| Payroll as % of revenue | Shows staffing efficiency | Watch for labor creep or occupancy issues |
| Utilities as % of revenue | Highlights energy and water cost pressure | Compare across seasons and properties |
| Repairs and maintenance trend | Reveals hidden wear or deferred maintenance | Review monthly and by property |
Normalize by revenue and rentable square feet. Raw dollars can blur the picture because they don’t account for size, mix, or occupancy differences. A high-cost site can also bury payroll, utility, or repair issues inside a portfolio average.
These same benchmarks can also show whether a property is running above or below what the market can support.
Using Data-Driven Reviews to Support Underwriting and Asset Strategy
The same approach also helps owners stress-test underwriting, not just monthly operations. Oakside uses this kind of analysis to test operating assumptions and flag outlier cost lines.
"Expense data shows how a facility has been managed and what it is worth. When we evaluate a self-storage or boat and RV property, we’re looking at operating assumptions line by line, flagging anything that’s out of range relative to the market, and using that to sharpen the underwriting."
- Cameron Vale, President at Oakside
Boat and RV Storage Expenses and Key Takeaways
How Boat and RV Storage Expense Profiles Differ
Boat and RV properties follow the same expense discipline as self-storage, but the cost mix looks different.
These sites are often large open lots, so the biggest repeat expenses usually center on lot upkeep, drainage systems, perimeter fencing, and security lighting. Liability insurance also tends to run higher because of the value of the boats and RVs stored on-site.
One smart place to look for savings is lighting. LED security lighting with motion sensors and photocells can cut utility bills without making the site less secure.
It also helps to draw a clear line between operating expenses and capital projects. For example:
- Operating expenses include landscaping, gate tune-ups, pest control, and drainage clearing
- Capital projects include paving repairs and major gate overhauls
Telecom deserves a close look too. Legacy copper lines are expensive and harder to maintain, so cellular or IP replacements can often trim the monthly bill. In many cases, that means about $20 to $45 per line per month, versus $100 to $300 for legacy copper.
Even with these site-specific costs, the same monthly variance review should still apply.
The Most Important Expense Management Habits for Owners
Use the same monthly variance review for boat and RV assets, but keep your eye on lot-specific costs.
Raw dollar totals only tell part of the story. It’s smarter to benchmark expenses per rentable square foot and per occupied unit. That gives you a clearer read on how the property is performing.
Vendor pricing can also drift up if no one checks it. Rebid major vendor categories every 12 to 18 months, and start at least 90 days before renewal so you don’t get stuck with auto-escalations.
At the same time, protect the basics tenants notice right away: access, responsiveness, and site safety. Cutting corners there can lead to vacancies and bad reviews. And in practice, those problems usually cost more to fix than the savings that caused them.