If I want to judge long-term storage asset value, I start with the numbers that change NOI. In this case, the big ones are occupancy, collected rent, pricing gaps, delinquency, leasing flow, and CapEx control. Even a small revenue gain matters: $1,600 more per month can add about $320,000 in value at a 6% cap rate.
Here’s the short version:
- NOI drives value
- Physical occupancy alone is not enough
- Economic occupancy shows what I actually collect
- Rate gaps can show missed income
- Delinquency and discounts can drag cash flow
- Move-ins, move-outs, and net rentals show demand
- CapEx variance can point to hold, refinance, improve, or sell
One number can mislead me. A site can be 94% physically occupied and still underperform if economic occupancy is only 78%. That spread often points to weak pricing, unpaid rent, or too many discounts.
What I take from this article is simple: long-term asset value comes from steady NOI growth, clean rent collection, disciplined expense control, and smart capital decisions over the full hold period.
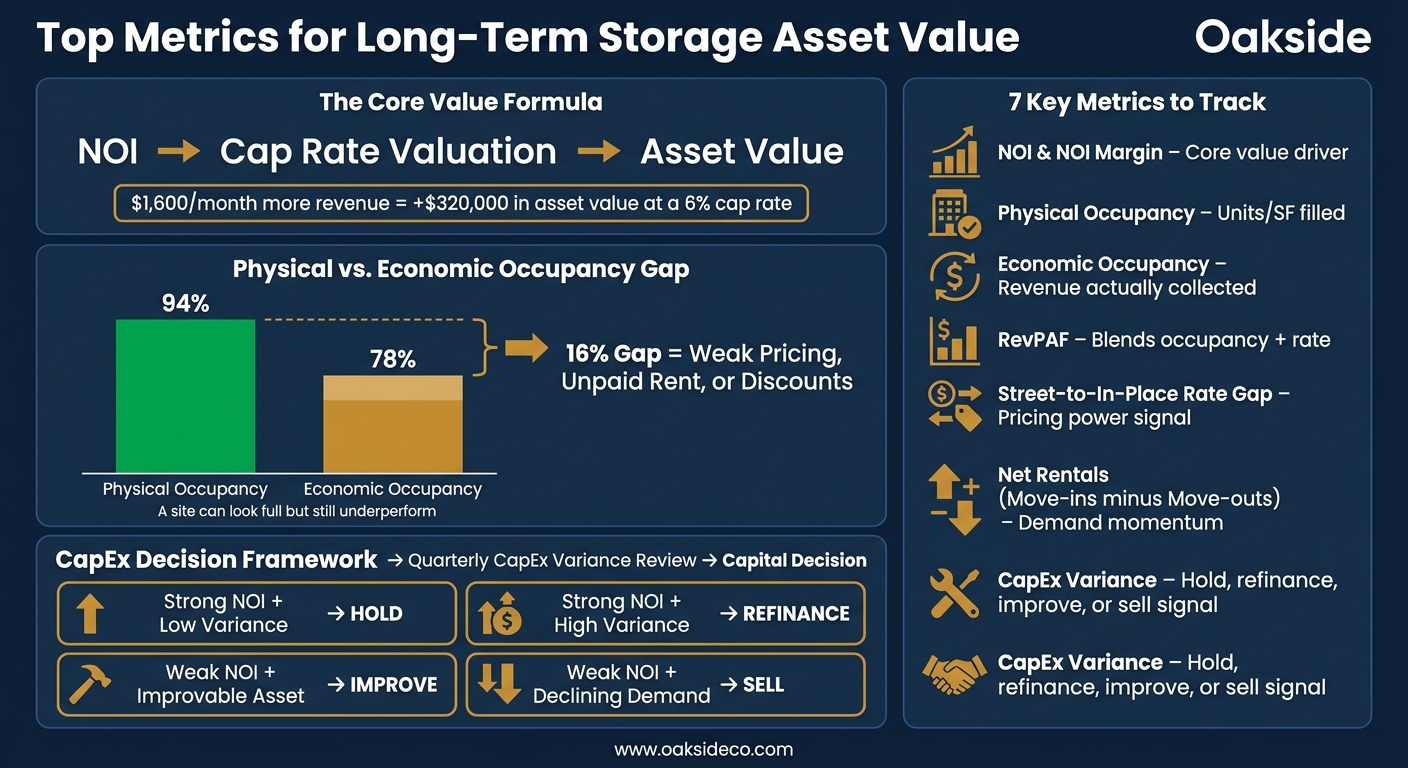
Key Storage Asset Metrics: Physical vs. Economic Occupancy & NOI Drivers
Financial Metrics That Directly Affect Value
NOI, NOI Margin, and Expense Ratio
Start with the income numbers that turn day-to-day operations into property value.
Net Operating Income (NOI) is the main measure of income performance and the basis for cap-rate valuation.
NOI margin shows how much revenue is left after operating expenses. Operating expense ratio (OER) flips that view and shows how much revenue goes toward operating costs. Put side by side, these metrics show whether the asset is turning revenue into steady cash flow.
Track NOI, NOI margin, and OER every month. If costs start climbing faster than revenue, stress-test NOI for insurance and utility spikes. Then look at whether that income is backed by occupancy and rent collection.
sbb-itb-09b4138
Revenue and Occupancy Metrics to Track Every Month
After NOI and expense ratios, the next step is to watch the day-to-day drivers of revenue: occupancy, rate, and leasing flow. If NOI is the end result, occupancy and rate are the levers behind it.
Physical Occupancy, Economic Occupancy, and Break-Even Occupancy
Physical occupancy shows how many units or square feet are filled. Economic occupancy shows how much of your gross potential revenue you’re actually collecting. When those two drift apart, that gap can point to discounting, delinquency, or weak pricing.
Break-even occupancy is the minimum occupancy needed to cover operating costs and debt service. Think of it as the floor that helps protect cash flow and long-term asset value.
RevPAF, Rate per Occupied Square Foot, and Street-to-In-Place Rate Gap
Revenue per available square foot (RevPAF) blends occupancy and rate into one metric. It helps you spot whether growth is coming from better occupancy, higher rates, or discounting.
Use rate per occupied square foot to isolate revenue from leased space. Then use the street-to-in-place gap to gauge pricing power on current tenants. From there, check whether those gains are backed by net rentals and rate increases.
Net Rentals, Move-In/Move-Out Flow, and Rate Increase Lift
Strong pricing means less if leasing volume doesn’t back it up. Net rentals – move-ins minus move-outs in a given month – are one of the clearest early signs of demand momentum. Track move-ins, move-outs, and net rentals together so you can tell whether occupancy gains are holding up or just hiding weakness underneath.
Revenue from rate increases – or rate increase lift – shows the added revenue created by tenant rate changes. Review these metrics every month to see whether growth has staying power or is only a short-term bump.
Customer, Market, and Asset Durability Metrics
Use operating and occupancy data to check whether the asset can hold its value long enough to cover future capital needs. This is where the analysis shifts from day-to-day durability to a tougher question: does this property still deserve more capital, or is it starting to send hold/sell signals?
Look at the basics first. Customer demand, market position, and occupancy trends can tell you a lot. If tenants keep renewing, space stays leased, and the asset holds up against nearby options, that’s a good sign. If occupancy slips, leasing slows, or customer mix gets weaker, you may need to maximize NOI in underperforming storage assets to stabilize the property.
The goal isn’t just to see how the property is doing today. It’s to judge whether current performance can last long enough to justify future spending. A building may look fine on the surface, but if it needs major capital work while demand is getting softer, the risk goes up.
At this stage, tie operating durability to capital planning. In plain English: if the asset can still attract customers, keep occupancy at healthy levels, and defend its place in the market, putting more money into it may make sense. If not, those same metrics may point toward a hold-with-caution stance or a sale.
Capital Planning Checklist and Key Takeaways
CapEx Tracking, Underwriting Variance, and Hold/Sell Signals
Once you’ve tracked NOI, occupancy, and rent growth, the next step is CapEx. This is where you check whether those gains have staying power.
Review CapEx every quarter. Compare each project with its original budget, the assumptions used in underwriting, and the results after the work was done. That side-by-side look shows whether the project still supports long-term value and whether it still ties back to durable NOI. If variance keeps showing up, don’t shrug it off. That usually means the project needs to be reworked or paused.
Just as important, that variance shouldn’t sit in a report and go nowhere. It should drive the capital decision. Use the review to decide whether to hold, refinance, improve, or sell as part of your exit planning. If the plan no longer matches performance, reset it.
Key Takeaways for Owners
A quarterly CapEx variance review turns budget drift into a clear signal: hold, refinance, improve, or sell.
FAQs
How do I calculate economic occupancy?
Divide actual revenue collected by the facility’s gross potential revenue. Economic occupancy shows how much of your total income potential you’re actually bringing in, which gives you a clearer picture of financial health than physical occupancy alone.
As Cameron Vale, President at Oakside, notes, the gap between physical and economic occupancy can point to revenue leaks like delinquencies or too many concessions. Ideally, economic occupancy should be within 3% to 8% of physical occupancy.
What is a healthy break-even occupancy?
For stabilized self-storage assets, a healthy physical occupancy rate usually lands between 82% and 92%.
That number works best when you look at it next to economic occupancy. In most cases, economic occupancy should stay within 3% to 8% of physical occupancy.
Here’s the simple read:
- If physical occupancy stays above 95%, rates may be too low.
- If it drops below 80% to 85%, you may need pricing changes or promotions to help demand.
When should CapEx trigger a hold or sell decision?
CapEx should trigger a hold-sell decision when needed improvements put the asset’s long-term value at risk or expose deferred maintenance that could drag down a sale.
Regular inspections of high-wear items like unit doors, roofs, and pavement help catch small problems early, before they turn into expensive repairs right before disposition. As Nolen Masserman, Managing Director at Oakside, notes, advisory review helps turn portfolio data into informed hold-sell and capital allocation decisions.