If I want more income from a storage site, I start with the layout, the unit mix, and the numbers that show wasted space. In self-storage and RV/boat storage, even a small gain in rentable area can improve NOI and support a higher sale price.
Here’s the short version:
- I measure net rentable area, site coverage ratio, and dead space before changing anything.
- I check whether low occupancy is tied to a bad unit or stall mix, not just weak demand.
- I compare layout choices like parallel rows, interior corridors, perpendicular stalls, and angled stalls based on access and density.
- I test whether a change adds enough income to cover the cost and improve exit value.
- I treat 40%–60% site coverage and 85%–95% occupancy by type as useful reference points, not fixed rules.
A simple truth drives the whole process: more rentable space only matters if it improves NOI. So I focus on moves that cut waste, keep traffic working, and turn underused land or units into income.
This guide explains how I would review the site, spot low-use areas, compare layout options, and judge each change by rent, cost, payback, and sale timing.
Measure Space Efficiency Before Changing the Layout
Once you know the site’s limits, the next step is simple: figure out how much of the property is actually making money. That’s where a few core metrics come in. They show where a layout change might add capacity without messing up access, traffic flow, or day-to-day operations.
Track Net Rentable Area, Coverage Ratio, and Dead Space
Net rentable area (NRA), site coverage ratio, and dead space are the three numbers that tell you how well a facility uses its land.
NRA is the total square footage available for lease. It’s the number tied most directly to revenue.
Site coverage ratio shows the share of the total site taken up by rentable structures or stalls. In plain English, it tells you how much of the land is doing actual work.
Dead space is the part of the site that sits unused or underused and can’t bring in rent. That can include oversized drive aisles, odd lot corners, or landscaping buffers placed in the wrong spots. Put those three metrics together, and you get a clear picture of how much of the site is productive and where a rework could win back capacity.
Review Unit and Stall Mix by Product Type
Compare occupancy by product type to spot units or stalls that lag behind the rest. Those weak spots often point straight to reconfiguration targets.
Facility Performance Snapshot
| Metric | Current | Target | Action Signal |
|---|---|---|---|
| Net Rentable Area (sq ft) | – | Maximize within site limits | Low NRA relative to total site area signals recoverable space |
| Site Coverage Ratio (%) | – | 40–60% (varies by site) | Below range indicates underused land; above range may restrict access |
| Dead Space (sq ft) | – | Minimize | High dead space points to layout reconfiguration opportunities |
| Unit/Stall Occupancy by Type (%) | – | 85–95% | Below-average occupancy by type identifies reconfiguration targets |
These baseline metrics show where layout changes may create usable space.
sbb-itb-09b4138
Improve Physical Layout for More Rentable Space and Better Access
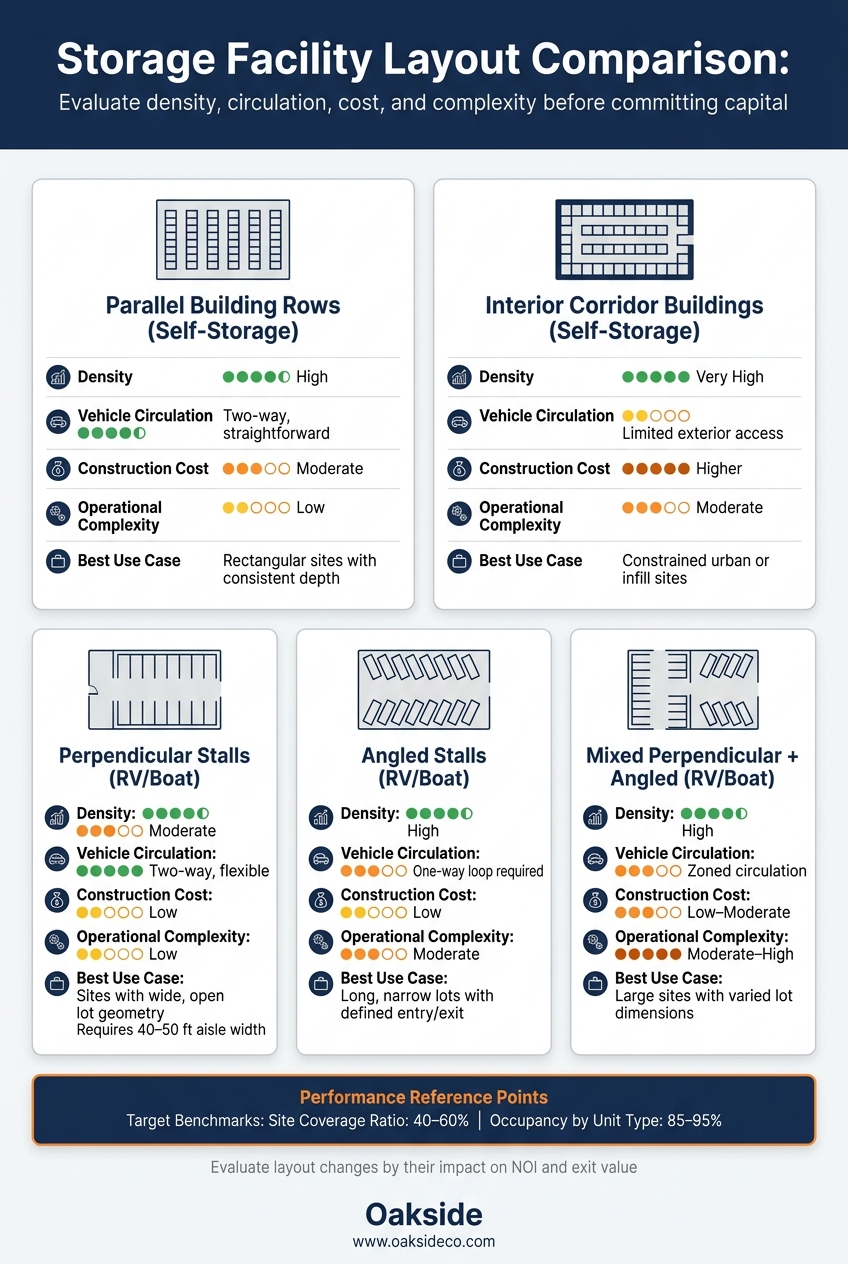
Storage Facility Layout Types: Density, Access & Cost Compared
Self-Storage Building Placement and Interior Layout
After you spot where space is slipping away, the next move is simple: rework the site so more of it becomes rentable. That usually means placing buildings in a way that cuts down wasted frontage, shortens drive aisles, and still leaves clear turning paths.
In many cases, parallel building rows lined up with the longest side of the site recover the most usable area. They tend to make better use of awkward corners and irregular lot edges that would otherwise sit there doing very little.
Interior corridor layouts can fit more units on tight sites. The tradeoff is that they need wider building footprints. So before you lock that in, check setback clearances and make sure the site can actually handle that setup.
RV and Boat Storage Lot Design: Aisle Width and Stall Pattern
For open-air RV and boat storage, aisle width and stall pattern do a lot of the heavy lifting. They shape both density and how easy it is for drivers to move around the lot.
Angled stalls can fit more spaces per acre, which sounds great on paper. But there’s a catch: they usually need one-way circulation. That can make entry and exit less flexible.
Perpendicular stalls are easier for two-way traffic and make ingress simpler. The downside is space. They need wider aisles – typically 40 to 50 feet – which cuts into the total number of stalls.
The right choice depends on a few practical things:
- The shape of the lot
- The length of the vehicles you expect
- Whether the site can support a one-way loop without dead ends
Physical Layout Tradeoffs
Use the table below to compare layout types before putting money into a final plan.
| Layout Type | Density | Vehicle Circulation | Construction Cost | Operational Complexity | Best Use Case |
|---|---|---|---|---|---|
| Parallel building rows (self-storage) | High | Two-way, straightforward | Moderate | Low | Rectangular sites with consistent depth |
| Interior corridor buildings (self-storage) | Very high | Limited exterior access | Higher | Moderate | Constrained urban or infill sites |
| Perpendicular stalls (RV/boat) | Moderate | Two-way, flexible | Low | Low | Sites with wide, open lot geometry |
| Angled stalls (RV/boat) | High | One-way loop required | Low | Moderate | Long, narrow lots with defined entry/exit |
| Mixed perpendicular + angled (RV/boat) | High | Zoned circulation | Low–Moderate | Moderate–High | Large sites with varied lot dimensions |
Increase Capacity Through Operations and Reconfiguration
Once the layout is in place, you can still squeeze more rentable capacity out of the site through day-to-day operations. Even if the physical setup can’t change, smart operating moves can help you recover space that would otherwise sit idle.
Adjust Pricing and Inventory by Demand Pattern
Look at occupancy trends and move-in data to see which spaces rent fast and which ones lag. Then adjust rates to match that demand.
Raise prices on units that move fast. Reprice slower units so they line up better with what tenants are willing to pay.
Reconfigure Underperforming Units or Stalls
After pricing is in line with demand, it’s much easier to spot spaces that aren’t pulling their weight. Those underused units or stalls can then be reworked to better fit what tenants want.
That might mean combining smaller spaces, splitting larger ones, or repurposing stalls for a different use case.
Connect Space Optimization to NOI and Exit Value
Every layout change, unit reconfiguration, or operating tweak should be judged by one thing: does it improve NOI and exit value?
That’s the standard.
If a project adds rentable square footage, supports higher rents, or removes operating drag, it’s worth a close look. If it doesn’t move NOI, it’s probably not worth the spend. It’s that simple.
Model Layout Scenarios Before Spending Capital
Before putting capital to work, compare each option side by side. Look at the added rentable space or stall count, the rent you can get, the capital needed, the payback period, and the day-to-day operating effect.
On paper, two ideas can look similar. In practice, one may add income with little friction, while the other eats up cash and creates headaches. That’s why the modeling step matters.
Where Specialized Advisory Support Fits
When a layout change connects to a planned sale or recapitalization, the choice has to tie straight to value creation. This isn’t just about making the site look better or squeezing in more units. It’s about knowing whether the change will lift NOI in a way that lines up with your timing.
Oakside Co helps owners pressure-test optimization plans, quantify NOI lift, and line up reconfiguration decisions with sale or recapitalization timing.
Conclusion: The Highest-Impact Moves for Storage Facility Space Optimization
Once the numbers are tested, the last question is simple: does the change improve NOI enough to justify the capital?
The best plans track efficiency, match unit mix to demand, improve access, and make every dollar earn its keep through NOI.
FAQs
How do I know if low occupancy is a layout problem or a demand problem?
Start by breaking down occupancy by unit type and location. If one set of units is almost full while another is lagging, that usually points to a layout or unit-mix problem, not soft demand. Then compare those patterns with properties in a 3- to 5-mile radius.
It also helps to look past overall occupancy. A big gap between physical occupancy and economic occupancy can point to collection problems or heavy concessions. On the flip side, high occupancy paired with flat revenue often suggests pricing inefficiency.
What metrics should I measure before changing my storage layout?
Before changing your storage layout, take a hard look at how the facility is performing. That’s often where you’ll spot revenue leaks and unit groups that aren’t pulling their weight. Nolen Masserman, Managing Director at Oakside, recommends zeroing in on occupancy by unit type, because overall occupancy can make weak demand in parts of the property easy to miss.
It also helps to track RevPAF, your expense ratio, and compare delinquency reports with physical occupancy. Cameron Vale, President at Oakside, says these numbers help owners make better capital planning decisions and layout changes that maximize asset value.
How can I tell if a reconfiguration will improve NOI?
Don’t stop at overall occupancy. Break performance down by unit type.
A simple way to do that is to calculate Revenue Per Available Square Foot for each category. That helps you spot space that isn’t pulling its weight. If one unit type stays above 90% occupied while others keep lagging, you likely have a pricing or layout issue. In plain terms, that’s a sign you may want to reconfigure space or change rates.
It also helps to check your expense ratio. A common target is 35% to 45%. If you have low-demand space, turning it into a use customers want more often can lift revenue. And if you add automation, you can cut payroll costs at the same time.