If you compare these two property types with the same KPI, you can price them wrong. I’d track self-storage by rentable square foot and boat/RV storage by stall count and stall type. That one shift changes how I read occupancy, rent, yield, supply, and deal value.
Here’s the short version:
- Self-storage: best read through NRSF, rent per rentable square foot, and RevPAF
- Boat/RV: best read through stalls, rent per stall, and RevPAS
- Occupancy is not enough: a boat/RV site with more covered or enclosed stalls can out-earn an open lot at the same occupancy
- Benchmarking differs: self-storage often uses square feet per capita and a 3- to 5-mile trade area, while boat/RV storage leans on stalls per 1,000 households and about a 15-minute drive time
- Cost structure differs: self-storage NOI margins often land around 55% to 65%; boat/RV often lands around 63% to 74%
- Tenant behavior differs: self-storage tends to have more turnover, while boat/RV customers may stay 2 to 5 years with churn near 1% to 2% per month
If I had to boil it down even more, I’d say this: self-storage sells space, while boat/RV storage sells parking positions plus access and protection.
Quick Comparison
| Area | Self-Storage | Boat/RV Storage |
|---|---|---|
| Main unit of measure | Rentable square feet | Stall count |
| Main rent metric | Rent per rentable sq. ft. | Rent per stall |
| Yield metric | RevPAF | RevPAS |
| Main supply check | Sq. ft. per capita | Stalls per 1,000 households |
| Trade area | 3 to 5 miles | 15-minute drive time |
| Typical stay | Shorter | 2 to 5 years |
| Churn | Higher | Lower |
| Stabilized occupancy | Low 90s% | 85% to 95% |
| NOI margin | 55% to 65% | 63% to 74% |
| What drives price gaps | Unit size, floor, climate | Open vs. covered vs. enclosed |
That’s the whole point of this comparison: use the denominator that fits the asset, or the rest of the math starts to drift.
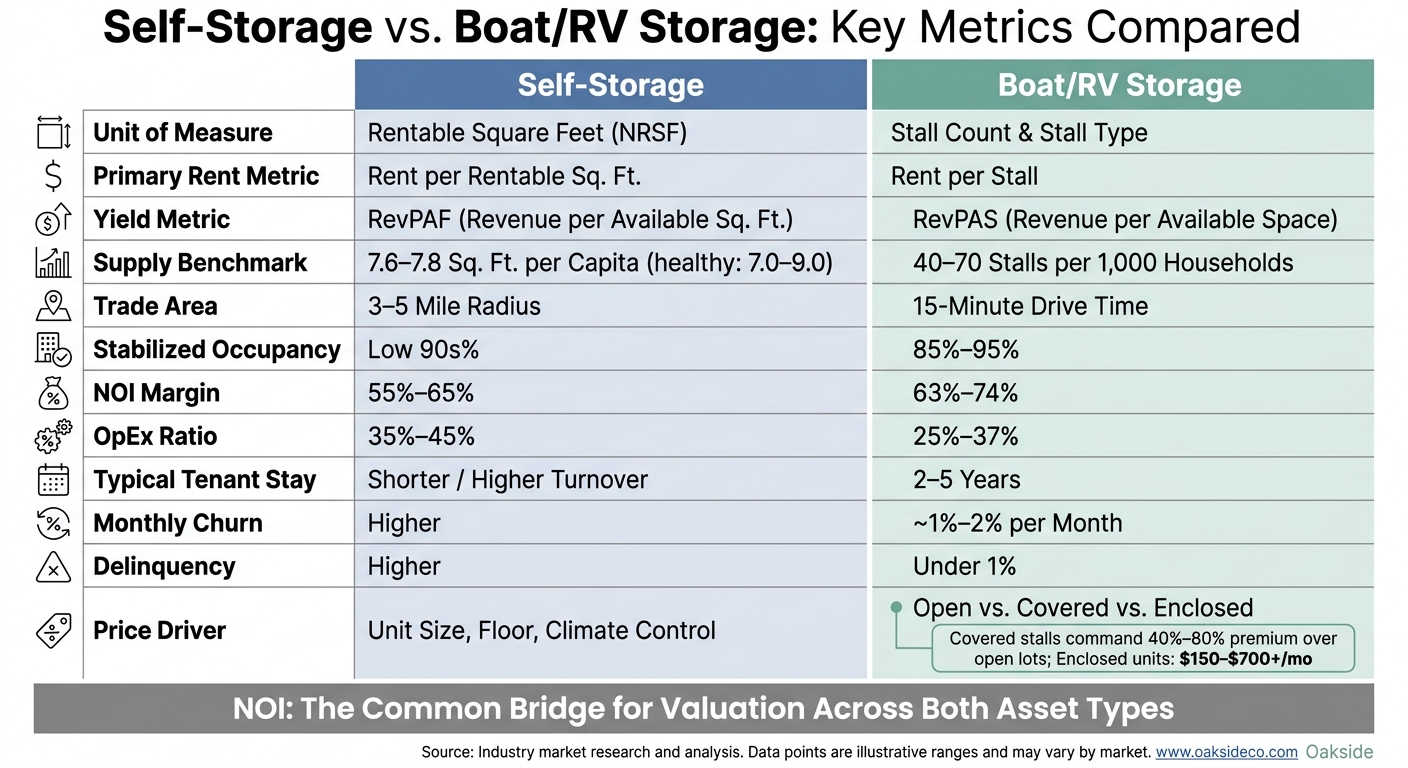
Self-Storage vs. Boat/RV Storage: Key Metrics Compared
Core Metrics for Both Asset Types, Side by Side
Self-storage and boat/RV assets don’t use the same measuring stick. And that changes how operators read occupancy, rent, and yield.
Self-Storage Metrics Used in Daily Performance Tracking
Self-storage comes in many unit sizes, so operators don’t lean on unit count alone. They track performance by rentable square foot.
The four numbers used most often in day-to-day operations are physical occupancy (occupied rentable sq ft ÷ total rentable sq ft), economic occupancy (actual rent collected ÷ gross potential rent), average monthly rent per rentable sq ft, and revenue per available square foot (RevPAF).
Here’s the simple way to think about them:
- Physical occupancy shows how full the property is.
- Economic occupancy shows how much of the rent that could be collected is actually coming in.
- RevPAF shows revenue yield across the full rentable footprint.
Boat/RV properties follow the same basic logic. The big difference is that the stall, not the square foot, is the main unit.
Boat/RV Metrics Centered on Stall Count and Product Type
For boat/RV assets, performance is tied to stall count, product type, and stall revenue.
The main metrics are occupancy rate (occupied stalls ÷ total rentable stalls), average monthly rent per stall, and revenue per available space (RevPAS).
Pricing can vary a lot by product type. Open or uncovered spaces usually run $75 to $200 per month. Covered canopy spaces often get a 40% to 80% premium over open lots. Fully enclosed units tend to range from $150 to $700+ per month, based on size and climate control.
That gap matters. If you blend all stalls into one average rent figure, you can miss where the money is. Segmenting by product type gives a much clearer read on performance. Use rent per square foot only when you’re comparing enclosed units.
The table below shows the shared metrics and the different denominators behind them.
| Metric | Self-Storage Formula | Boat/RV Formula | Comparability |
|---|---|---|---|
| Physical Occupancy | Occupied Rentable Sq Ft ÷ Total Rentable Sq Ft | Occupied Stalls ÷ Total Rentable Stalls | Directly comparable as a measure of fullness |
| Economic Occupancy | Actual Rent Collected ÷ Gross Potential Rent | Actual Rent Collected ÷ Gross Potential Rent | Directly comparable |
| Average Monthly Rent per Rentable Sq Ft / Average Monthly Rent per Stall | Average Monthly Rent per Rentable Sq Ft | Average Monthly Rent per Stall | Not interchangeable; self-storage normalizes by area, boat/RV by stall count |
| RevPAF / RevPAS | Total Revenue ÷ Total Rentable Sq Ft | Total Revenue ÷ Total Rentable Stalls | Different denominators; each measures yield on its own core unit |
| Maximize NOI Margin | (Revenue − Operating Expenses) ÷ Revenue | (Revenue − Operating Expenses) ÷ Revenue | Directly comparable |
sbb-itb-09b4138
Performance Benchmarks for Self-Storage vs. Boat/RV Properties
Knowing the right benchmark ranges is what separates a confident underwriting call from a guess. These two asset types do share some overlap on occupancy and NOI. But the numbers behind those benchmarks come from very different day-to-day realities. So once the core metrics are set, the next move is simple: compare each property against the right asset class.
Self-Storage Benchmarks at the Unit and Square-Foot Level
Self-storage is measured through net rentable square footage (NRSF) and unit mix. As of early 2026, national average supply stands at 7.6 to 7.8 square feet per capita, and a healthy trade area will often land in the 7.0 to 9.0 sq. ft. per capita range. Stabilized physical occupancy has settled in the low 90s% across most markets.
Economic occupancy usually comes in lower than physical occupancy. That’s because promotions, delinquency, and legacy rates drag it down. National average street rate reached $131 per month in March 2026. NOI margins for self-storage usually fall between 55% and 65%, while operating expense ratios tend to sit in the 35% to 45% band.
The key point: those ranges only mean something when they’re measured per NRSF, not just by unit count.
Boat/RV Benchmarks by Uncovered, Covered, and Enclosed Spaces
Boat/RV assets are judged by stall count, stall dimensions, and parking layout – not square footage. Demand benchmarking often starts with a 15-minute drive-time trade area. In a healthy market, that area can support 40 to 70 demanded stalls per 1,000 households. Stabilized occupancy for boat/RV facilities usually runs 85% to 95%, and delinquency rates stay under 1% because owners of high-value boats and RVs rarely walk away from them.
Boat/RV storage also tends to run leaner, with OpEx ratios of 25% to 37% and NOI margins of 63% to 74%. That gap isn’t random. It’s mostly structural: lighter staffing needs and longer tenant stays.
Same idea here: benchmark by stall type, not blended averages.
The table below shows performance benchmarks by product type for boat/RV storage, where rent can swing hard based on the level of protection. Covered stalls can command a 40% to 80% premium over open lots.
| Storage Type | Protection Level | Rent Range (Monthly) |
|---|---|---|
| Uncovered/Open | None | $75 – $200 |
| Covered (Canopy) | Overhead only | ~$400 avg. |
| Enclosed | Full / Drive-up | $150 – $700 |
| Climate-Controlled Enclosed | Full + Temp Control | $300 – $500+ |
Blend stall types, and the rent hierarchy gets muddy fast. Looking at each product type on its own gives you a cleaner read on pricing upside and how much protection features add to value.
Why These Benchmarks Are Not Interchangeable
Benchmark ranges only mean something when the denominator fits the asset. That difference between these two property types isn’t about taste or reporting style. It’s built into how each one works.
Self-storage units are divisible and tracked in net rentable square feet. Boat/RV storage works differently. Each stall is sized around the vehicle it serves, and the surrounding drive space isn’t optional. Large vehicles need room to turn, back in, and move out safely. That means drive aisles often need to be 50 to 55 feet wide – about twice the roughly 25-foot aisles you see in a standard self-storage facility.
That extra circulation area doesn’t produce rent, but the property can’t function without it. And it adds up fast. One occupied RV stall can use 300 to 500 square feet of site area. So if you judge a boat/RV asset by rent per square foot alone, you can make the space look weaker than it is.
How Layout, Access, and Product Mix Change KPI Interpretation
Two facilities can post the same occupancy rate on a summary report and still perform in very different ways. A self-storage property and a boat/RV site with mostly uncovered stalls may look similar at a glance, but the economics are not the same.
The big swing factor is product mix. Covered and enclosed stalls bring in much more rent than open parking. So the same occupancy rate can lead to very different revenue depending on what type of space is leased. Covered and enclosed spaces command 40% to 80% premiums over open parking, and climate-controlled enclosed units can go past $500 per month.
When to Use Per-Square-Foot vs. Per-Stall Analysis
This hits hardest when you’re turning property performance into underwriting. For self-storage, use per-square-foot metrics. For boat/RV, use per-stall metrics. The denominator has to match the asset.
Boat/RV supply is measured in stalls per 1,000 households, not square feet per capita. If you blend the two methods, the numbers may look easier to compare with self-storage, but they won’t show how the asset actually performs or how it should be priced.
NOI is the common metric used for underwriting and valuation across both asset types.
Applying the Right Metrics to Underwriting, Operations, and Value
Once you know which metrics match each asset type, the next step is simple: use them the same way every month, in a format people can act on.
How to Apply These Metrics in Reporting and Asset Reviews
Track monthly KPI dollar amounts, not just percentages. Percentages show that occupancy moved. Dollar figures show what that move did to revenue.
For self-storage, that means watching revenue per available square foot (RevPAF) next to physical occupancy. For boat/RV, it means tracking average rent per stall and revenue per available space (RevPAS). Once those metrics are in place, use them to guide reporting, underwriting, and sale-readiness decisions.
Split reporting by unit or stall type. If you blend different product types into one average, you can miss where pricing power sits and where rate changes may be needed.
Those same reporting splits should flow into underwriting stress tests. Self-storage is more exposed to new supply and rate pressure, so rate-led stress tests make more sense there. Boat/RV storage is more tied to fleet cyclicality, so occupancy-led stress tests are the better fit. Boat/RV also has a leaner cost structure, which helps it absorb cost inflation better than self-storage.
For disposition, focus on durable occupancy and low delinquency, not a one-month jump. When either asset reaches stabilized occupancy with steady low delinquency and churn, the income stream is usually durable enough to present with confidence to buyers.
Conclusion: The Metrics That Matter Most for Each Asset Type
Self-storage performance is best read through occupancy, rent, and revenue per available square foot. Boat/RV performance makes more sense through occupancy, average rent per stall, and revenue per available space. Put bluntly, one framework does not cleanly fit the other asset type.
NOI is the bridge between them. It turns day-to-day operating results – whatever the denominator happens to be – into the number that drives valuation and disposition decisions.
FAQs
Why can the same occupancy rate mean different revenue outcomes?
Occupancy by itself doesn’t decide revenue or profit.
In self-storage, costs like payroll, utilities, and property taxes can climb faster than revenue. When that happens, net operating income gets squeezed.
Boat and RV storage works a bit differently. At similar occupancy levels, it often holds onto more profit because the cost base is usually lower and steadier, especially for open-lot properties.
When should I use RevPAF instead of RevPAS?
Use RevPAF instead of RevPAS when you need to compare revenue across a facility with a varied unit mix.
In boat and RV storage, stalls often come in different sizes. That means RevPAS can make very different spaces look identical on paper.
RevPAF gives you a better read on performance because it standardizes revenue by actual square footage.
How does product mix affect boat and RV storage value?
Product mix has a direct impact on both revenue and cost control. The goal is to find the right balance: enough open-air space to keep build costs down, plus enough covered and enclosed units to earn higher rent.
A common split looks like this:
- 50% open-air
- 30% to 40% canopy-covered
- 10% to 20% fully enclosed
That mix tends to work because each product type plays a different role. Open-air spaces are cheaper to build and run. Covered and fully enclosed units cost more up front, but they often make up for it with higher pricing power.
As Nolen Masserman, Managing Director at Oakside, notes, this balance is key to maximizing returns. Open-air spaces have lower overhead, while enclosed and climate-controlled units can command 40% to 80% higher rates.