
If I were looking at storage in 2026, I’d focus less on national averages and more on small-market gaps in supply. The clearest setup is where self-storage supply is still low, boat/RV parking is hard to find, and local rules make new projects slow to approve.
Here’s the short version:
- Secondary and tertiary markets look stronger than major metros
- Self-storage occupancy is about 89% to 92% nationally, but many smaller markets are closer to 92% to 96%
- New supply is easing in 2026, with deliveries at 2.4% of stock, down from 3.0% in 2025
- Boat/RV storage has a supply gap: about 25 million U.S. households own an RV or boat, but there are fewer than 2,000 purpose-built facilities
- HOA rules matter a lot, because 86% of HOAs limit RV and boat parking
- For underwriting, I’d watch pipeline pressure, lease-up speed, permit delays, and exit cap rates
- In plain terms: buy or build where supply is low, demand is local and steady, and zoning slows new competition
I’d also separate the two asset types right away.
- Self-storage works best where renter growth, in-migration, and low per-capita supply support steady demand
- Boat/RV storage works best where ownership is high, outdoor use is common, HOAs restrict home parking, and sites near roads or recreation areas are hard to replace
Quick Comparison
| Asset Type | Best Market Clues | Main Risk | What I’d Watch First |
|---|---|---|---|
| Self-storage | Low supply per capita, renter growth, in-migration, thin pipeline | Too much new supply | Occupancy, rent trend, nearby deliveries |
| Boat/RV storage | HOA limits, recreation demand, low facility count, zoning friction | Thin buyer pool, seasonality | Site access, unit mix, permit timeline, exit cap |
So if I had to reduce the whole article to one idea, it would be this: the best storage markets in 2026 are not the biggest ones – they’re the ones where local demand is clear and new supply is still hard to add.
sbb-itb-09b4138
2. The 2026 Demand and Supply Backdrop for Storage Assets
In 2026, self-storage is in an early recovery phase. Supply is tight, values have leveled off, and results vary a lot by market. National occupancy is between 89% and 92%, but that headline number hides a sharp split between primary and secondary markets.
That means the next job is pretty simple: separate places with real demand from places where new supply is still working through the system, or learn how to find and buy self-storage facilities in these markets.
Self-Storage Demand Drivers in Emerging Metros
A few long-term shifts are pushing demand into smaller cities right now. Remote work migration is still moving households out of high-cost primary metros and into more affordable secondary cities. And when people move into smaller homes or apartments, they usually get less on-site storage space. On top of that, remote work, downsizing, and younger renters are broadening demand.
That shift is showing up in the numbers. Secondary markets are doing better than major metros, with occupancy between 92% and 96% and annual rent growth of 3% to 6%. By contrast, the top 25 metros are seeing flat or negative rent trends.
Boat and RV Storage Demand Drivers by Region and Use Pattern
Boat and RV storage follows a different script than self-storage. It tends to track ownership density, HOA rules, and access to recreation.
Demand is being pushed by younger owners, HOA limits, and not enough room to park at home. The median age of RV owners fell to 49 in 2025, and first-time owners now make up 36% of the base. Many of these owners live in HOA-governed communities that don’t allow large vehicles to be parked on-site.
HOA rules are a big part of the story. As of 2025, 78.1 million Americans lived in roughly 373,000 HOA-governed communities, and 65% of new single-family homes built in 2023 were governed by an HOA, up from 49% in 2009. Florida’s HB 1203 shows how this works in practice: it preserved the right of associations to prohibit any RVs or boats visible from the street or adjacent parcels. Physical space makes the issue even tighter. Residential side-yard setbacks can be as small as 7.5 feet, while modern rigs can run up to 45 feet long.
Not surprisingly, demand clusters in the Mountain West, Southeast, and lake or coastal markets. Chicago is a good example. It has only 20 facilities serving a metro of 9 million people, yet it posted +4.2% year-over-year RV/boat storage rent growth as of March 2025. Tampa posted +3.9% over the same period.
Where Supply Pressure Is Easing and Where It Still Matters
Once you’ve found demand, pipeline pressure becomes the tie-breaker.
Major Sun Belt metros still have heavy pipeline concentration. San Antonio saw rents fall 1.3% after delivering 47.9% of its stock over the prior 36 months. Central East Texas posted a 1.4% rent decline after adding 41.7% of its stock during the same period.
The cleaner opening is in secondary and tertiary markets where big developers haven’t spent much time. In those places, storage penetration often sits at 3 to 5 square feet per capita, which is well below the national average of 6 square feet per capita . When low penetration is paired with a thin pipeline and at least one demand driver, like a military base, a university, or a recreation hub, that’s usually the mix worth going after.
| Market Type | Occupancy | Rent Trend | Per-Capita Supply |
|---|---|---|---|
| Top 25 Metros | 85–89% | Flat to -2% | 8+ SF per capita |
| Mid-Size Cities (100K–500K) | 90–93% | +1–3% | Moderate |
| Secondary Markets (<100K) | 92–96% | +3–6% | 3–5 SF per capita |
Source: OppMap, 2026
3. How to Screen and Select Emerging Markets and Submarkets
A strong market isn’t enough on its own. You still need a repeatable way to screen submarkets so you can tell the difference between places that are starting to build lasting demand and places that just had a short pop.
Core Filters for Market Selection
Start at the metro level with a small set of screens.
Look for at least 1% annual growth from net in-migration. When people move in because jobs are being created, that’s a much better sign than a one-off bump tied to a single event or short-term trend.
Then look at household formation, especially among renters and younger professionals. This matters more than it may seem at first glance. Most multifamily properties don’t offer enough on-site storage, so a high share of renters can directly push storage demand higher.
Next, check the employment mix. Markets tied to healthcare, logistics, or technology often show steadier storage use than markets that lean too hard on one employer or one industry. If one company sneezes, the whole market shouldn’t catch a cold.
Use per-capita supply as a quick way to confirm what you’re seeing.
The last major filter is permitting friction. In markets where zoning calls for a Conditional Use Permit (CUP) or Specific Use Permit (SUP), the approval process can take 6 to 18 months. That delay can help shield a market from fast new competition. Add in high construction costs and the limited supply of properly zoned land – usually 7 to 10 acres for a workable dedicated vehicle storage project – and the barrier gets even tougher.
For boat and RV storage, add HOA rules to the screen. 86% of HOAs restrict RV and boat parking, which helps support long-term off-site demand.
Once a metro clears those checks, the next move is simple: match the product type to the submarket that fits it best.
Submarkets and Asset Formats Worth Tracking
After a metro passes the first round, focus on format selection. For boat and RV storage, the format can shape revenue in a big way.
Covered canopy stalls often get a 40% to 80% premium over uncovered spaces. And fully enclosed drive-up units can reach $150 to $400 per month across the U.S.. Gravel lots still have a place, but mostly for lower-price overflow demand. In coastal markets or places with rough weather, enclosed product is usually the starting point, not the upgrade.
At the corridor level, watch for two things: access and site layout. The best submarkets are often close to major roads, lakes, rivers, or national parks. The site also needs wide drive aisles and big turning radii so oversized vehicles can move in and out without a mess.
After that, test the submarket with actual facility data.
What Strong Local Data Looks Like Before You Invest
This is where many investors get tripped up. Metro averages can look fine while a local pocket struggles. So check facility-level data.
Occupancy above 85% to 90% with little discounting is a good sign. Heavy promotional pricing to fill units usually points to soft demand. Also review absorption, recent deliveries, and lease-up history for nearby comparable facilities.
A few markers help here:
- In tight submarkets, stabilization can happen in 6 to 12 months.
- In more balanced markets, underwrite 18 to 24 months.
- If nearby properties took longer than that to fill, or never fully stabilized, treat it as a warning sign no matter how strong the metro numbers look.
Charleston, South Carolina, is a clean example: the market posted +1.9% year-over-year rent growth in March 2025 with a frozen pipeline and zero new deliveries over the prior 36 months.
That mix – rent growth with no new supply coming in – is the kind of local setup you want to see before moving ahead.
Once a market clears these screens, shift to the asset level and underwrite lease-up pace, pricing power, and exit timing.
4. Underwriting, Risk Review, and Transaction Planning
Self-Storage vs. Boat/RV Storage: 2026 Underwriting Comparison
After screening, underwriting shows whether the market story still works once you run the numbers.
Acquisition and Development Underwriting Inputs
For acquisitions, start with the basics: verify in-place occupancy, current rent, and loss-to-lease. If those numbers are off, the rest of the model can drift fast.
On the development side, construction costs can swing a lot by product type. Paved outdoor stalls come in at about $15 per square foot, while climate-controlled enclosed units can hit $72+ per square foot. That gap has a big effect on your proforma. In 2026, Class A projects are generally underwriting to a 9% yield on cost against a 6% exit cap, which creates about a 300-basis-point development spread.
Boat and RV storage demand has staying power, so it often makes sense to underwrite longer hold periods and conservative exits.
There’s also more income here than base rent alone. Tenant insurance, dump stations, power, and concierge services can add 8% to 12% to gross income. Stabilized NOI margins for dedicated RV/boat facilities usually land between 63% and 65%, and can reach 74% for unmanned, tech-led platforms.
For exit underwriting, self-storage cap rates and those for dedicated RV/boat storage now trade at 6.0% to 7.5% for Class A assets and 7.5% to 8.5% for Class B, versus about 5.9% for self-storage. That gap points to niche liquidity risk, so near-term exit assumptions should stay conservative.
Main Risks in Emerging Storage Markets
The biggest risk in an emerging market is simple: too much new supply shows up before your asset stabilizes. When a market gets a heavy burst of new inventory in a short stretch, rents tend to soften and lease-up takes longer.
Entitlement delays are another issue that can quietly wreck timing. Conditional or specific-use permits can add 6 to 18 months of pre-development carry. For boat and RV assets, seasonal revenue swings can also squeeze annual NOI in markets with a short usage season. And peer-to-peer platforms can put pressure on pricing, especially at the lower end of the market.
Those risks usually shape the decision fast. Is this a buy, a build, or a pass?
| Risk Factor | Underwriting Impact | Mitigation |
|---|---|---|
| Oversupply | Rent softness, extended lease-up | Target markets with frozen pipelines or high entitlement friction |
| Entitlement Delays | 6–18 months of carry costs | Budget longer hold periods and higher contingency reserves |
| P2P Competition | Rate pressure on uncovered stalls | Focus on Class A enclosed/canopy product with amenities such as security and wash bays |
| Thin Buyer Pool | Wider exit cap rates (50–150 bps) | Underwrite conservative exit pricing; plan for longer marketing timelines |
| Seasonal Revenue | NOI compression in short-use markets | Diversify unit mix; verify year-round demand drivers before committing |
Self-Storage vs. Boat/RV: Key Underwriting Differences
Self-storage and boat/RV assets do not underwrite the same way.
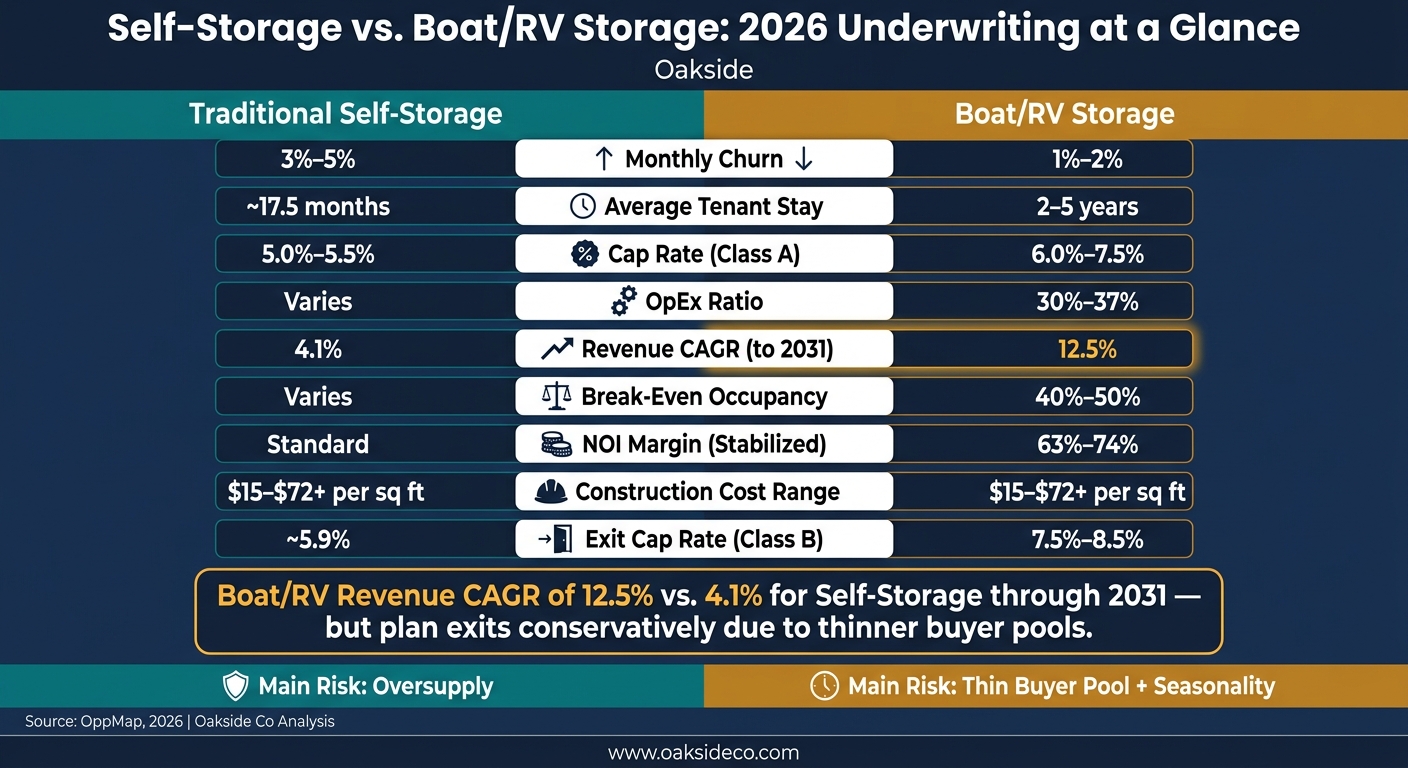
The clearest split is customer behavior. Traditional self-storage tenants churn at 3% to 5% per month. RV/boat tenants churn at only 1% to 2%, and average stays run 2 to 5 years. That kind of retention can make RV/boat cash flow steadier once the asset is stabilized, even if the lease-up period takes more time.
| Underwriting Factor | Traditional Self-Storage | Boat/RV Storage |
|---|---|---|
| Monthly Churn | 3%–5% | 1%–2% |
| Average Tenant Stay | ~17.5 months | 2–5 years |
| Cap Rate (Class A) | 5.0%–5.5% | 6.0%–7.5% |
| OpEx Ratio | Varies | 30%–37% |
| Revenue CAGR | 4.1% | 12.5% |
| Break-Even Occupancy | Varies | 40%–50% |
On the operating side, steel canopy structures and enclosed buildings need steady upkeep, and climate exposure – sun, wind, and weather – can speed up wear on both the site and the stored assets. Underwrite a realistic capital reserve, especially in coastal or high-UV markets.
For institutional owners planning a disposition, Oakside Co supports transaction management and investment-banking-level analysis across self-storage and boat/RV assets.
5. 2026 Investor Playbook and Conclusion
When to Buy, Build, Hold, or Exit
The right move in 2026 comes down to three things: supply, entitlement, and rent direction. The demand, supply, and underwriting screens covered earlier should guide the call here.
| Strategy | When It Applies | Key Threshold |
|---|---|---|
| Build | Secondary markets with low per-capita supply and entitlement friction | Target 9–12% yield-on-cost; plan for 6–12 month lease-up in tight markets |
| Buy | Value-add assets in secondary Sun Belt metros or Midwest infill nodes | Favor markets where supply is effectively capped |
| Hold | Undersupplied metros with minimal new supply | Condition: frozen pipeline with sustained rent growth |
| Refinance | Stabilized assets ready to reset debt and extend hold periods | Refinance into a long-term hold |
| Exit | Oversupplied Sun Belt markets where rents are declining | San Antonio rents fell 1.3% amid heavy deliveries |
Boat and RV assets get even tighter when zoning, acreage, and site access limit new supply. These projects usually need 7–10 acres plus conditional use permits, which puts a real cap on new competition. That same supply discipline should shape the final call on where to invest and how long to stay in.
Key Takeaways for 2026 Storage Market Selection
National averages can blur what’s happening on the ground. That’s why submarket-level occupancy, pipeline, and entitlement risk should drive selection. Supply relief helps, but it doesn’t wipe out submarket risk. In plain English: local pipeline data matters more than broad sector sentiment.
Self-storage and boat/RV assets also need different filters at each step, from demand screening to underwriting to exit planning. Boat and RV storage, in particular, stands out. Revenue in that segment is projected to grow at a 12.5% CAGR through 2031, versus 4.1% for traditional self-storage. That gap is hard to ignore, but it also means exit planning needs to start early and stay conservative.
Good market selection on paper isn’t enough. The win comes from disciplined execution. Owners and institutional investors planning their next move in 2026 can work with Oakside Co for transaction management and investment-banking-level analysis.
FAQs
How do I spot a true supply gap?
Look past national averages and study the local submarket. Check saturation data like square feet per capita, then compare it with recent construction deliveries and local absorption rates.
It also helps to review permits and planned developments within a three-mile radius. As Nolen Masserman, Managing Director at Oakside, notes, storage demand is highly local, and zoning or municipal barriers can create overlooked opportunities.
Which is riskier in 2026: self-storage or boat/RV storage?
In 2026, neither one is automatically the riskier bet.
Self-storage risk usually comes down to very local supply issues. If a market gets overbuilt, pressure can show up fast. Zoning can also be tougher. That said, slower construction and steady occupancy are helping keep the sector on firmer ground.
Boat/RV storage has a different setup. The big plus is structural undersupply, which gives the category room to work. But these sites often need more land and more specialized infrastructure. Demand can also swing more with the economy, since boat and RV spending is often discretionary.
What local data matters most before I invest?
Focus on hyper-local data within a 3-mile radius to make sure demand is higher than supply.
A few numbers matter most. One is NRSF per person. If it’s around 1.68 sq. ft., that can signal an undersupplied market. Another is the gap between physical occupancy and economic occupancy. If that spread is more than 10%, it may suggest collection problems or heavy concessions.
It also helps to look at:
- The renter vs. homeowner mix
- Average unit sizes
- Competing rates by unit type
- Local zoning
- The supply pipeline