
Boat and RV storage demand changes by region more than by season alone. If I had to boil this article down fast, I’d say this: cold northern markets usually fill up in winter, warm coastal and Sun Belt markets stay busier across more months, and inland lake markets stay sticky because people don’t want to lose a good spot.
Here’s the short version:
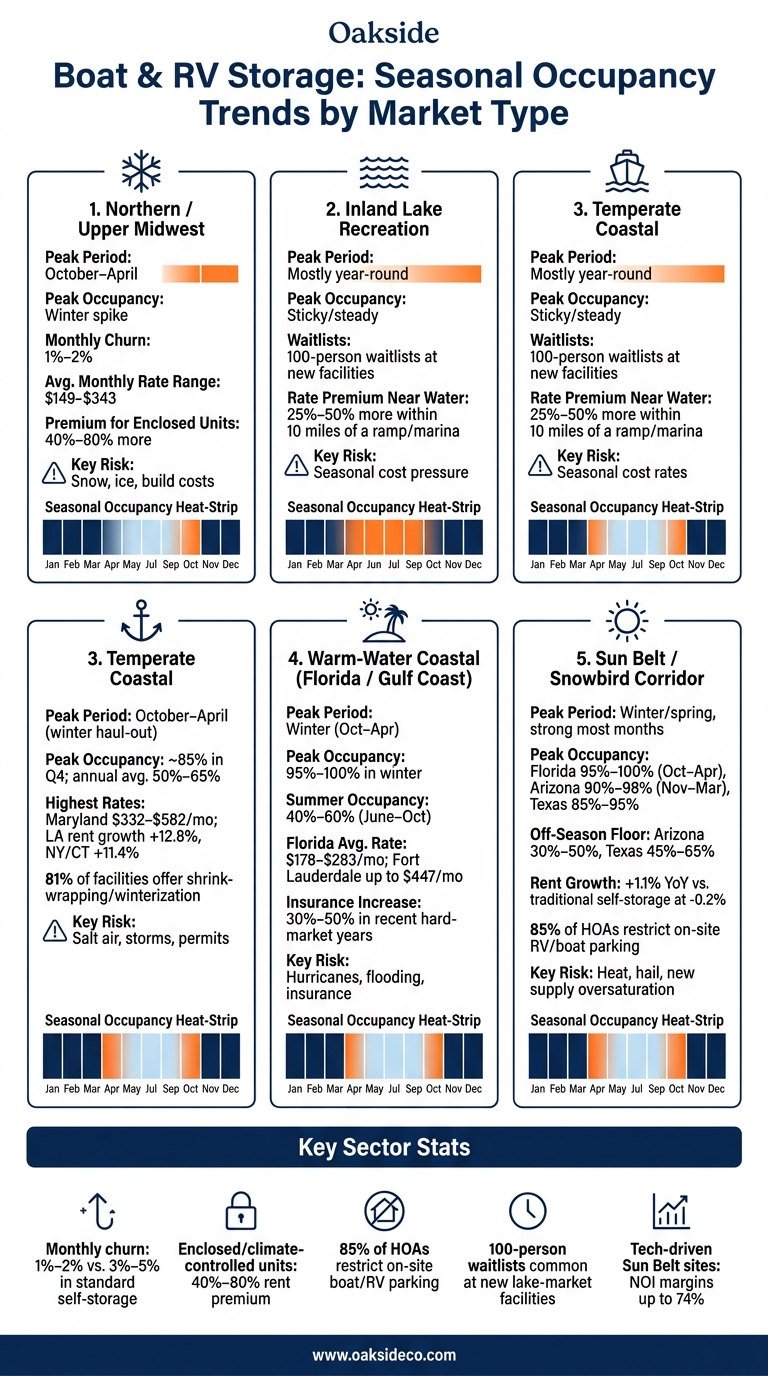
- Northern/Upper Midwest: busiest from October to April as owners move boats and RVs into storage for winter.
- Inland lake markets: often stay full most of the year because people want space close to the water.
- Temperate coastal markets: winter haul-outs drive demand, with strong rates in places like the Northeast and Mid-Atlantic.
- Warm-water coastal markets: winter is also the peak season, helped by snowbirds and year-round boating.
- Sun Belt/snowbird corridors: demand stays high for more of the year, though summer can still dip.
A few numbers explain the whole story:
- Monthly churn is only 1% to 2%, versus 3% to 5% in self-storage.
- Enclosed or climate-controlled units can rent for 40% to 80% more than open parking.
- Florida peak occupancy can reach 95% to 100% in winter.
- In some lake markets, new sites open with 100-person waitlists.
- About 85% of HOAs restrict on-site boat or RV parking, which keeps off-site demand in place.
Boat & RV Storage: Seasonal Occupancy by Market Type
Quick comparison
| Market type | Peak period | Occupancy pattern | Rate outlook | Main risk |
|---|---|---|---|---|
| Northern / Upper Midwest | Oct.–Apr. | Big winter spike | Strong, mostly for enclosed space | Snow, ice, build costs |
| Inland Lake | Often steady year-round | Sticky demand near the lake | Higher close to ramps/marinas | Seasonal cost pressure |
| Temperate Coastal | Oct.–Apr. | Winter haul-out lift | Some of the highest rents | Salt air, storms, permits |
| Warm-Water Coastal | Winter | High in winter, softer in summer | Holds up well | Hurricanes, flooding, insurance |
| Sun Belt / Snowbird | Winter/spring, but strong most months | More even than northern markets | Firm, but supply can weigh on growth | Heat, hail, new supply |
Bottom line: I’d read this market by monthly occupancy, not just annual averages. That’s the clearest way to see where cash flow is steady, where pricing power is strongest, and where seasonality can hide weak months.
sbb-itb-09b4138
1. Northern and Upper Midwest Cold-Weather Markets
Northern and Upper Midwest markets show the clearest winter storage spike. States like Wisconsin, Michigan, and Minnesota are some of the most seasonal boat and RV storage markets in the country.
Peak Occupancy Timing
In these markets, peak occupancy runs from October through April. Winter is the busy season because owners move boats and RVs into storage to shield them from harsh weather.
Seasonal Volatility
These markets are highly seasonal, but monthly churn stays low. It usually lands around 1% to 2%, versus 3% to 5% in standard self-storage. Long-term stays of two to five years are common.
Rate Resilience
Pricing holds up well across the region. Average monthly rates in key states range from $149 to $343, and winter demand helps keep rates firm.
| State | Avg. Min. ($/mo) | Avg. Max. ($/mo) |
|---|---|---|
| Wisconsin | $171 | $281 |
| Minnesota | $151 | $297 |
| Michigan | $149 | $316 |
| Ohio | $169 | $342 |
| South Dakota | $223 | $343 |
Source: FindBoatStorage, March 2026
Chicago stands out here. The city has about 20 dedicated facilities serving 9 million people, and advertised rates climbed 7.7% year over year in late 2025. Enclosed and climate-controlled units are also more common in cold-weather markets. Those units can command a 40% to 80% premium over basic outdoor parking.
Weather and Operational Risk
Cold-weather operations come with stricter site and build needs. Facilities often need snow-load and wind-load engineering, reinforced concrete surfaces, and wider drive aisles – usually 40 to 60 feet wide – to handle icy conditions and large rigs.
2. Inland Lake Recreation Markets
Inland lake markets – think Arkansas’s Beaver Lake and Lake Ouachita – tend to get a winter occupancy bump once boats come out of the water. Even so, occupancy often stays steady all year because owners want to keep their space close to the lake. That’s a key difference from colder northern markets. Around inland lakes, facilities often stay full through boating season because people don’t want to store their boat far from the water.
Peak Occupancy Timing
Boat use is limited – often just 9 to 24 days a year – so many owners keep paying for storage even while the boat is in the water. It may sound odd at first, but it makes sense. If you’ve got the spot, you don’t want to lose it.
That pattern, paired with tight supply, keeps waitlists long. In high-demand recreation markets, new facilities routinely open with 100-person waitlists. That gives you a pretty clear picture of how tight the market can get.
Seasonal Volatility
Owners with boats and RVs worth $50,000 to $200,000 usually aren’t eager to switch facilities over a small rate gap. A minor monthly savings often isn’t enough to justify the hassle, especially when the unit is close to the lake. The result is low churn and long stays.
Rate Resilience
Distance to the water has a direct effect on pricing. Facilities within 10 miles of a launch ramp or marina typically charge 25% to 50% more than properties farther inland. In plain terms, being near the lake matters just as much as the storage setup itself. The premium comes from location, not storage type alone.
Weather and Operational Risk
In colder inland markets, operators also need to plan for snow removal and higher winter utility costs. Those seasonal expenses can squeeze margins if they aren’t built into the budget early.
3. Temperate Coastal Markets
Temperate coastal markets work a bit differently from inland lake markets. Here, demand is driven less by how close a facility is to a launch ramp and more by winter haul-outs and local parking rules. In the Northeast and Mid-Atlantic, that winter storage cycle is easy to spot, though seasonality is usually less harsh than in colder northern markets.
Peak Occupancy Timing
In the Northeast and Mid-Atlantic, occupancy usually peaks from October through April as owners pull boats out of the water for winter storage. The Northeast stores 28% of the nation’s boats while accounting for only 18% of total registrations, which shows how much off-season storage matters in colder areas. Across northern and temperate regions, occupancy often climbs to about 85% in Q4.
The Pacific Northwest follows a different pattern. More owners keep boats in the water there, so the haul-out surge isn’t as sharp as it is farther east. As a result, occupancy tends to stay higher even after the main haul-out season ends.
Seasonal Volatility
Seasonality still shows up in a big way. Annual average occupancy often lands between 50% and 65%, even though summer months can push utilization close to 90%. Local parking limits and HOA rules also help keep demand in place, even when boating activity slows down.
Rate Resilience
Even with those occupancy swings, pricing holds up well in temperate coastal markets. Maryland leads the country in 2026, with average monthly rates ranging from $332 to $582. Much of that demand comes from the Chesapeake Bay corridor. In tight metros, rent growth has also been strong: Los Angeles climbed 12.8% in 2025, while New York and Connecticut grew 11.4%.
Why do rates stay firm? Supply is hard to add. Strict zoning, environmental regulations, and stormwater compliance slow new development and help owners keep pricing power.
Weather and Operating Costs
This pattern also pushes up maintenance work and operating costs. Salt air, freeze-thaw cycles, and storms all add wear and tear. That makes protected storage more attractive. Enclosed or climate-controlled units can command a 40% to 80% premium over outdoor parking, backed by demand for covered space during the winter haul-out season.
Many operators also add service revenue on top of storage fees. About 81% of temperate coastal facilities offer shrink-wrapping and winterization services.
4. Warm-Water Coastal Markets
Warm-water coastal markets – mostly Florida and the Gulf Coast – flip the pattern you see in colder parts of the country. Here, winter is the busy season, while summer tends to ease off. Year-round boating keeps a steady floor under demand, and snowbird migration adds another lift from late fall into early spring. That’s the opposite of northern and temperate coastal markets, where winter storage is what fills space.
Peak Occupancy Timing
Florida alone has about 1.2 million registered boats, more than any other state in the U.S.. Add in boat owners coming down from colder states, and it’s not hard to see why many Florida facilities hit 95%–100% occupancy during peak winter months.
In northern markets, winter usually means less boating and more storage. In warm-water coastal markets, winter brings the demand itself. That difference also helps explain why these facilities can see a steeper drop in summer than inland recreation markets.
Seasonal Volatility
Summer can be a rough stretch. Heat and hurricane season may push occupancy down to 40%–60% at many Florida facilities from June through October.
Even so, demand doesn’t disappear. A lot of owners still need off-site storage because local parking rules often limit where boats and RVs can be kept at home.
Rate Resilience
Even with the summer slowdown, rates in warm-water markets hold up pretty well. Florida’s statewide average minimum and maximum rates are $178 and $283 per month, and Fort Lauderdale climbs to $447 per month for dedicated RV/boat storage.
Weather and Operational Risk
The same climate that helps winter demand also brings real summer strain. Hurricanes, flooding, and salt-air exposure are the main operating risks in these markets.
In low-lying Gulf Coast markets such as Houston, flood risk is a major site-selection issue. Elevated pads and proper drainage aren’t nice extras – they’re critical. Salt air also speeds up corrosion on electronics, finishes, and mechanical systems, which helps support demand for enclosed and climate-controlled units.
Insurance costs tell the same story. In catastrophe-prone coastal markets, premiums climbed 30% to 50% during recent hard-market years, though broad declines started to show up in early 2026.
5. Sun Belt and Snowbird Corridor Markets
Compared with winter-heavy coastal markets, Sun Belt occupancy tends to stay high for more of the year and fall less sharply. Texas, Florida, Arizona, and the Carolinas show the most even demand pattern in this article. Mild weather and population growth help keep demand up across most months. There’s also a steady storage tailwind from housing rules: about 81% of homes sold in 2025 were inside community associations, and about 85% of HOAs restrict RV parking. When owners can’t keep an RV at home, off-site storage stays in demand even when travel slows down.
Peak Occupancy Timing
Sun Belt destination markets keep occupancy high through much of the year, with demand coming from both new residents and seasonal snowbird arrivals. Florida can hit 95%–100% occupancy from October through April, while Arizona often runs 90%–98% from November through March. Texas is a bit more balanced, with peak occupancy often landing in the 85%–95% range during winter and spring.
Snowbird corridors like Arizona, the Rio Grande Valley, and the Florida Gulf Coast get a lift from winter visitors who stay longer than a typical traveler. Facilities close to highways, campgrounds, and national parks tend to pick up more of that traffic.
Seasonal Volatility
Even with those strong peak months, the bigger edge in the Sun Belt is the higher off-season floor. These markets are steadier than northern ones, though summer still brings a noticeable slowdown. Arizona facilities may drop to 30%–50% occupancy in the hottest months, while Texas markets often settle around 45%–65%.
That floor stays higher for a simple reason: many owners keep their space year-round rather than give it up and risk not getting it back later. The median RV sits idle for about 340 days per year, which makes storage less of a short-term stopgap and more of a long-stay need.
Rate Resilience
Rates in Sun Belt markets stayed firm in 2025. In March 2025, RV and boat storage rents increased 1.1% year-over-year, while traditional self-storage rents fell 0.2%. That gap matters. It shows that this niche held up better even as the broader storage sector softened.
Not every market moved the same way. Houston and San Antonio posted near-flat rent growth of 0% to 0.5% in 2025 because a lot of new supply came online. Even so, strong operators still performed well. Carraway RV & Boat Storage in Magnolia, Texas, maintained 97% occupancy from 2021 to 2024 while increasing base rent from $4.69 to $5.35 per square foot.
Weather and Operational Risk
Steadier occupancy doesn’t mean these markets are low-friction. Site design still matters, and so does protection from local weather risk. In Texas and Arizona, intense summer heat and hail make covered canopy storage a sought-after product. For many tenants, that’s not a nice extra. It’s the main reason they choose one facility over another.
Security is another pressure point in high-traffic markets. Haslet Boat & RV Storage in Fort Worth spent $50,000 on monitored security after five break-ins. Texas also brings acquisition risk tied to property tax reassessments, which can reset assessed value to the purchase price and increase taxes after closing.
How Seasonal Trends Affect Revenue and Operations
Those occupancy swings hit the business where it counts: rent, contract terms, and day-to-day costs. In practice, seasonal demand tends to shape four things: occupancy stability, effective rent strength, contract structure, and asset configuration.
Occupancy stability is where the split between market types stands out most. Cold-weather markets see the biggest swings, while warm-water and Sun Belt markets tend to stay more even. That means cash flow is less predictable in the first group and steadier in the second. And that stability gap is a big reason seasonal markets end up with very different cash-flow patterns. Monthly churn across the sector is already low – just 1%–2% compared with 3%–5% in traditional self-storage – but that edge matters even more in places where demand doesn’t fall off as soon as the first warm weekend arrives.
Effective rent strength tends to follow supply and asset protection. Coastal markets support the highest absolute rents. At the same time, enclosed and climate-controlled units bring the biggest premium. Markets with limited supply can still post strong rent growth, especially when location and format make new competition hard to add.
Contract structure also changes by market. Northern facilities often lean on seasonal or annual contracts, sometimes with discounted rates, to hold winter occupancy and cut the risk of spring vacancies. Sun Belt operators are more likely to use month-to-month terms backed by steadier baseline demand. Nationwide, about 39% of boat owners sign annual contracts, which helps smooth occupancy in seasonal markets.
The table below shows how each market type tends to shape the operating model:
| Market Type | Asset Format | Occupancy Swing | Premium Potential | Operating Burden |
|---|---|---|---|---|
| Northern / Upper Midwest | Enclosed / Climate-Controlled | High (Winter Peak) | High | High (Seasonal Pulses) |
| Inland Lake | Covered Canopy / Open | Moderate (Summer Peak) | Moderate–High | Moderate (Weekend Cycles) |
| Temperate Coastal | Covered Canopy / Enclosed | Moderate | Very High | Moderate |
| Warm-Water Coastal | Covered Canopy / Enclosed | Low (Year-Round) | High | Low |
| Sun Belt / Snowbird | Covered Canopy | Low–Moderate | Moderate | Low (Often Tech-Driven) |
Asset configuration pulls all of this together. A facility built for a northern market needs wide drive aisles – 40 to 60 feet to handle modern rigs – enclosed bays, and enough staff to deal with concentrated seasonal move-ins. A Sun Belt site built around year-round demand can operate with a leaner setup, including unmanned, tech-driven systems that can push NOI margins up to 74%.
Pros and Cons by Market Type
These operating patterns lead to very different investor profiles. Put simply, each market type comes with its own risk-and-return mix. Some markets offer stronger pricing, others offer steadier demand, and some look great on paper until supply starts piling up.
Here’s a side-by-side look at the main trade-offs.
| Market Type | Main Pros | Main Cons | Best Fit |
|---|---|---|---|
| Northern / Upper Midwest | Strong winter demand and premium rates for enclosed or climate-controlled units | Short recreation season; peak occupancy is concentrated from October through April | Value-add investors targeting undersupplied urban infill; operators converting open lots to enclosed or heated units |
| Inland Lake Recreation | Sticky local demand and strong customer loyalty | Lower absolute rent ceilings than coastal markets | Boutique or regional operators with strong local market knowledge |
| Temperate Coastal | Highest rental rates and strong pricing power | Very high barriers to entry; limited waterfront supply; difficult entitlement and zoning processes | Institutional or high-net-worth investors seeking core, long-term assets |
| Warm-Water Coastal | Year-round demand and strong winter occupancy | Higher land costs; salt air and hurricane exposure require durable construction and can raise insurance costs | Institutional platforms with the scale to diversify weather risk across a national portfolio |
| Sun Belt / Snowbird Corridor | Year-round demand, population growth, and HOA-driven off-site storage demand | Oversupply risk in high-delivery metros – San Antonio rents fell 1.3% after deliveries reached 47.9% of existing stock over 36 months | Large-scale developers and tech-leveraged operators focused on high-volume sites |
That mix affects more than just location choice. It shapes underwriting, hold period, and the asset strategy that makes sense in each market.
Conclusion
Seasonal occupancy in boat and RV storage follows regional patterns, not one national script. Geography plays a part, but seasonality does more of the heavy lifting. Cold-weather markets tend to peak in winter, while Sun Belt and coastal assets usually hold steadier through the year.
That gap matters because annual occupancy, by itself, can blur the actual revenue cycle. A yearly average might look fine on paper, but monthly occupancy tells the more useful story: are you pricing strategies for peak demand, or are you stuck with low-rate, long-term contracts that limit upside?
That’s also why unit mix matters. In northern markets, enclosed and climate-controlled units are often the premium option. In Sun Belt and coastal markets, the focus shifts more toward retention, amenities, and pricing discipline where occupancy tends to stay more even.
FAQs
Why do boat and RV storage occupancy trends vary more by region than by season?
Boat and RV storage occupancy tends to vary more by region because long-term demand is driven by local conditions, not just seasonality.
Things like HOA rules, zoning ordinances, parking bans, population density, and ownership patterns can create a year-round need for off-site storage. As Nolen Masserman, Managing Director at Oakside, notes, these structural market drivers usually outweigh short-term seasonal swings.
Which markets tend to have the most stable year-round occupancy?
Markets with the steadiest occupancy all year tend to be the ones where owners leave boats and RVs in storage for long stretches, even when they’re not using them.
That pattern helps keep units filled on a steady basis. And even in seasonal areas like the Midwest, plenty of customers keep their rentals for months or even years. For facility owners, that creates a dependable base level of occupancy and long-term income.
How should investors track monthly occupancy when underwriting a boat or RV storage facility?
Move past generic occupancy metrics and focus on the durability of the revenue base. In this category, that tends to track more closely with the local installed base of boats and RVs than with annual sales.
Track occupancy along with a few local demand and pricing signals:
- Local supply
- Residential parking constraints, such as HOA rules
- Customer tenure
- Churn
- Delinquency
- Rent growth by unit size
That last point matters more than it may seem. Demand can vary a lot between smaller spaces and large RV units, so looking at pricing and occupancy in the aggregate can blur what’s happening on the ground.