If you want the short answer, here it is: in August 2026, most U.S. self-storage deals trade around 5.0% to 7.5%+ cap rates. Lower rates often point to stronger assets in top markets. Higher rates often show more lease-up risk, weaker collections, older product, or smaller-market exposure.
If I were sizing up a deal fast, I’d look at four things first:
- Market tier: primary, secondary, or tertiary
- Asset class: Class A, B, or C
- Occupancy quality: physical occupancy and economic occupancy
- Revenue mix: climate-controlled, drive-up, boat/RV, and discounting
A simple pricing move can shift value fast. On $1,000,000 NOI, a move from 5.50% to 6.50% cuts value from about $18.18 million to about $15.38 million. That is a drop of nearly $2.80 million.
Here’s the plain-English takeaway:
- Class A in primary markets: often around 5.0%–5.75%
- Class B in secondary markets: often around 6.0%–6.75%
- Class C in tertiary markets: often around 7.25%–7.5%+
- Lease-up and value-add deals: often around 7.5%–9.0%+
- Upper-80% to low-90% occupancy, with solid collections, can support tighter pricing
- 60%–75% occupancy or weak collections can push pricing higher
| Deal Type | Typical 2026 Cap Rate |
|---|---|
| Class A, Primary | 5.0%–5.75% |
| Class B, Secondary | 6.0%–6.75% |
| Class C, Tertiary | 7.25%–7.5%+ |
| Value-Add / Lease-Up | 7.5%–9.0%+ |
My bottom line: cap rate benchmarks are a starting point, not the answer by themselves. If you know the market tier, asset class, occupancy quality, and revenue mix, you can place a deal in the right band much faster and judge whether the asking price makes sense.
2026 Cap Rate Ranges by Market Tier and Asset Class
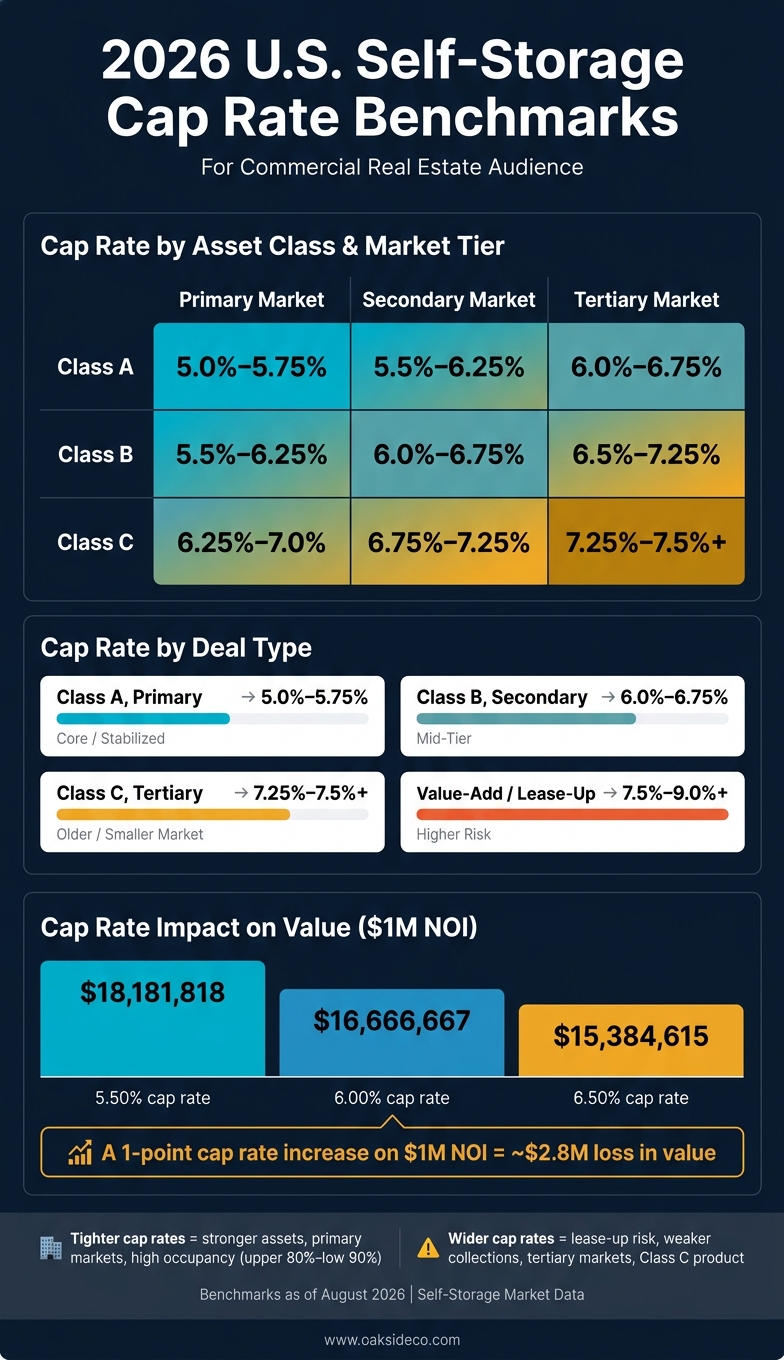
2026 U.S. Self-Storage Cap Rate Benchmarks by Market Tier & Asset Class
Think of 2026 cap rates as ranges, not fixed targets. Where a deal lands depends first on market tier, then on asset quality.
Cap Rate Benchmarks by Primary, Secondary, and Tertiary Markets
Primary markets usually trade at the tightest cap rates. Secondary markets tend to land in the middle. Tertiary markets usually trade at the widest levels.
Why the gap? In 2026, national operators and REITs are being more selective about tertiary-market exposure. That pulls demand away from some of those areas and keeps cap rates wider there. From that starting point, asset class can move pricing tighter or wider within each market tier.
Cap Rate Bands for Class A, B, and C Self-Storage Assets
Class A assets usually trade at the low end of the cap-rate band for their market. Class B assets tend to fall in the middle, between Class A and Class C. Class C assets are often older or need renovation, so buyers underwrite them at wider cap rates.
Then the deal gets more specific. Occupancy and revenue mix can shift a property toward the tight end or the wide end of the range.
2026 U.S. Self-Storage Cap Rate Benchmark Table
Use the table below as a quick benchmark by market tier and asset class.
| Asset Class | Primary Market | Secondary Market | Tertiary Market |
|---|---|---|---|
| Class A | 5.0%–5.75% | 5.5%–6.25% | 6.0%–6.75% |
| Class B | 5.5%–6.25% | 6.0%–6.75% | 6.5%–7.25% |
| Class C | 6.25%–7.0% | 6.75%–7.25% | 7.25%–7.5%+ |
Next, occupancy and revenue mix help determine whether a property trades near the tight end or the wide end of its range.
sbb-itb-09b4138
How Occupancy, Revenue Mix, and Risk Affect Cap Rates
Even in the same market and asset class, pricing doesn’t land in one neat spot. Occupancy quality, revenue mix, and execution risk often decide whether a deal trades near the low end of a benchmark band or drifts toward the high end. That’s why two properties that look similar on paper can still sell at different cap rates.
How Occupancy and Cash Flow Stability Influence Pricing
Physical occupancy tells you how many units are rented. Economic occupancy tells you what the property actually collects after concessions, bad debt, free rent, and delinquency.
That gap matters a lot. A property can show high physical occupancy and still underperform if collections are soft. In that case, buyers usually price it toward the wider end of the benchmark band. On the flip side, a property with slightly lower physical occupancy but strong collections can still trade tighter. To sort this out, buyers usually dig into 12–24 months of occupancy and delinquency data.
As a rule of thumb, sustained physical occupancy in the upper-80% to low-90% range, backed by strong economic occupancy, tends to support the low end of the cap rate band. Assets in lease-up – say, 60%–75% physical occupancy – or properties with shaky collections often trade toward or above the high end. In some cases, buyers won’t rely on a plain in-place cap rate at all. They may underwrite the deal using a pro forma lease-up valuation instead.
How Unit Mix and Revenue Management Shape Cap Rate Positioning
Unit mix can shift pricing more than people expect. Properties with a larger share of climate-controlled units often get tighter cap rates because those units usually command higher rents, show less seasonality, and appeal to a broader customer base that tends to stick around longer.
By contrast, assets weighted heavily toward non-climate drive-up units may need a somewhat wider cap rate unless occupancy and rate performance are unusually strong.
Boat and RV storage adds another wrinkle. In markets with limited new supply, enclosed or covered boat and RV spaces can support premium pricing. In more cyclical or tertiary markets, that same income stream may be viewed as less steady and harder to underwrite, which can push the asset toward the wider end of the band. When teams compare two assets in the same market with different unit mixes, they may apply a 25–75 basis point premium or discount within the benchmark range.
Revenue management can push things even further. A property with documented 4%–6% annual NOI growth, steady rent increases, strong autopay adoption, and little reliance on concessions can support pricing at the tight end of its market band. A property with uneven rate changes and heavy discounting just to hold occupancy will usually trade wider, because buyers put less weight on the staying power of that income.
Risk Premiums for Value-Add, Expansion, and Tertiary-Market Deals
Value-add, lease-up, and expansion deals are usually priced off stabilized or pro forma NOI, not trailing NOI. And they usually clear at wider going-in cap rates.
In 2026, value-add and lease-up deals were cited at 7.5% to 9.0%+ cap rates, compared with sub-6% pricing for stabilized core assets in similar markets. That spread has a direct effect on value. Here’s a simple example using a self-storage property generating $1,000,000 in annual NOI:
| Cap Rate | Implied Value | Difference vs. 5.50% |
|---|---|---|
| 5.50% | $18,181,818 | – |
| 6.00% | $16,666,667 | -$1,515,151 |
| 6.50% | $15,384,615 | -$2,797,203 |
That’s the kind of pricing gap buyers and sellers test in live underwriting and deal talks.
How Buyers and Sellers Use Cap Rate Benchmarks in Deals
How Buyers Test Asking Prices Against Benchmark Bands
Once occupancy and revenue mix set the range, buyers and sellers use benchmark bands to pressure-test the actual ask.
Buyers usually start with the benchmark band that fits the deal, then compare the asking price against occupancy, revenue mix, and cash flow stability. If the price points to a cap rate below the bottom of that band, most buyers see it as aggressive. That’s when they slow down and look closer before moving ahead. On the other side, sellers need to back up that pricing with stable operations and asset quality.
How Sellers Support Pricing at the Tight End of the Range
Sellers aiming for the tight end of the range need more than a good story. They need stable NOI, high occupancy, a favorable climate-controlled unit mix, and professional management.
Clean operating history helps. Organized reporting helps too. And properties with select facility upgrades can support higher rents and NOI.
How Oakside Co Connects Benchmark Data to Transaction Strategy
In deals that need sharper positioning, benchmark data does more than act as a pricing reference. It becomes part of the game plan.
Oakside connects benchmark ranges to pricing, underwriting, and disposition strategy for self-storage and boat & RV assets. For 2026 dispositions, Oakside uses benchmark data and asset-level analysis to support pricing and sale strategy.
Conclusion: Key 2026 Cap Rate Benchmark Takeaways
In 2026, U.S. self-storage cap rates usually land between 5.0% and 7.5%+. Class C assets, value-add deals, and facilities in tertiary markets tend to sit near 7.5% or higher. That range exists for a simple reason: risk changes from deal to deal. So the benchmark band is a starting point, not a final answer.
In the real world, buyers don’t stop at the headline number. They test the asking price against how the property is performing right now. Benchmarks help start underwriting, but occupancy, revenue mix, and risk drive the cap rate that makes sense. A well-occupied facility with a strong mix of income and steady ancillary revenue will usually trade closer to the low end. A property with weaker occupancy or more value-add risk should trade at a higher cap rate.
For buyers, the practical move is simple: find the right benchmark band first, then compare the asking price to current operating reality. If the implied cap rate comes in below the bottom of that band, that’s a sign to slow down and dig deeper before moving ahead. For sellers, getting to the tight end of the range means backing up the story with strong occupancy, stable cash flow, and a revenue mix that can stand up to scrutiny. Skip the fundamentals, and the deal gets shaky fast.
Use the market-tier and asset-class band first, then adjust for occupancy, revenue mix, and risk.
FAQs
How do I know which market tier a facility fits into?
Look past national averages and judge market tier based on your local trade area, the quality of the asset, and the competitive set around it. In most cases, primary markets are major metro areas with institutional-quality properties. Secondary and tertiary markets tend to be smaller cities or rural areas, where demand drivers and risk can look very different.
For the local review, study a 1- to 3-mile radius in urban areas or a 5-mile radius in suburban or rural areas. Then compare 5 to 10 recent comparable sales using trailing-12-month NOI and sale price. You’ll also want to look at supply, demand, and barriers to entry.
When should I use in-place NOI vs. pro forma NOI?
Use in-place NOI first, based on the trailing 12 months, to ground valuation in proven property performance and current market conditions. Buyers usually lean on it more than projections.
Use pro forma NOI to test future scenarios. Build it with monthly assumptions so it reflects seasonality and lease-up pace, then stress-test rent growth, exit cap rates, and expenses.
What can move a self-storage deal outside the typical cap rate range?
Several things can push a self-storage deal outside the usual cap rate range. The big ones are market location, property quality, and overall demand. If the asset includes boat and RV storage, pricing may also shift based on site depth, coverage type, and infrastructure.
Operations matter just as much. Properties with occupancy gaps, weak expense control, or lease-up risk often trade at higher cap rates because buyers need to price in that added risk.