Here’s the short answer: storage cap rates in 2026 look flat, not lower. If I own, buy, or sell a storage asset today, I’d price deals around today’s range instead of waiting for another drop in cap rates.
I see three clear takeaways from the market:
- Self-storage is holding near a plateau, with many stabilized deals around 5.5% to 5.9%
- Self-storage vs RV storage investment returns show that boat/RV storage still trades above self-storage, often by 50 to 150 basis points
- Top assets get the best pricing, while lease-up, small, rural, and older properties trade at higher cap rates
- Debt is still tight, with many stabilized loans around 6.0% to 7.0%
- Buyers are focused on cash flow and risk, not old peak-cycle pricing
If I boil the article down even more, it says this: 2026 is a pricing discipline year. Buyers still want storage, but they are paying close attention to income stability, location, asset quality, and supply risk.
Quick comparison
| Asset type | Typical 2026 range | What drives pricing |
|---|---|---|
| Self-storage Class A | 5.0%–6.25% | Primary vs. secondary market, climate control, occupancy, NOI track record |
| Self-storage Class B/C | 5.75%–9.0%+ | Age, layout, market depth, upkeep, lease-up risk |
| Boat/RV storage Class A | 5.5%–7.25% | Paving, cover/enclosure, security, market demand |
| Boat/RV storage Class B/C | 6.5%–10.0%+ | Rural location, finish level, management, tenant depth |
So if you want the plain-English view, this market is no longer about betting on falling cap rates. It is about deciding whether a deal’s current income and risk profile justify the price.
2026 Cap Rate Baseline for Self-Storage and Boat/RV Assets
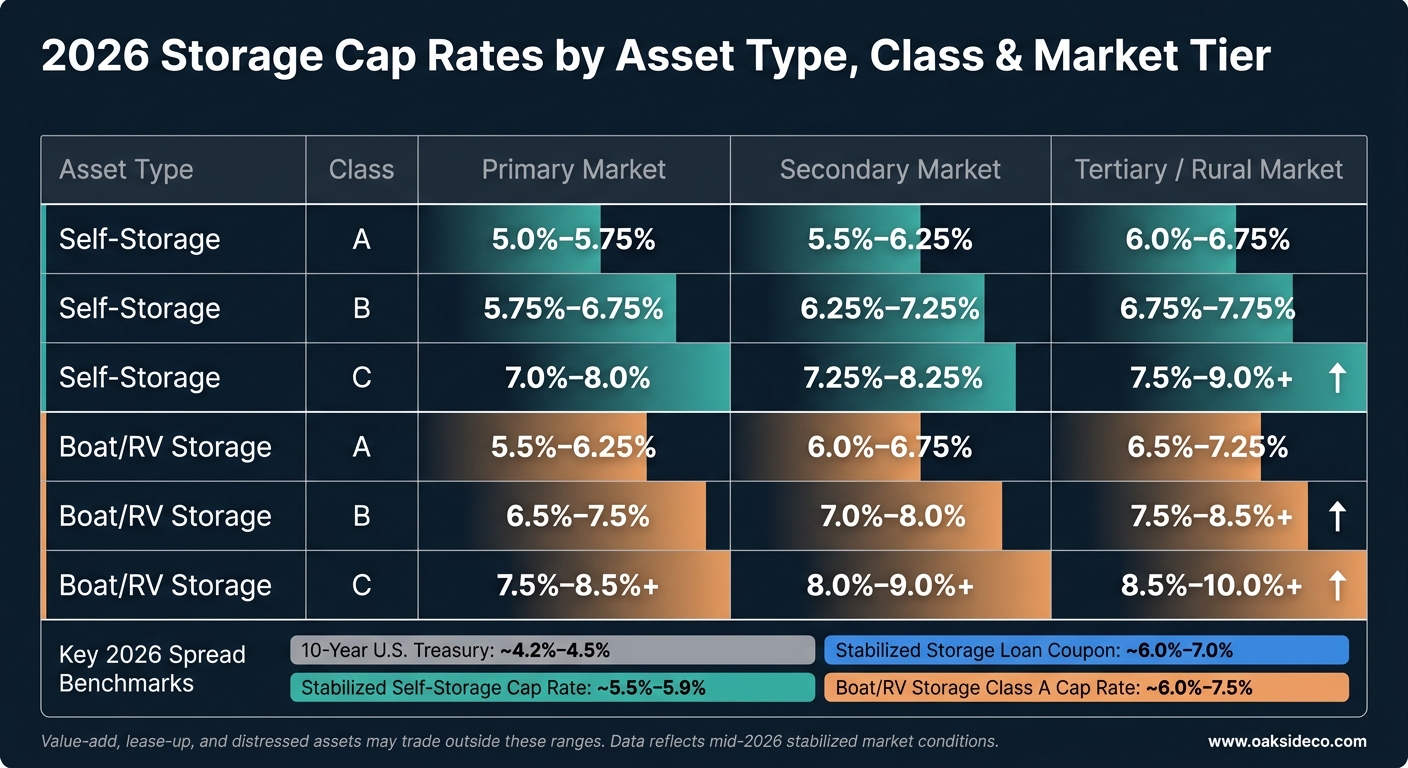
2026 Storage Cap Rates by Asset Type, Class & Market Tier
Self-Storage Cap Rate Ranges by Class and Market Tier
In 2026, self-storage pricing looks more like a post-repricing reset than the start of another compression phase. Institutional-grade self-storage has settled into the high-5% to low-6% band after cap rates expanded by about 160 basis points, moving from roughly 4.3% in Q1 2022 to about 5.8%–6.2% by late 2024 and 2025.
Class A facilities in primary markets usually trade around 5.0%–5.5%. Similar assets in secondary markets tend to land at 5.5%–6.25%.
Class B deals trade at wider yields. In primary and stronger secondary markets, they usually fall between 5.75% and 6.75%, while tertiary markets and weaker secondaries often come in around 6.75%–7.5%+, especially when a property lacks climate control or has an older layout. Class C and older value-add properties usually trade at 7.5%–8.5%+. Some lease-up or distressed deals go out even wider because execution risk and capital needs weigh on pricing.
Boat/RV Storage Cap Rates and the Narrowing Gap to Self-Storage
Boat/RV cap rates still sit above self-storage, but the spread has tightened at the top end. By mid-2026, Class A boat/RV facilities with paved, covered, or fully enclosed spaces, modern security systems, and professional management often trade only 50–100 basis points above similar Class A self-storage assets. In some Sun Belt and recreation-focused growth markets, stabilized Class A boat/RV properties are trading in the mid-5% to low-6% range, versus the low-5% range for top-tier self-storage. At the same time, less polished or rural boat/RV properties still clear in the 7%–9%+ range. That tighter top-end spread comes from better lender comfort, stronger operating data, and higher household RV ownership supporting long-run demand.
These stabilized ranges set the baseline for the spread analysis in the next section.
2026 Cap Rate Ranges by Asset Type, Class, and Market
| Asset Type | Class | Primary Market | Secondary Market | Tertiary/Rural Market |
|---|---|---|---|---|
| Self-Storage | A | 5.0%–5.75% | 5.5%–6.25% | 6.0%–6.75% |
| Self-Storage | B | 5.75%–6.75% | 6.25%–7.25% | 6.75%–7.75% |
| Self-Storage | C | 7.0%–8.0% | 7.25%–8.25% | 7.5%–9.0%+ |
| Boat/RV Storage | A | 5.5%–6.25% | 6.0%–6.75% | 6.5%–7.25% |
| Boat/RV Storage | B | 6.5%–7.5% | 7.0%–8.0% | 7.5%–8.5%+ |
| Boat/RV Storage | C | 7.5%–8.5%+ | 8.0%–9.0%+ | 8.5%–10.0%+ |
Value-add, lease-up, and distressed assets sit outside these ranges. Buyers usually underwrite those deals to stabilized yield, not in-place NOI, so the headline cap rate can make pricing look richer or cheaper than it is. In plain English, the sticker price doesn’t tell the whole story.
That puts the focus on three things: asset quality, market tier, and execution risk.
From here, financing costs and Treasury yields help explain why these pricing bands have stayed in place.
sbb-itb-09b4138
Pricing, Spreads, and Capital Markets in 2026
How Cap Rates Moved from Repricing to Stabilization
The big story here is the 2022–2024 reset, not where cap rates sit today. Cap rates moved up fast during that stretch, then mostly leveled off in 2025–2026 as buyers and sellers got closer on value. In plain English: the market took its hit, adjusted, and then found a tighter pricing range.
That reset is now showing up in stricter pricing and narrower bid-ask gaps. A survey of more than 40 industry experts found that 56% expected self-storage cap rates to remain largely unchanged through mid-2026, which points to a "new normal" instead of another leg up in cap rates.
Treasury Yields, Debt Costs, and Spread Behavior in 2026
The 10-year U.S. Treasury has stayed choppy, but it has mostly traded between 3.9% and 4.8%, ending 2025 near 4.2%–4.3% and staying above 4% into 2026. That range sets the tone for buyer return targets. It also helps explain why debt pricing has stayed firm even with cap rates flattening out.
Borrowing costs for stabilized self-storage have eased from their 2023 highs, but they’re still elevated. Fixed-rate loans on stabilized assets are usually landing in the 6%–7% range in 2025–2026, depending on leverage, sponsorship, and asset quality.
On thinner deals, loan coupons are often close to cap rates – or even above them. That’s why lenders and buyers are watching debt yield (NOI ÷ loan amount) and DSCR so closely. Underwriting often calls for 8%–10%+ debt yields and 1.35x–1.50x+ DSCR.
When the spread between cap rates and debt costs gets this tight, there isn’t much room for error. A small shift in income, expense load, or financing terms can change the math fast. As a result, many buyers are keeping LTV in check and leaning more on unlevered IRR when financing doesn’t give them much cushion. Stabilized assets in strong locations still trade at tighter cap rates because they offer more protection in this setup.
Storage Cap Rates vs. Key Spread Benchmarks
The table below shows where 2026 storage cap rates sit next to the 10-year Treasury and typical loan coupons, with the focus on spread pressure rather than pure pricing.
| Benchmark | Approximate Rate / Cap Rate |
|---|---|
| 10-Year U.S. Treasury | ~4.2%–4.5% |
| Typical stabilized storage loan coupon | ~6.0%–7.0% |
| Stabilized self-storage cap rate | ~5.5%–5.9% |
| Boat/RV Storage Class A | ~6.0%–7.5% |
| Boat/RV Storage Class B | ~7.5%–8.5% |
| Office | ~7.2% |
That narrow spread leaves less room for mistakes, which puts more weight on asset quality and tight underwriting. It also helps explain why some storage deals still attract stronger investor demand and lower cap rates than others.
Investor Demand and the Asset Traits That Move Cap Rates
Where Investor Demand Is Strongest in 2026
With cap rates staying flat, buyers in 2026 are leaning toward assets that do the best job of protecting income. Demand is still active, but it’s picky. The strongest interest is going to stabilized Class A and B assets in major metros and solid secondary markets, where steady occupancy and skilled management help lower underwriting risk.
Value-add and lease-up deals are still getting done, but buyers want more yield to make up for the extra uncertainty. In secondary markets with solid demographics and limited new supply, cap rates usually trade at a 75–100 bps premium to primary markets. Tertiary markets add another 100–150 bps, since buyers want added yield to offset softer demand and supply risk. Stabilized Class A Boat/RV storage is also getting attention, with cap rates only a bit above similar self-storage assets.
Asset Traits That Compress Cap Rates
Some traits keep pulling cap rates lower because buyers and lenders see them as lower-risk. Class A physical quality sits at the top of that list. Modern construction, climate-controlled units, and well-kept infrastructure all point to lower capex risk down the road.
But the building itself is only part of the story. Buyers also care a lot about income stability. Properties with steady economic occupancy above 85%–90%, durable trailing NOI, and a clear rent growth track record tend to get the tightest pricing. High barriers to entry matter too. Zoning limits, infill locations, and scarce land help shield a property from future supply pressure. And when several qualified bidders show up, that competition can tighten pricing even more.
Asset Traits That Widen Cap Rates
On the flip side, some traits push cap rates up in a pretty direct way. Tertiary or rural locations tend to widen pricing because the trade areas are thinner. That usually means fewer tenants, less pricing power, and a smaller buyer pool when it’s time to sell. Small facilities also trade at wider cap rates, in part because many institutional buyers have minimum size rules.
Operations can weigh on pricing just as much as location. Deferred maintenance, uneven occupancy trends, weak revenue management, and dated design all signal that a buyer may need to put more money into the asset before it performs the way it should. Nearby competing projects under construction also widen cap rates by adding occupancy and rent risk.
| Trait | Cap Rate Direction | Typical Impact |
|---|---|---|
| Class A, climate-controlled, modern construction | Compresses | Strongest pricing signal |
| Stable occupancy and durable trailing NOI | Compresses | Core underwriting metric |
| High barriers to entry / infill location | Compresses | Supply protection |
| Tertiary or rural location | Widens | 100–150 bps vs. secondary |
| Small facility | Widens | Limits buyer pool |
| Deferred maintenance | Widens | Raises capital expenditure risk |
| Heavy nearby new supply | Widens | Occupancy and rent risk |
| Uneven or declining occupancy | Widens | Underwriting uncertainty |
These differences in demand now play a direct role in how buyers price and underwrite deals in 2026.
What 2026 Cap Rate Trends Mean for Pricing Strategy
How Owners and Buyers Can Use Current Cap Rate Ranges
Those stabilized ranges now set the pricing floor for 2026 deals. For owners, that means anchoring expectations to today’s stabilized cap-rate ranges. For buyers, it means pricing to current spread norms instead of peak-cycle pricing.
The better way to look at a deal is pretty simple: compare in-place yield, refinance proceeds, and sale value after debt service, execution risk, and rate risk. That pushes the conversation away from hoping for cap-rate compression and toward something much more grounded – cash-flow durability.
Buyers should anchor underwriting to current 10-year U.S. Treasury spread targets: roughly 250–350 bps over the 10-year U.S. Treasury for stabilized self-storage and 350–450+ bps for boat/RV. Then test whether the offered cap rate actually matches the asset’s staying power and exit liquidity. Lower cap rates make the most sense when occupancy is steady, supply risk is low, and the location has institutional-quality traits. Weaker assets need a wider cap rate cushion to offset added uncertainty.
Where Specialized Advisory Analysis Adds Value
When a deal lands near the edge of the range, property-specific analysis can make or break pricing. Oakside Co turns comps, local supply risk, and exit strategy into pricing logic that owners and buyers can defend for self-storage and boat/RV assets.
Key Takeaways from the 2026 Market Summary
Pricing is more disciplined now. Tighter spreads leave little room for aggressive bidding unless market tier, asset quality, supply pressure, and operating performance clearly back it up.
Investor demand is strongest for Class A, supply-constrained, operationally sound assets in primary and solid secondary markets. Cap-rate dispersion is still being driven by those same fundamentals, not by broad sector enthusiasm. In 2026, pricing favors durable income, infill locations, and limited new supply. Owners and buyers who price from those facts – instead of cycle memory – stand in a much better spot to execute.
FAQs
Why aren’t storage cap rates falling in 2026?
Storage cap rates aren’t dropping in 2026 because the market is no longer living in the ultra-low-rate world of 2021 and 2022. With the 10-year Treasury sitting around 4.63% to 4.72%, buyers still want a bigger spread over that benchmark. That puts a lid on cap-rate compression.
There’s also pressure from the property side of the deal. Higher insurance costs, higher property taxes, and slower rent growth have tightened margins and pushed pricing expectations back to earth. On top of that, investors are underwriting with more caution and asking for higher yields to take on risks like lease-up, local oversupply, and entitlement friction.
How should I price a lease-up or value-add storage deal?
Don’t price a lease-up or value-add storage deal on trailing NOI alone. In 2026, use a pro forma that estimates stabilized NOI with monthly assumptions for seasonality and the pace of lease-up. These assets usually trade at wider going-in cap rates, often 7.5% to 9.0% or higher.
Then compare those assumptions with local benchmarks and adjust for occupancy, revenue mix, and risk. It’s a bit like stress-testing a bridge before traffic hits it. If the numbers only work in a best-case setup, that’s a red flag. Pressure-test exit cap rates, rent growth, and lease-up timing, and run sensitivity analysis to make sure the deal still works under conservative scenarios.
What asset traits get the lowest storage cap rates?
Assets with the lowest cap rates – usually 4.5% to 5.75% – are most often Class A properties in primary markets. These sites usually post high physical and economic occupancy, often in the upper-80% to low-90% range, with steady collections that hold up well over time.
Lower cap rates also tend to go to facilities that show consistent annual NOI growth, strong autopay adoption, a healthy mix of high-margin climate-controlled units, and locations near dense residential areas where new supply is limited.