
A boat and RV storage site is usually worth what its NOI can support – then checked against comps, land, and build cost.
If I were sizing up one of these properties, I’d start with four things right away:
- Collected income, not just listed rent
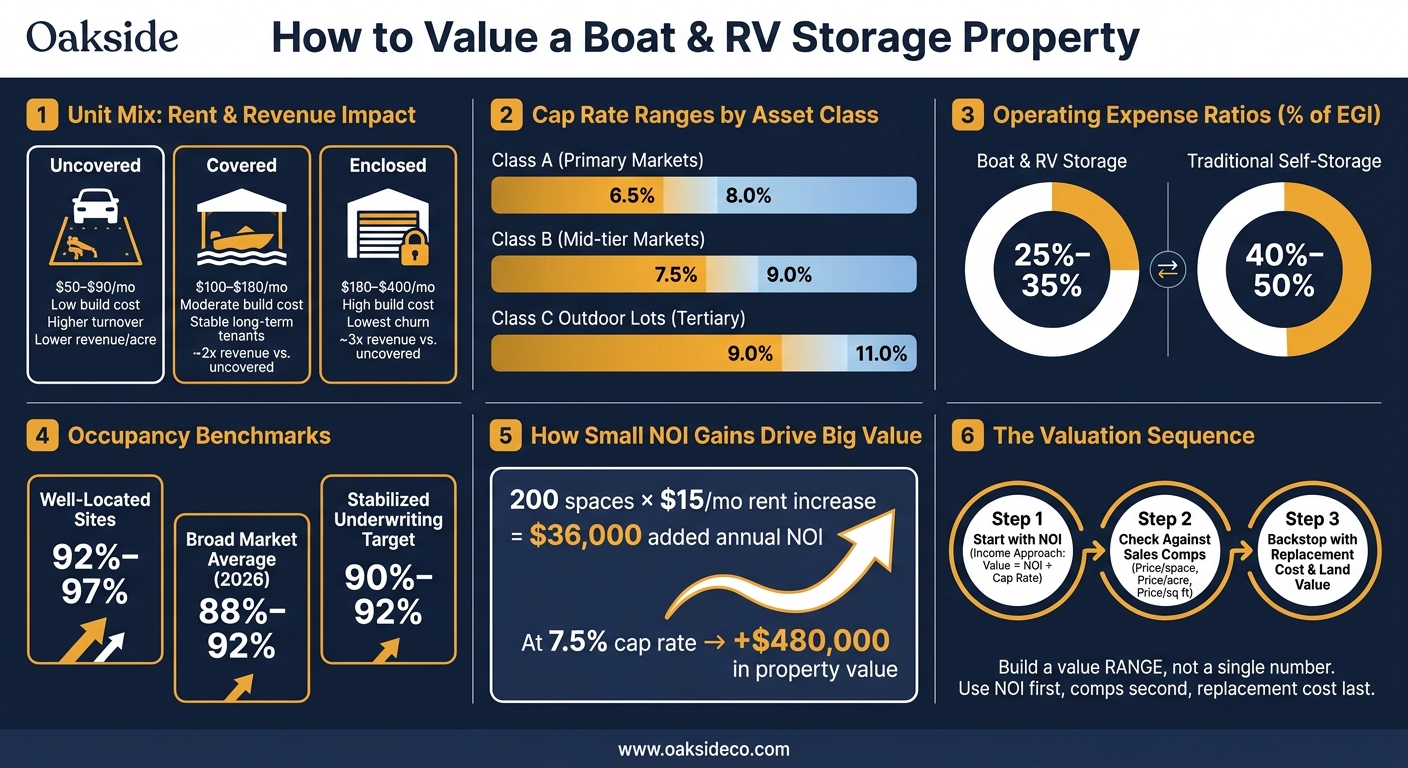
- Stabilized occupancy, often around 90% to 92%
- Expense load, often about 25% to 35% of EGI for many boat and RV storage sites
- Cap rate, often around 7% to 10%, depending on asset type and market
Here’s the short version: if income is shaky, value is shaky. If expenses are off, NOI is off. And if unit mix leans toward covered or enclosed spaces, the site may support more income than an uncovered lot.
A few numbers from the article stand out:
- Well-located sites often run at 92% to 97% occupancy
- Broader 2026 occupancy is closer to 88% to 92%
- Class A assets may trade near 6.5% to 8%
- Older outdoor lots may land closer to 9% to 11%
- A $36,000 bump in annual NOI at a 7.5% cap rate can add about $480,000 in value
I’d also keep one thing in mind: acreage alone does not tell me much. What matters more is how that land turns into rent, how steady the tenants are, and whether there’s room to add more paying spaces.
Boat & RV Storage Property Valuation: Key Metrics at a Glance
Quick take
To price a boat and RV storage property, I’d look at:
- Rent roll vs. bank deposits
- Physical occupancy vs. economic occupancy
- Street rents vs. in-place rents
- Uncovered, covered, and enclosed unit mix
- Normalized expenses and post-sale tax load
- Cap-rate value, comp sales, and replacement-cost check
- Expansion room and zoning limits
sbb-itb-09b4138
Quick comparison
| Item | What I’d look for | Why it matters |
|---|---|---|
| Income | Collected rent, other income, bad debt | This drives NOI |
| Occupancy | 90% to 92% stabilized target | Helps test whether income will hold |
| Unit mix | Uncovered vs. covered vs. enclosed | Changes rent levels and churn |
| Expenses | 25% to 35% of EGI for many sites | Changes cash flow fast |
| Cap rate | Often 7% to 10% | Turns NOI into value |
| Comps | Price per space, acre, and sq. ft. | Checks the NOI result |
| Land / build cost | Site value and replacement cost | Backstop if comp data is thin |
| Upside | Rent bumps, site work, added covered space | May push NOI higher |
Bottom line: I’d build a range, not one fixed number. The cleanest way is to start with NOI, test it with comps, and then use land and build cost as a backstop.
Analyze Revenue, Occupancy, and Unit Mix
Value starts with collected income, not acreage. Revenue patterns shape occupancy, rent stability, and, in the end, value. Start with collected rent. Then pressure-test occupancy, unit mix, and demand.
Measure In-Place Revenue and Economic Occupancy
Physical occupancy tells you how many spaces are filled. Economic occupancy shows how much rent is actually collected compared with scheduled gross rent before vacancy, concessions, and bad debt. That gap matters. A facility can look full on paper and still lag if collections are soft or discounts are eating into income.
Annualize the rent roll and reconcile it to bank deposits. Reconcile the rent roll to bank deposits before underwriting revenue.
The order here is simple: collections → economic occupancy → tenant concentration → stabilized occupancy benchmark. Tenant concentration adds risk too. If one customer makes up more than 3% of total revenue, that’s a red flag.
Well-located facilities often hold occupancy between 92% and 97%, while the broader market average in 2026 is closer to 88% to 92%. Stabilized valuation models usually underwrite to 90% to 92%.
Once occupancy checks out, unit mix becomes the next big lever. That’s what determines how much revenue each acre can produce.
Compare Uncovered, Covered, and Enclosed Spaces
Unit mix has a direct effect on earnings per acre and on how steady that income tends to be. The three main storage types vary a lot in rent, construction cost, and tenant behavior.
| Storage Type | Typical Monthly Rent (USD) | Build Cost | Occupancy Profile | Revenue Impact |
|---|---|---|---|---|
| Uncovered | $50–$90 | Low | Higher turnover; more price-sensitive | Lower revenue per acre; high land efficiency |
| Covered | $100–$180 | Moderate | Stable; long-term tenants | About 2x revenue vs. uncovered; protects from sun and hail |
| Enclosed | $180–$400 | High | Premium; lowest churn | About 3x revenue vs. uncovered; often includes power/trickle charging |
A property with more covered or enclosed units usually trades at a lower cap rate. For example, Class A covered assets often trade around 6.5% to 8%, while older outdoor lots tend to land closer to 9% to 11%. Why? The income tends to last longer, and the tenant base is often stronger.
After that, the key question is pretty straightforward: does local demand support those rent levels?
Assess Local Demand and Seasonality
Location does most of the heavy lifting. A useful first screen is RV ownership density within a 10-mile radius, using county tax records and state registration data, along with distance to a metro area with 100,000+ residents. Nearby lakes, marinas, national parks, and coastal routes can also support demand. HOA rules that limit residential parking in nearby subdivisions can help too.
Seasonality changes how you read the data. In Sun Belt markets like Texas, Florida, and California – which together account for over 20% of all RV shipments – demand often runs year-round. That makes occupancy and revenue easier to underwrite. Even so, separate recurring monthly rent from seasonal storage income before annualizing revenue.
One of the best field checks is to compare street rates – what new tenants are quoted today – against in-place rents – what current tenants are paying. If in-place rents are below street rates, there may be room for revenue growth. If in-place rents are above street rates, current income may slip after turnover.
Another strong signal is a verified waitlist with documented conversion rates and deposit history. That shows local demand is real, not just talk, and it gives more support for rent growth assumptions.
Next, translate this revenue into NOI by normalizing operating expenses.
Calculate Operating Expenses and Net Operating Income
Revenue tells you what comes in. NOI tells you what the property can support. The gap between those two numbers is operating expenses, which is why expense normalization matters so much before you underwrite a deal.
Normalize Expenses to Reflect Real Operating Performance
For boat and RV storage, the standard expense buckets are pretty consistent: real estate taxes, property insurance, utilities, repairs and maintenance, management fees, payroll and benefits, and advertising and marketing. Debt service and non-recurring capital expenditures do not belong in NOI, although reserves should still be modeled on their own.
This is often where a seller’s asking price either stands up or falls apart.
Owner-operated properties can muddy the numbers. Some owners run personal costs through the business. Others pay below-market wages for on-site help. Some absorb one-time hits like storm damage or legal bills. Underwriting should strip those items out so the numbers show how the property performs under normal ownership.
Management is a common example. If the owner handles the site and doesn’t pay themselves a salary, you still need to underwrite a 5% to 6% management fee. Property taxes are another big one. After a sale, taxes may reset, so your underwriting should reflect the post-sale reassessment, not the current owner’s bill.
A clean add-back schedule helps here. It should separate:
- Personal expenses
- One-time costs
- Items that won’t carry forward after closing
Those adjustments give you the stabilized expense base used for valuation.
Build NOI from Effective Gross Income
Once expenses are normalized, NOI is built in a pretty simple way:
Gross Potential Rent (GPR) − vacancy and credit loss + other income = Effective Gross Income (EGI)
EGI − total operating expenses = Net Operating Income (NOI)
A 2024 case study reported $3.41 per square foot of NOI at 97% occupancy.
Compare Lean and Full-Service Operating Models
Expense ratios change based on staffing, paving, security, and amenities. Dedicated RV and boat storage properties usually run expense ratios of 25% to 35% of EGI, while traditional self-storage is more often in the 40% to 50% range.
| Feature | Lean (Class C/Outdoor) | Mid-Range (Class B) | Full-Service (Class A) |
|---|---|---|---|
| Staffing | Unmanned or remote | Part-time or kiosk | Full-time on-site |
| Amenities | Basic fencing and gate | Paved, lighting, dump station | Enclosed, trickle charging, wash bay, solar |
| Expense Ratio (% of EGI) | 20%–25% | 25%–35% | 35%–40%+ |
| NOI Impact | Low overhead; higher turnover risk | Balanced margin and stability | Higher fixed costs; premium positioning |
Sources:
That range matters because a lean outdoor site and a full-service Class A property can look similar at a glance, yet operate very differently. If you know where the asset sits on that spectrum, your NOI is much easier to defend. With NOI in place, the next step is figuring out what that income stream is worth through cap rate, comps, and replacement cost.
Apply the Main Valuation Methods
Use NOI as your starting point, then check that number against sales comps and replacement cost. That sequence matters. These methods turn stabilized income into a market value estimate, and the income approach should come first, comps should come second, and replacement cost should come last.
Start with Cap Rate and NOI-Based Valuation
Start with the income approach. The formula is straightforward: Value = NOI ÷ Cap Rate.
RV and boat storage facilities usually trade in the 7% to 10% cap rate range, with asset class and location doing most of the heavy lifting on where a deal lands. Class A facilities in primary markets often trade around 6.5% to 8.0%. Class B assets tend to fall around 7.5% to 9.0%. Class C outdoor lots in tertiary markets often land around 9.0% to 11.0%.
Why the spread? Buyers will pay more for assets with strong occupancy, better security, and a stronger mix of covered or enclosed spaces. They mark down properties with deferred maintenance, limited security, too much uncovered parking, or softer local demand.
And small cap-rate shifts can change value in a hurry. At a 6.0% cap rate, $500,000 of NOI supports $8.33 million in value. At 7.0%, that same NOI supports $7.14 million.
That’s why NOI-based valuation gives you the first read, not the final word. Once you have that number, check it against recent sales of similar properties.
Use Sales Comparables and Price-Per-Space Checks
Sales comps act as a reality check for the income-based value. The most useful measures here are price per space, price per acre, and price per square foot.
The hard part is getting an apples-to-apples comparison. Open lot spaces, covered canopy spaces, and fully enclosed units do not rent for the same rates, and they do not cost the same to build or maintain. So before you lean on a comparable sale, adjust for:
- Unit mix
- Occupancy at the time of sale
- Age and condition of paving and structures
- Security package
- Whether the sale included expansion land
- Seasonal timing
That last point gets missed more than it should. A sale that closed during a stronger seasonal window can paint a very different picture than one that traded during a weaker stretch.
Occupancy matters just as much. A facility that sold at 75% occupancy should not be valued the same way as a stabilized asset at 95% occupancy.
If the sales data is thin – and in this niche, it often is – use replacement cost and land value as backstop checks.
Use Replacement Cost and Land Value as Supporting Checks
Replacement cost and land value should support the analysis, not lead it. Replacement cost looks at what it would cost to build the facility today across five main buckets: land, site work, structures, systems, and soft costs like permits and engineering .
Land value becomes more important when the site has another path that may be worth more than the storage use. That can happen when the parcel has development optionality for multifamily, hospitality, or mixed-use projects .
For under-improved or distressed properties, land value works more like a floor than a separate way to value the deal.
Put together, these methods help you frame a defensible value range. Once that base case is in place, the next step is to see whether expansion or repositioning can push that value higher.
Account for Expansion Potential and Build a Value Range
Measure Expansion and Value-Add Upside
After you check income and comps, the next step is simple: see whether extra land or a site rework can push NOI higher.
Extra land only matters if it can turn into income. So before you assign any price to that land, confirm zoning and entitlements. You also need to know whether the planned use is allowed by right or only as a conditional use. If getting approval is a long shot, that land does not add much to today’s value.
When expansion does make sense, covered and enclosed space often stands out. Why? Because those spaces can produce much more NOI per square foot. The clean way to test this is to model each option on its own, then compare the added cost against stabilized NOI. Most buyers will still discount that upside until the project is fully entitled and the costs are nailed down.
Site fit matters just as much as demand. Larger vehicles usually need about 55-foot drive aisles, and canopies need 14 to 16 feet of clearance. If the property cannot handle those dimensions, the return on expansion can drop in a hurry.
Prioritize Improvements That Increase Value Before a Sale
If expansion is off the table, or only partly possible, focus on the fastest NOI gains inside the current footprint.
In many cases, the best moves are not flashy. They are operational. Bring below-market rents up, tighten the rent roll, and clean up the numbers. Every extra dollar of NOI flows into value through the cap rate. For example, if 200 spaces each go up by $15 per month, annual NOI increases by $36,000. At a 7.5% cap rate, that adds about $480,000 in value.
Clean financials matter more than many owners think. Keeping three years of reconciled rent rolls and profit-and-loss statements cuts down buyer friction and helps support a stronger price. It also makes sense to fix deferred maintenance – like gate systems, pavement, or fencing – when the repair cost is lower than the discount a buyer is likely to demand.
| Value-Add Project | Typical Cost Basis | Expected NOI Impact | Execution Risk |
|---|---|---|---|
| Rent Increases to Market | Low (Administrative) | High (Immediate lift) | Low |
| Financial Reporting Cleanup | Low | High (Supports buyer confidence) | Low |
| Security Upgrades (Cameras/Gates) | Moderate | Moderate (Retention and rate support) | Low |
| Adding Covered Canopies | High | Very High (2x–3x rent per sq. ft.) | Moderate (Zoning/Permits) |
| Enclosed Unit Conversions | Very High | Highest per-unit rates ($180–$400/mo.) | Moderate |
Conclusion: Build a Defendable Valuation Range
The right answer is usually a range, not one neat number.
Use the full stack – NOI, comps, replacement cost, and expansion math – to build a price range you can back up. For lease-up assets or properties with major expansion room, replacement cost can act as a floor so current NOI does not make stabilized value look too low .
That range serves a different job for each party. Sellers can use it to support an asking price. Buyers can use it to pressure-test downside risk. Owners can use it to see which operational or physical changes are most likely to move the number before the property goes to market.
FAQs
What cap rate should I use?
For boat and RV storage, cap rates usually fall between 5.75% and 11%, based on the asset class and the market.
Here’s the usual range:
- Class A stabilized properties in primary markets: 5.75% to 8%
- Class B properties: 7.5% to 9%
- Class C or distressed assets: 9% to 11%
In secondary and tertiary markets, expect cap rates to be about 100 to 200 basis points higher.
That gap may look small on paper, but it can have a big effect on value. A shift of even a little can change pricing in a meaningful way, so the cap rate should line up with the property’s condition, location, and operating stability.
How do I verify real income?
To verify income for a boat and RV storage property, don’t stop at the top-line numbers. Normalize the financials so they show steady, year-round performance.
Look at at least three years of:
- Rent rolls
- Occupancy history
- Profit-and-loss statements
Then compare actual collected revenue with potential income. From there, account for seasonal deposits and prepaid fees, and separate one-time items or owner-related expenses.
Does expansion land add value?
Yes. Expansion land can add a lot of value to a boat and RV storage property, especially if it gives the next owner room to build more covered parking or enclosed units.
If you’re selling, this point matters. It shows buyers there’s still room to grow revenue over time, not just from the current layout, but from making better use of the site and adding more income-producing structures.