
If you track a self-storage portfolio with only averages, you can miss underperforming sites. I’d split the job into three parts: a PMS for site data, an analytics layer for rollups, and an advisory layer for buy, hold, refinance, or sell decisions.
Here’s the short version:
- Oakside Co: best when I need help turning portfolio data into transaction or disposition decisions
- Yardi Storage Manager: best for day-to-day site data, accounting, collections, and portfolio rollups
- Storable Portfolio Analytics: best for live dashboards, marketing tracking, and pricing views
- Monument: best for benchmarking rates and occupancy across sites
- Real Clear Software: best for portfolio finance views like NOI, expense ratios, and cash flow
The article’s main point is simple: no single tool covers every reporting job well. That matters because self-storage KPIs can shift a lot by site, and broad averages can hide weak occupancy, rent gaps, or delinquency issues. With some platforms tracking 70,000+ facilities and some datasets covering $50 billion+ in CMBS-backed assets, the issue usually isn’t lack of data. It’s choosing the right setup for the decision in front of you.
Quick Comparison
| Tool | Best for | What I’d use it for |
|---|---|---|
| Oakside Co | Advisory review | Hold/sell calls, capital planning, dispositions |
| Yardi Storage Manager | PMS and reporting | Site-level tracking, accounting, collections, rollups |
| Storable Portfolio Analytics | KPI dashboards | Occupancy, revenue, campaign tracking, pricing data |
| Monument | Rate benchmarking | Comparing street rates, web rates, and occupancy by site |
| Real Clear Software | Finance rollups | NOI, cash flow, expense comparison across facilities |
If I were building a reporting stack, I’d start with the KPI list first, then match each tool to the reporting job it handles.
sbb-itb-09b4138
What U.S. Investors Need From Portfolio Tracking Tools
For multi-site self-storage and boat/RV portfolios, the right setup has three layers: operations, analytics, and advisory review. The smart move is to start with the metrics and then pick the tool based on the reporting job. That makes KPI definition the first step when building a tracking stack.
Core Portfolio KPIs to Track
Track physical occupancy and economic occupancy separately. Also watch actual rent collected vs. street rate, NOI margins, same-store revenue and expense trends, lease-up speed, delinquency rates, and budget vs. actual variance.
That facility-level view matters. If you only look at portfolio averages, weak sites can hide behind strong ones. And that can give you the wrong read on performance.
| Core KPI | What It Tells You |
|---|---|
| Physical/Economic Occupancy | How full the units are versus how much revenue is actually collected |
| Actual Rent Collected vs. Street Rate | Actual tenant payments versus street rates, which helps reveal loss to lease gaps |
| NOI Margin | Net Operating Income as a percentage of revenue |
| Same-Store Trends | Revenue and expense trends for assets held over 12 months |
| Lease-Up Speed | How quickly vacant units fill in newer or repositioned facilities |
| Delinquency Rate | Early signal of collection issues before they affect NOI |
| Budget vs. Actual Variance | Flags where assumptions are off and where to adjust |
Operational Tools vs. Analytics Tools vs. Advisory Review
These three categories do different jobs, and serious investors usually need all three working together.
Operational tools – like property management systems – run the day-to-day work: unit assignments, lease tracking, payment processing, and delinquency flags. They serve as the system of record for what’s happening at each facility right now.
Analytics tools sit on top of that data. They help you spot trends, compare markets, and stack one facility’s results against another. This is where you answer questions like: Are my occupancies keeping up with the market? Where are rents trailing?
Advisory review plays a different role. It helps turn raw numbers into investment decisions, whether that means timing a sale or working through a hold-sell case.
If you lean on only one layer, you’ll miss something. Operational data without market context can miss demand shifts. Market data without advisory review can leave you stuck in analysis paralysis. That’s why the five-tool comparison below is useful.
Reporting Standards for Multi-Site Portfolios
Consistency is what makes multi-site reporting worth anything. When every facility uses different formats or expense categories, comparing markets turns into a spreadsheet mess. Standardize KPI definitions, date formats, and variance logic across every site.
Monthly and quarterly reporting packs should use the same structure each period – same KPIs, same layout, same benchmarks. That way, stakeholders can spot changes fast without having to relearn the report every time. Platforms that map live data into standardized templates cut spreadsheet work and speed up variance analysis. With those standards in place, the tools below fit into a much cleaner reporting stack.
1. Oakside Co
Website: oaksideco.com Best for: Advisory-level analysis, transaction strategy, and disposition planning
Oakside Co sits at the decision-making layer of portfolio reporting. It’s a national commercial real estate advisory firm focused on self-storage and boat & RV assets, with institutional-grade analysis that helps turn portfolio data into hold-sell decisions, capital allocation choices, and disposition plans.
The firm helps owners read facility-level performance in context, spot patterns across a portfolio, and make sharper calls on capital allocation and regional performance. Its services include transaction management, investor network access, and disposition support for institutional buyers and sellers in these asset classes.
Use Oakside when clean reporting needs to turn into an investment decision.
2. Yardi Storage Manager
Website: yardi.com/products/yardi-storage-manager
Best for: Enterprise accounting, operations reporting, and multi-site KPI visibility
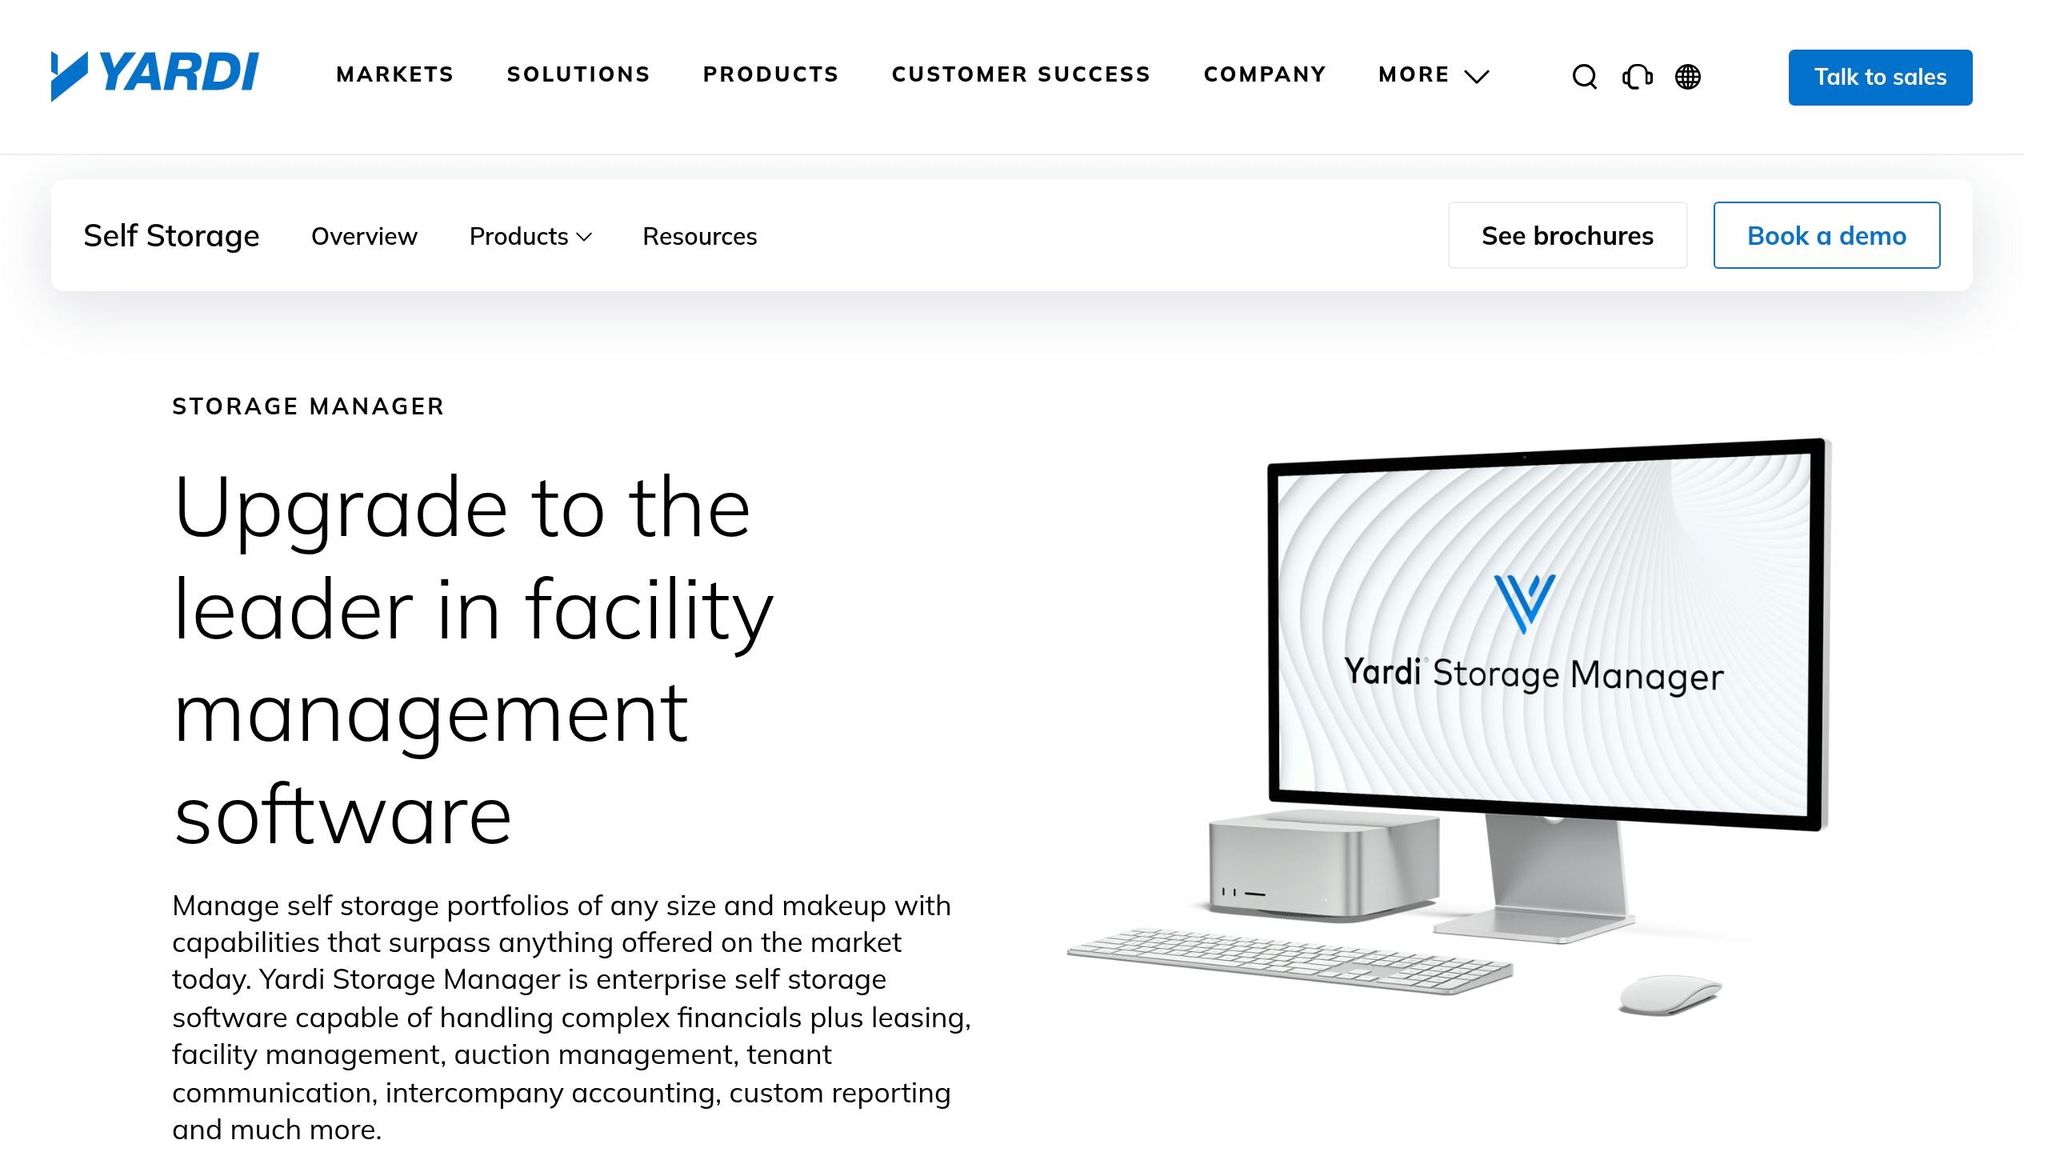
Yardi Storage Manager acts as the system of record for many large self-storage portfolios. It pulls facility-level operating data into one reporting system, which makes it a strong fit for portfolio reporting.
Teams can use it to compare facilities by market, occupancy, revenue, delinquency, and collections. Core KPIs like monthly revenue trends, occupancy, delinquency, collections, and NOI can be reviewed across the full portfolio.
Where Yardi stands out is consistent reporting across locations. That makes side-by-side facility comparisons faster and a lot cleaner.
Use Yardi to monitor performance. Then pair that data with advisory review to turn numbers into hold-sell and capital decisions. After that, investors can dig into deeper analytics and advisory review.
3. Storable Portfolio Analytics
Website: storable.com
Best for: Real-time KPI dashboards, marketing performance tracking, and pricing insights for multi-site operators
Storable BI sits between day-to-day operating data and portfolio-level reporting. It’s built right into Storable Edge, so you don’t have to bolt on a separate analytics tool. Powered by Looker, it gives you custom dashboards with facility-level drilldowns and pulls site data into one view, which makes it easier to spot regional patterns and manager-level trends.
It also gives marketing teams and investors a clearer read on what’s working. Alongside occupancy and revenue data, Storable BI tracks move-ins by promotion and source channel, revenue tied to specific campaigns, and average length of stay linked to those efforts. That helps you see which campaigns are driving occupancy, revenue, and retention instead of just generating clicks.
On the pricing side, the platform tracks:
- Rent per square foot
- Revenue by stream
- Rate-change impact
- Lost revenue gaps
The Custom Report Builder lets you shape dashboards around the KPIs that matter most to your strategy, without needing a dedicated analyst. Add scheduled delivery, and you can send monthly or quarterly reports by email automatically, which is handy when you want the same reporting cadence across a portfolio.
4. Monument
Website: monumentstorage.com
Best for: Multi-facility benchmarking and portfolio-level rate tracking
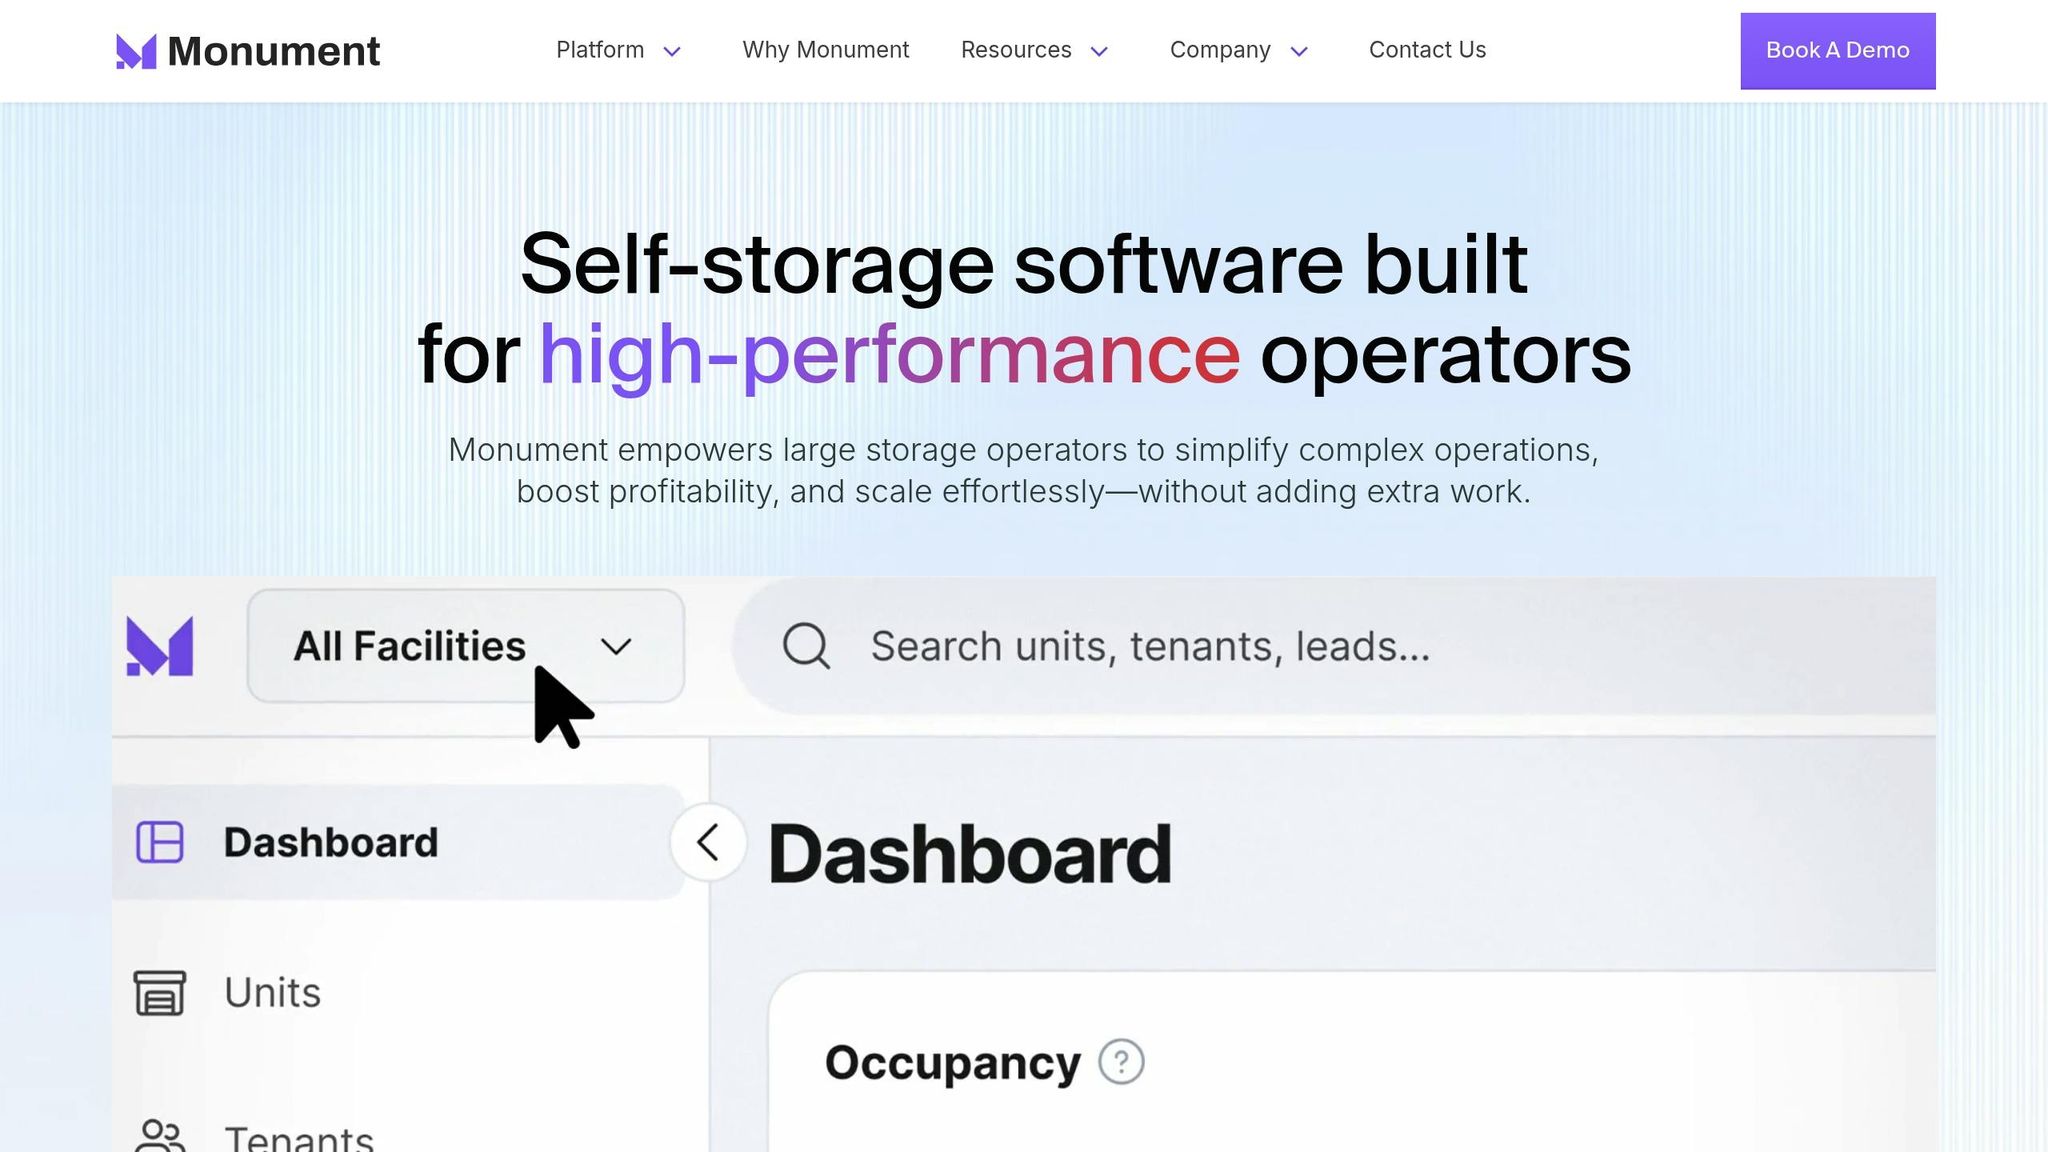
When pricing discipline is the main goal, Monument gives portfolio operators one place to view rate and occupancy data across multiple facilities. That makes it easier to benchmark pricing and spot properties that are out of line with the rest of the portfolio.
It also supports facility-level occupancy trends. On top of that, historic street and web rate data make it easier to compare pricing changes over time, so pricing and occupancy trends stay visible at the facility level.
5. Real Clear Software

Website: realclearsoftware.com
Best for: Portfolio-wide financial visibility
If your main focus is financial rollups, RCS adds a portfolio finance layer that helps tie everything together. Real Clear Software pulls financial data from multiple self-storage facilities into one dashboard, so owners can check NOI, expense ratios, and cash flow in a single place.
That dashboard shines when you want to compare site-level profitability without digging through separate reports. RCS tracks NOI, expense ratios, and cash flow at both the portfolio level and the individual facility level. So if one property is dragging behind the rest, it’s much easier to spot.
Use RCS when you need cleaner financial rollups across a multi-site portfolio. It’s a good fit when monthly reporting needs to show a clear view across several locations.
Side-by-Side Comparison of the 5 Tools
5 Best Self-Storage Portfolio Tracking Tools Compared
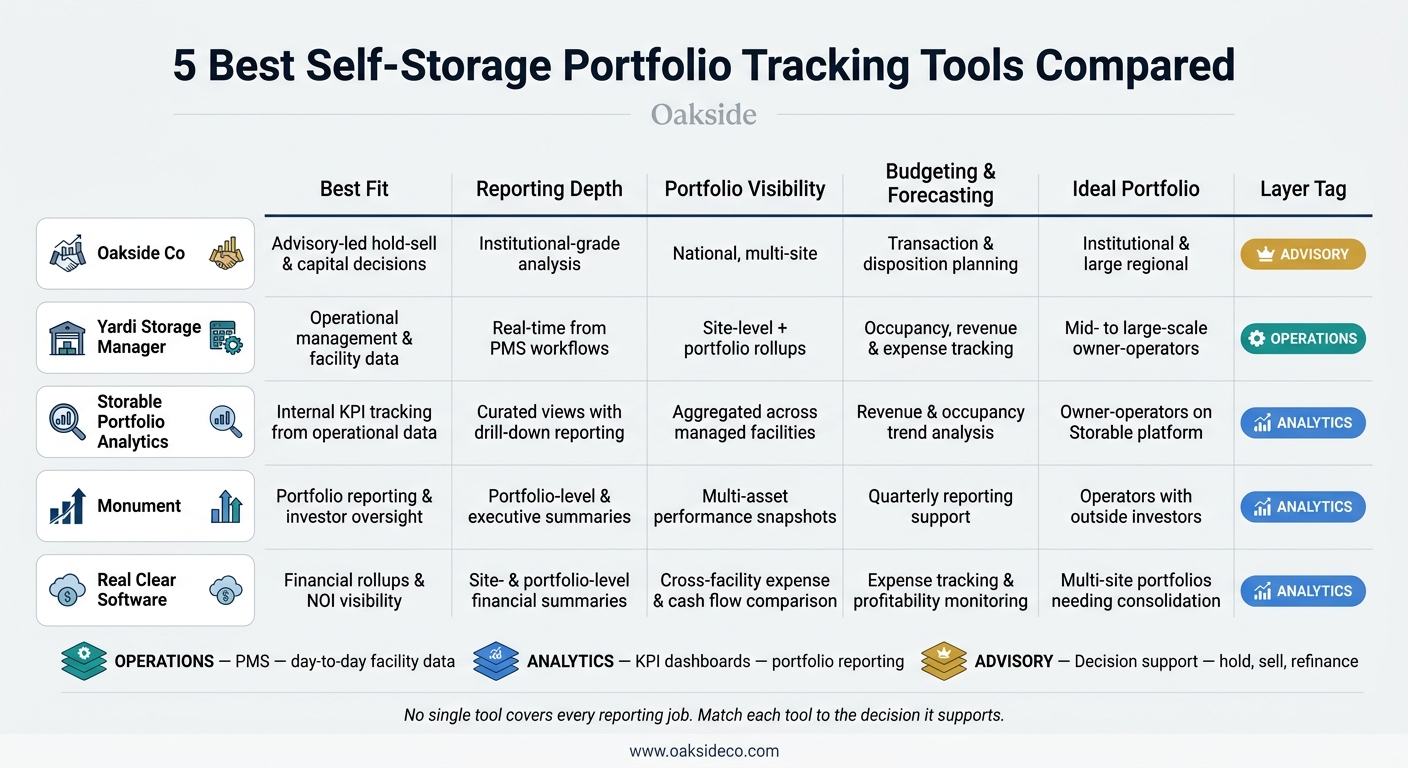
The table below shows where each tool fits in a self-storage reporting stack. Use it to line up each tool with the reporting job it handles.
| Tool | Best Fit | Reporting Depth | Portfolio Visibility | Budgeting & Forecasting | Ideal Portfolio Type |
|---|---|---|---|---|---|
| Oakside Co | Advisory-led hold-sell and capital decisions | Institutional-grade analysis and data-driven strategy | National, multi-site perspective with institutional-grade insight | Transaction planning and disposition planning | Institutional and large regional portfolios |
| Yardi Storage Manager | Operational management tied to facility data | Real-time reporting from property management workflows | Site-level reporting with portfolio rollups | Supports tracking of occupancy, revenue, and expenses | Mid- to large-scale owner-operators |
| Storable Portfolio Analytics | Internal KPI tracking from operational data | Curated views with drill-down reporting | Aggregated view across managed facilities | Revenue and occupancy trend analysis | Owner-operators using Storable as a system of record |
| Monument | Portfolio reporting and investor oversight | Portfolio-level reporting and executive summaries | Multi-asset performance snapshots | Quarterly reporting support | Operators with outside investors |
| Real Clear Software | Financial rollups and NOI visibility | Site- and portfolio-level financial summaries | Cross-facility comparison of expenses and cash flow | Expense tracking and profitability monitoring | Multi-site portfolios needing cleaner consolidation |
That mix works better when your reporting stack has three clear parts: one system of record, one analytics layer, and one advisory review process.
How to Build a Self-Storage Reporting Stack
The comparison above shows what each tool does. This section shows how they fit together.
Use a three-layer stack:
- a PMS for day-to-day operations
- analytics for portfolio reporting
- advisory review for capital decisions
Start With a System of Record for Facility Operations
Your foundation is a property management system (PMS). This is where the raw operating data lives: rent collections, physical and economic occupancy, move-in and move-out activity, delinquency, and operating expenses.
Connect the PMS straight to your analytics layer. That cuts out manual re-entry and helps reduce reconciliation mistakes. Automated auditing can also flag revenue leaks that can take about 6 hours per unit to find by hand.
Add Analytics for Portfolio-Wide KPI Reporting
Once the data is flowing cleanly, the analytics layer turns that data into portfolio reporting you can use.
You can compare facilities side by side, track rate trends over time, and spot which markets are driving results. If something looks off, drill into the facility-level data and figure out what’s going on. You can also use early warning signals to spot pricing pressure or demand shifts before they hit NOI.
That portfolio view should flow straight into advisory review for capital decisions.
Use Advisory Review for Hold-Sell and Capital Decisions
Use advisory review to put portfolio results in market context and support refinancing, acquisition, and disposition decisions.
Standardize Monthly and Quarterly Reporting Packs
Once the stack is connected, standardize the output. A solid reporting pack should include these investor-level metrics in a standardized U.S. format:
| Metric | Why It Matters |
|---|---|
| DSCR (Debt Service Coverage Ratio) | Lender-facing metric for loan compliance |
| IRR & Equity Multiple | Long-term return tracking for investors |
Automate delivery to partners, lenders, and asset managers on a fixed cadence.
Conclusion
These five tools cover different parts of portfolio tracking. No single tool does it all, so the smart move is to match each one to the job you need done.
The strongest setup usually comes from using a mix of operations, analytics, and advisory review. That way, occupancy, NOI, delinquency, and variance tracking stay consistent across every site in the portfolio.
The next step is turning reports into decisions. For institutional-scale portfolios, Oakside Co helps turn portfolio data into hold-sell and capital decisions.
FAQs
Which KPIs matter most by site?
At the site level, focus on physical and economic occupancy, achieved rental rates, NOI margins, rent per square foot, collections, and marketing ROI.
You’ll also want to review unit inventory, climate-control premiums, and local demand drivers such as population growth, household density, and traffic counts.
As Nolen Masserman, Managing Director at Oakside, emphasizes, precise tracking helps validate performance assumptions and guide strategic adjustments.
Do I need more than one tool?
It depends on how broad your investments are and what your team needs day to day. Many modern platforms now work as all-in-one systems for market intelligence, underwriting, and portfolio tracking. That can cut down on the usual mess of extra tabs, spreadsheets, and scattered reports.
As Nolen Masserman, Managing Director at Oakside, notes, a unified, data-driven approach helps maintain clarity across a portfolio. So if you’re trying to streamline workflow and keep your data clean, one strong tool may be enough.
How should I build a reporting stack?
Build your reporting stack by pairing real-time operational data with outside market intelligence. The goal is simple: cut down on manual spreadsheets and stop working across disconnected data sources.
Use Storable Business Intelligence to track internal performance. Then use TractIQ and StorTrack for market research, MSA breakdowns, and portfolio-wide analysis.
As Nolen Masserman, Managing Director at Oakside, notes, this setup helps investors move from reactive analysis to proactive strategy.