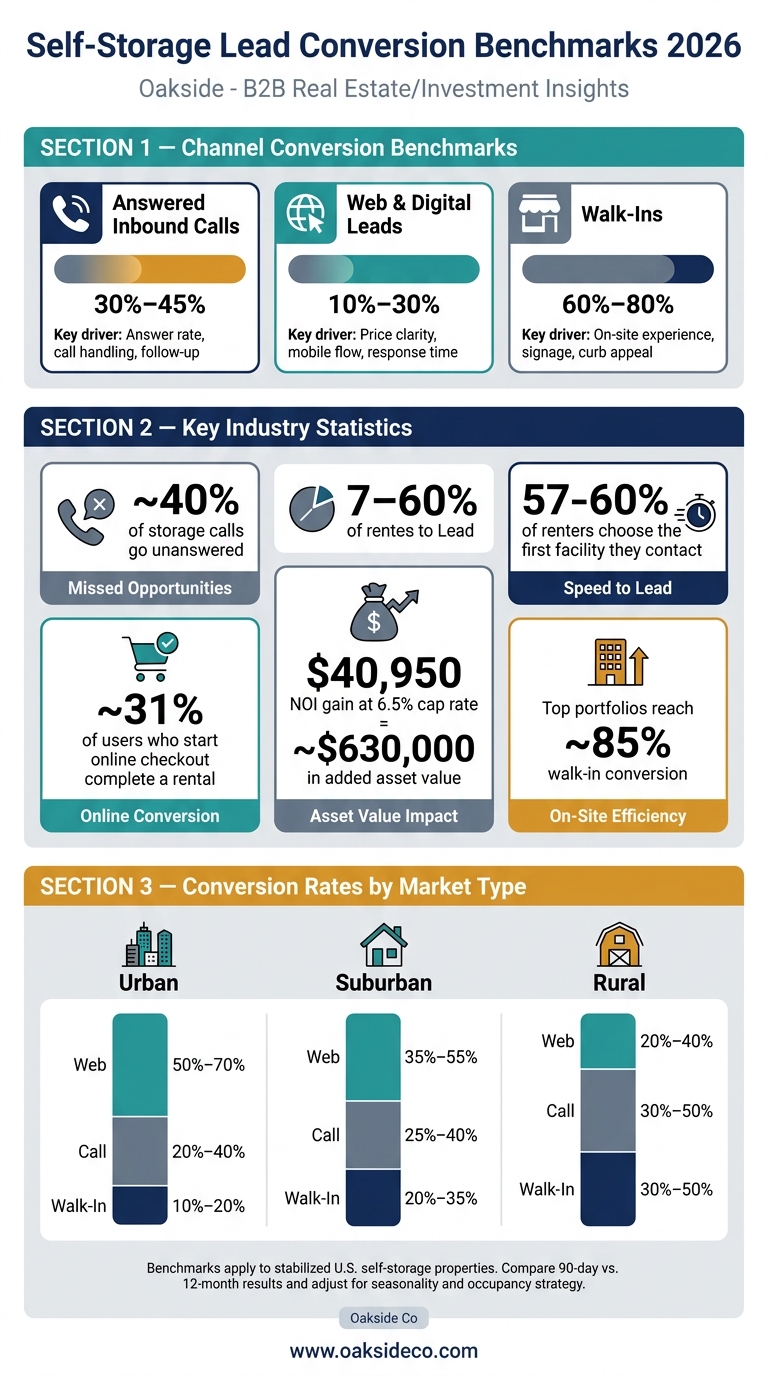
If you want the short answer, here it is: in 2026, most U.S. self-storage properties should expect 30%–45% conversion from answered inbound calls, 10%–30% from web and digital leads, and 60%–80% from walk-ins.
I’d use those numbers as ranges, not hard goals. A rural property, a suburban store, and a big urban portfolio won’t convert leads the same way. Lead mix, staffing, missed calls, pricing, and the online rental path all change the outcome.
Here’s what matters most:
- Calls usually convert well, but missed calls can cut results fast.
- Web leads vary the most because intent is mixed.
- Walk-ins tend to convert best because those renters often have stronger intent.
- Market type and asset size change what “normal” looks like.
- Small conversion gaps can hit NOI and value in a big way.
Self-Storage Lead Conversion Benchmarks 2026: Rates by Channel & Market Type
Quick comparison
| Channel | 2026 range | What moves the number most |
|---|---|---|
| Answered inbound calls | 30%–45% | Answer rate, phone handling, follow-up |
| Web and digital leads | 10%–30% | Price clarity, mobile flow, online checkout, response time |
| Walk-ins | 60%–80% | Store experience, signage, curb appeal, ease of renting |
A few numbers stand out from the article:
- About 40% of storage calls go unanswered
- About 57%–60% of renters choose the first facility they contact
- Around 31% of users who start online checkout finish a rental
- Top portfolios can reach about 85% walk-in conversion
- A $40,950 NOI gain at a 6.5% cap rate can add about $630,000 in value
My main takeaway: don’t judge conversion in isolation. I’d look at each channel by store, compare the last 90 days with a 12-month view, and then ask a simple question: is the gap coming from the market, or from execution?
sbb-itb-09b4138
2026 Benchmark Ranges by Lead Channel
Use these 2026 channel benchmarks as rolling ranges for stabilized U.S. properties. Compare your 90-day results against your 12-month numbers, then adjust for seasonality, marketing mix, and occupancy strategy. These ranges become more useful when you tune them to market type and portfolio size.
| Lead Channel | 2026 Benchmark Range | Key Performance Driver |
|---|---|---|
| Answered inbound calls | 30%–45% | Staff responsiveness and call handling |
| Web and digital leads | 10%–30% | Pricing clarity, online rental flow, mobile usability, follow-up speed |
| Walk-ins | 60%–80% | On-site experience, signage, curb appeal, convenience |
What matters most isn’t the range by itself. What matters is why a property falls below it – staffing, pricing, or friction in the funnel.
Call Lead Conversion: 30% to 45% for Answered Inbound Calls
Phone is still one of the best-converting channels. For answered inbound calls, 30% to 45% is the 2026 benchmark for a well-run facility.
Missed calls need their own tracking because they cut into total revenue capture in a big way. Industry data suggests that about 40% of storage-related calls go unanswered, and one model estimates that a 300-unit facility can lose about $35,251 per year from missed calls alone.
The gap between answered-call conversion and total-call conversion can tell you a lot about a property’s actual phone performance. And speed is a huge part of that story: 57% to 60% of renters choose the first facility they contact. In plain terms, a missed call often means a lost lease, not just a late one.
Web and Digital Lead Conversion: 10% to 30%
Web and digital lead conversion runs from low-intent form fills all the way to completed online rentals, so the range is naturally broader than phone. Form fills and chat inquiries usually sit near the low end. Reservation flows and completed online rentals tend to land in the upper half.
A separate checkout-funnel benchmark shows that about 31% of users who start the online checkout process finish a rental.
Results here usually come down to a few simple things:
- Clear pricing
- Good mobile usability
- A short checkout flow
- Fast follow-up
Sites that show clear, current rates and make online rentals fast with few steps tend to land near the top of the range. Properties with vague pricing or too many rental steps often sit in the low teens, even when traffic volume looks healthy.
Walk-In Conversion: 60% to 80%
Walk-ins are the highest-intent prospects across these three channels, and the conversion range reflects that. 60% to 80% is the standard band for 2026, and top-performing portfolios can reach about 85% walk-in conversion.
At this stage, the on-site experience does most of the heavy lifting. Signage, curb appeal, and convenience shape whether that prospect rents or walks back out.
The next step is to test where each property sits inside these ranges by market and asset size.
How Benchmarks Shift by Asset Size and Market Type
The channel benchmarks above don’t stay fixed once you factor in market mix and operating scale. Using one conversion target across every property can give you the wrong read on portfolio performance. Call, web, and walk-in ranges move based on market type, competition, lead mix, and scale. The table below shows how those shifts change what you should expect by market.
Urban, Suburban, and Rural Market Differences
Location is the biggest driver of channel mix. Urban assets tend to lean digital. Rural assets, by contrast, lean more on calls and walk-ins.
| Market Type | Typical Lead Mix (Web / Call / Walk-In) | Conversion Pattern | Main Risks |
|---|---|---|---|
| Urban | ~50%–70% web, 20%–40% call, 10%–20% walk-in | Web: high volume, lower per-lead conversion; Calls: mid-range; Walk-ins: high when they occur | Understaffed call handling, complex pricing competition, inconsistent online reservation follow-up |
| Suburban | ~35%–55% web, 25%–40% call, 20%–35% walk-in | Web: moderate to strong; Calls: steady, sensitive to scripting; Walk-ins: strong with good on-site process | Variable staffing coverage, inconsistent KPI tracking, reliance on one or two strong managers |
| Rural | ~20%–40% web, 30%–50% call, 30%–50% walk-in | Web: lower volume, converts well with simple pricing; Calls: higher conversion; Walk-ins: very high, often need-based | Limited hours, weaker digital presence, delayed pricing strategies, dependence on word-of-mouth |
Calibrate each property using its own lead data, unit mix, and occupancy stage.
Small Facilities Versus Scaled Portfolios
Scale changes both performance and how well that performance gets measured. Independent operators and single-site owners often depend on local managers and basic software. That setup can lead to incomplete source attribution, manual reporting, and holes in call logging. If one manager is juggling leasing, collections, and day-to-day operations, missed calls go up, undocumented walk-ins pile up, and conversion data gets messy.
That’s a big reason small operators and large portfolios can look so different on paper. Independent operators without a call center convert about 25% of inbound calls, while scaled portfolios with dedicated call centers reach about 45%.
Scaled portfolios close that gap with standardized CRM tools, call-center systems, recorded calls, and shared definitions for what counts as a lead and what counts as a rental. Weekly or monthly KPI reviews also help management teams compare assets against segmented benchmarks, like urban versus rural or 80,000+ sq. ft. versus under 30,000 sq. ft., and spot outliers fast.
For owners and investors, that distinction matters before making a judgment. A benchmark gap at a small facility may point first to measurement and process problems. In a scaled portfolio, the same gap can often be tied more directly to NOI impact. Oakside Co separates data-quality issues from operating underperformance during portfolio reviews.
Reading Benchmark Gaps During Asset Reviews
Once you know where a facility sits against the 2026 benchmark bands, the next move is to turn that comparison into an action plan, not just a report card.
A Simple Diagnostic Framework for Call, Web, and Walk-In Gaps
Map each channel the same way: inquiry, qualified lead, reservation, and move-in. Use a trailing 90-day window to calculate actual conversion rates by dividing completed rentals by qualified leads. Then break the data out by store, market type, and asset size so outliers stand out instead of getting buried inside portfolio averages.
Use the benchmark ranges as a flag, nothing more. They help show where a store is above or below the pack. From there, the real work starts: is the issue staffing, funnel friction, or on-site execution?
After the funnel is mapped, look at the pattern in the numbers. If call conversion is stuck in the low 20s but walk-in conversion is strong at 70% or more, that usually points to a front-end issue. The team may do well face-to-face but lose prospects on the phone because of weak scripting, slow answer times, or too many missed calls. Industry data shows that 40% of self-storage calls go unanswered. That’s a process problem first.
When call and walk-in conversion look solid but web performance lags, the issue often sits in the digital path or in delayed follow-up. Research on speed-to-lead shows that replying within minutes instead of hours leads to much higher close rates.
What Conversion Gaps Can Mean for NOI and Value
Conversion gaps add up fast.
Take a facility that gets 400 inbound calls per month and misses 40% of them. That’s 160 missed calls. Of the 240 answered calls, if the property converts at 20% instead of the 35%–40% benchmark, the shortfall works out to about 36–48 lost move-ins per month. At about $115 in average monthly rent and an 18-month average stay, the lifetime revenue impact stacks up in a hurry. That’s big enough to affect pricing, underwriting, and exit planning strategy.
Self-storage assets usually trade at 5.5%–8.0% cap rates, which implies about 12x–18x annual NOI. A $40,950 annual NOI lift at a 6.5% cap rate equals about $630,000 in added asset value. For investors looking at multi-asset portfolios, even a 10-percentage-point gain in call conversion or a 5-point gain in web lead conversion, spread across several properties, can move stabilized NOI enough to support tighter underwriting assumptions and stronger exit pricing. That’s the point where an operating gap turns into a value question.
Using Oakside Co‘s Advisory Lens in Portfolio Reviews
For portfolio reviews, the first step is data normalization. Oakside Co lines up definitions, pulls channel-level metrics by store, and segments results by market type and asset size before making any calls.
Oakside uses normalized channel data to connect operating gaps to NOI and asset value. The goal is simple: find which assets, and which channels, offer the most upside for each dollar spent on improvement, so decisions come from the numbers rather than gut feel.
Conclusion: Use 2026 Benchmarks as Ranges, Not Fixed Rules
If a property lands outside these ranges, the next move is to figure out what’s coming from the market and what’s coming from operations. Treat these 2026 bands as starting points, not hard targets: answered calls at 30%–45%, web and digital leads at 10%–30%, and walk-ins at 60%–80%.
That context turns a gap into something you can act on. Look at each gap through the lens of market type, asset class, competitive density, and rate strategy.
The point is to connect day-to-day execution to NOI. Even small improvements in call, web, or walk-in conversion can increase move-ins, occupancy, NOI, and property value.
"The benchmarks aren’t a grading system. They’re a diagnostic tool. The real question is always what’s driving the gap – and whether fixing it changes the investment thesis." – Cameron Vale, President at Oakside
Use the benchmarks as a rolling reference for staffing, pricing, and marketing decisions across the portfolio.
FAQs
How should I benchmark a rural vs. urban property?
Benchmark by trade area and market type, not national averages. A local view tells you much more than a broad national number ever will.
Use drive-time thresholds to define that area:
- Urban: 1–3 minutes
- Suburban: 3–5 minutes
- Rural: 10–15 minutes or more
Then compare RevPAF, occupancy spreads, absorption, and the supply pipeline inside that same trade area. That gives you a cleaner read on how the asset stacks up against nearby options, not some market on the other side of the country.
Rural assets often trade at higher cap rates. Urban tenants, on the other hand, usually care more about convenience and frequent access.
What usually causes low call conversion rates?
Low call conversion rates usually come down to operational problems that make the rental process harder than it should be. When people hit friction, they leave.
Some of the most common issues are:
- No 24/7 call handling
- Non-mobile-friendly websites
- Requiring a call to complete a rental
Other pain points matter too. Unclear pricing, missing location details, and slow mobile load times can push people away before they ever book. If someone lands on your site and can’t tell what a unit costs, where it’s located, or how to move forward from their phone, that’s a problem.
As Nolen Masserman, Managing Director at Oakside, and Cameron Vale, President at Oakside, point out, clear messaging and transparent, competitive pricing help turn interest into bookings.
How often should I review lead conversion by channel?
Review lead conversion by channel as part of your regular reporting, not a one-and-done check. In self-storage, demand is local and often shifts with the seasons, so this needs to stay on your radar.
A steady review cycle helps you spot problems early, like missed after-hours leads or a drop in conversion from one channel, before they hit your bottom line.