NOI margin tells you how much of your storage revenue is left after property-level expenses. In plain terms: if your site brings in $1,000,000 and keeps $450,000 after expenses, your NOI margin is 45%.
If I were sizing up a self-storage or boat & RV deal on September 10, 2026, I’d focus on a few things right away:
- How to calculate it:
NOI margin = NOI ÷ revenue
And NOI = effective gross income – operating expenses - What counts as a solid range:
Stabilized self-storage often lands around 40% to 60% NOI margin.
Boat & RV can run above 60% because costs are often lower. - What usually moves the number:
- Rental rates
- Occupancy quality
- Payroll
- Property taxes
- Insurance
- Utilities, especially for climate-controlled space
- How to read the number the right way:
A margin by itself does not say much. I need to compare it to similar assets with the same revenue base and a similar setup. - Why it matters in a deal:
Even a small margin change can shift value in a big way.
For example, moving from 45% to 48% on $1,000,000 of revenue adds $30,000 of NOI. At a 6.0% cap rate, that can mean about $500,000 more in value.
Here’s the short version: NOI margin is one of the fastest ways to judge pricing, cost control, and deal quality. A low margin can point to weak rents, high expenses, or both. A strong margin can support a hold, refinance, or sale case.
The rest of this guide breaks down the formula, normal ranges, main drivers, and how I’d use NOI margin to make a buy, hold, improve, refinance, or sell call.
NOI Margin Formula and Core Definitions
Net Operating Income (NOI) is revenue minus operating expenses, before debt service, taxes, depreciation, amortization, and capital expenditures. NOI margin is NOI divided by revenue. It shows how much of each revenue dollar is left after day-to-day operating costs.
In self-storage and boat & RV, these two numbers sit at the center of how owners look at pricing, expenses, and underwriting. For those new to the asset class, understanding these metrics is a core part of learning how to operate self-storage effectively.
How to Calculate Effective Gross Income, NOI, and NOI Margin
The math is straightforward:
PGI minus vacancy and credit loss equals EGI. EGI minus operating expenses equals NOI. NOI divided by revenue equals NOI margin.
You can use EGI or gross revenue as the denominator. The key is to define it clearly and use it the same way every time. In storage underwriting, annual or TTM figures are common because they smooth out seasonality.
What Counts as Revenue and Operating Expense in Storage
Storage revenue often includes unit rent, tenant insurance commissions, admin and move-in fees, late fees, lock sales, and retail sales.
Operating expenses often include:
- Property taxes
- Payroll and benefits
- Utilities
- Insurance
- Marketing
- Software
- Repairs and maintenance
- Security
- Office overhead
- Management fees
Include a market-rate management fee even for self-managed assets. That keeps NOI normalized for buyers and lenders. Items left out of NOI include capital expenditures, debt service, income taxes, depreciation, and amortization.
Once those revenue and expense lines are set, margin benchmarks become much more useful.
A Simple Hypothetical Example Using U.S. Dollar Figures
Here’s a simple example that puts the formula into numbers:
| Line Item | Amount |
|---|---|
| Potential Gross Income (PGI) | $1,000,000 |
| Vacancy & Credit Loss | ($80,000) |
| Effective Gross Income (EGI) | $920,000 |
| Operating Expenses (taxes, payroll, utilities, insurance, marketing, software, repairs) | ($320,000) |
| Net Operating Income (NOI) | $600,000 |
| NOI Margin (NOI ÷ EGI) | 65.2% |
If that same facility used total gross revenue as the denominator, the margin would be 60.0% ($600,000 ÷ $1,000,000). Both numbers describe the same property. The only difference is the revenue base used in the calculation.
That’s why the denominator needs to be clear from the start, especially in peer comparisons and underwriting discussions and cap rate analysis.
NOI is not cash flow. Debt service and major capital work sit below it.
With the math in place, the next step is figuring out whether the margin looks strong or weak against similar storage assets.
sbb-itb-09b4138
How to Benchmark NOI Margin Against Peers
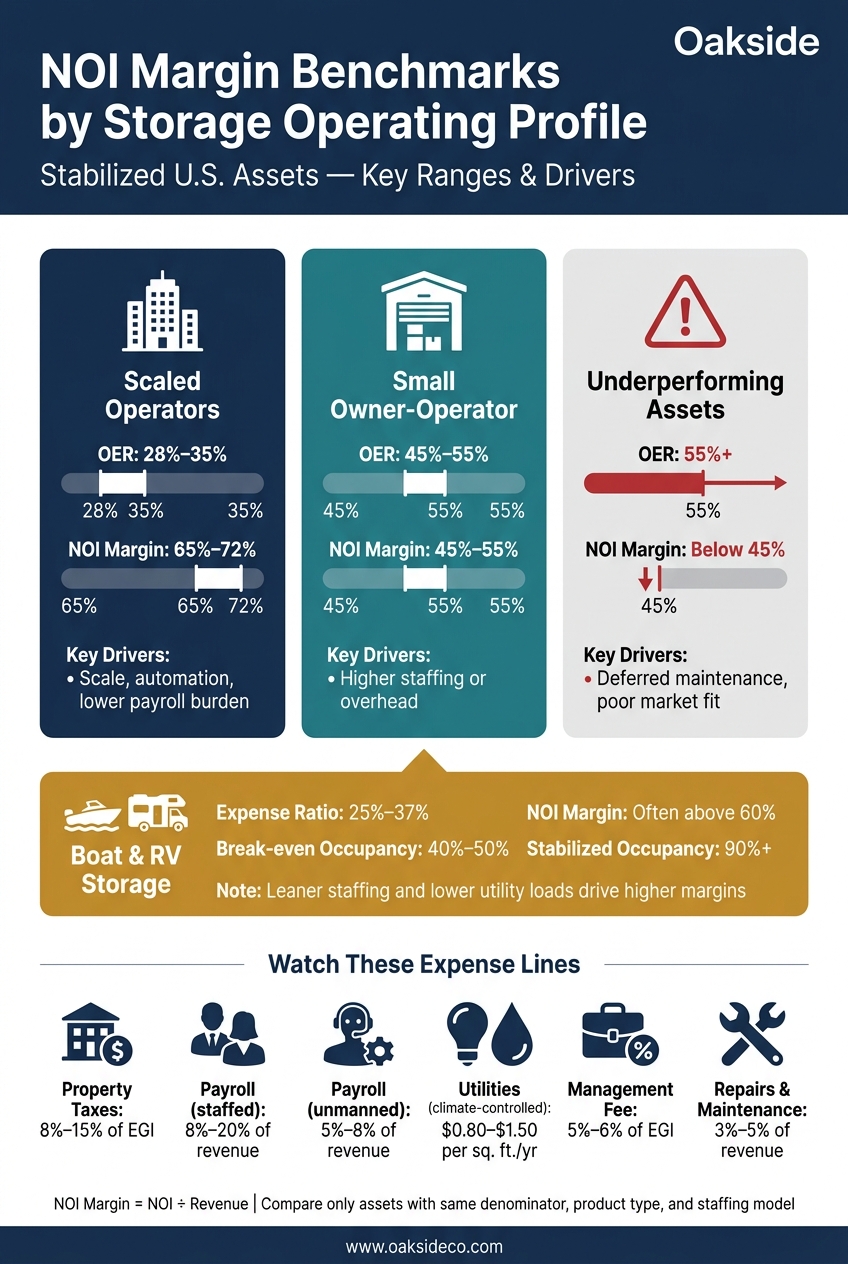
NOI Margin Benchmarks by Storage Asset Type & Operating Profile
NOI margin only means something when you stack it up against similar properties. A 60% margin might look solid at first glance. But if peer assets are running at 65%+ under similar conditions, that 60% starts to look weak.
One more thing matters here: use the same denominator you used in the formula section. If you switch methods, the comparison gets messy fast. With that in place, the next step is simple: figure out what counts as a normal range for stabilized assets.
Typical NOI Margin Ranges for Stabilized Storage Assets
For stabilized U.S. self-storage assets, NOI margins usually land in the 40%–60% range, while expense ratios tend to sit around 35%–50% of gross revenue. Most of the spread comes from taxes, payroll, climate-control mix, and how mature the market is.
Scale can change the picture in a big way. Extra Space Storage reported a full-year 2024 same-store expense ratio of 25.9%, which shows how lean large operators can run at scale. On the other side, small owner-operators often fall in the 45%–55% expense ratio range, and underperforming assets can hit 55%+.
Some expense lines deserve extra attention. Property taxes alone often make up 8%–15% of EGI, and payroll often lands in a similar 8%–15% band depending on the staffing model. In a market with heavy reassessments, a sale can knock down the in-place margin in a meaningful way. That’s why tax exposure should stand on its own in any peer review.
How Expense Ratio and NOI Margin Work Together
NOI margin tells you what’s left. OER tells you what got spent. Put them together, and you can tell whether the problem sits on the revenue side or the cost side.
If a property has a below-peer NOI margin but a normal OER, the issue is usually revenue. Maybe rents are too low. Maybe occupancy is soft. If NOI margin is weak and OER is high, the pressure is coming from costs such as payroll, utilities, insurance, or a mix of all three.
From there, the number should be compared by asset type, staffing model, and market position.
Peer Review by Asset Type, Quality, and Market Position
A climate-controlled asset and a mostly drive-up, manned facility should not sit in the same peer set. That kind of comparison can send you in the wrong direction. Peer groups need to be filtered by product type, staffing model, age band, and market maturity before the numbers mean much.
In storage, the main filters are usually climate control, staffing, and management structure. Here’s how the range tends to shift across operating profiles:
| Peer Group | Typical OER | Implied NOI Margin | Key Drivers |
|---|---|---|---|
| Scaled operators | 28%–35% | 65%–72% | Scale, automation, lower payroll burden |
| Small owner-operator | 45%–55% | 45%–55% | Higher staffing or overhead |
| Underperforming | 55%+ | Below 45% | Deferred maintenance, poor market fit |
Climate-controlled assets add another wrinkle. They often bring in more revenue per square foot, but they also carry higher utility and HVAC costs. So the raw margin edge is usually smaller than the rent premium makes it seem. In 2024, climate-controlled units averaged about $1.66/sq. ft. nationally, versus $1.31/sq. ft. for non-climate-controlled units. That’s why product mix needs to be normalized before comparing margins.
Management fees need the same treatment. Self-managed assets that leave out a market-rate management fee – usually 5%–6% of EGI – make NOI margin look better than it is.
Once the peer range is clear, the next move is to isolate the revenue and expense drivers behind the gap.
What Drives NOI Margin in Self-Storage and Boat & RV
Once you know where your margin sits against peers, the next step is simple: figure out what’s moving it. In most cases, NOI margin shifts because of a small set of revenue and expense choices that stack up over time.
Once the benchmark is clear, the next step is isolating the revenue and expense drivers behind it.
Revenue Levers That Expand NOI Margin
In self-storage, the biggest margin gains usually don’t come from just filling more units. They tend to come from street-rate management and getting more realized rent from occupied units instead of chasing occupancy for its own sake.
One of the clearest signs is the gap between in-place rents and current street rates. Tenants can be paying below-market rates even when physical occupancy looks strong. That’s where economic occupancy tells the fuller story. If the gap between physical and economic occupancy is more than 5%, it points to pricing or collections problems.
Dynamic pricing has become a common tool for closing that gap. Operators using AI-driven pricing have reported solid same-store revenue growth, and U.S. operators using these tools averaged more than 4.3% same-store revenue growth in 2025.
Another high-margin lever is ancillary income. Tenant insurance commissions, admin fees, late fees, and merchandise sales often add revenue with very little extra operating cost. At a well-run facility, ancillary income can reach 8%–15% of total revenue.
If revenue is leaking, the next step is to check whether the cost structure is making the problem worse.
Expense Categories That Compress or Protect Margin
Taxes and insurance are usually the hardest costs to control. Reassessments and market premiums can move fast. Insurance can swing hard in coastal and flood-exposed markets, and a post-sale reassessment can reset property taxes in a way that squeezes in-place margin. That’s why these costs need asset-level underwriting.
Payroll is often where the operating model shows up most clearly. Fully staffed facilities carry more labor cost. Lower-touch, tech-enabled operations can trim payroll when local demand supports that setup. Hybrid models land in the middle, using kiosks, smart locks, and centralized call centers to cut on-site labor without removing people from the process altogether. At unmanned sites, payroll can fall to 5%–8% of revenue.
Utilities are the main cost variable for climate-controlled assets. HVAC, dehumidification, and around-the-clock environmental monitoring can add $0.80–$1.50 per climate-controlled sq. ft. per year in power costs alone. For a 5,000 sq. ft. climate zone, that can mean about $4,000–$7,500 per year just for electricity.
Self-storage vs RV storage investment returns show that boat and RV facilities usually run much leaner. Staffing is lighter, utility loads are lower, and expense ratios often fall in the 25%–37% range. As a result, NOI margins often top 60%. Break-even occupancy for boat/RV storage is often just 40%–50%, while stabilized properties often run above 90% occupancy.
Scorecard for Owners and Asset Managers
The table below links each KPI to what it’s telling you:
| KPI | Typical Range | What It Signals |
|---|---|---|
| Economic occupancy | Close to physical occupancy; a gap over about 5% warrants review | Revenue quality; wide gaps point to discounting or delinquency |
| RevPAF (annual) | $14–$17 national avg; $22–$30+ top markets | Pricing strength and unit mix efficiency |
| Achieved rent vs. street rate | Tight alignment | Rate discipline; wider gaps point to revenue leakage |
| Expense ratio | 28%–55% depending on model | Overall cost efficiency by operating profile |
| Payroll as % of revenue | 5%–20% | Staffing model efficiency |
| Utility cost per rentable sq. ft. | $0.80–$1.50 (climate-controlled) | Climate system load and energy management |
| Repairs & maintenance | 3%–5% of revenue | Maintenance discipline and deferred cost risk |
| NOI margin | Higher for leaner operations and tighter pricing; lower when payroll, utilities, taxes, or repairs rise | Bottom-line operating performance |
Use the same layered read to decide whether the gap sits in revenue, expenses, or both. Those signals shape the hold, improve, refinance, or sell decision.
How NOI Margin Informs Hold, Improve, and Sell Decisions
How Buyers and Lenders Use NOI Margin in Underwriting
Buyers and lenders look at NOI margin as a quick check on pricing discipline, expense control, and debt-service capacity. If a facility lands below the margin range for similar properties, that usually invites more scrutiny before anyone puts much faith in the rest of the underwriting.
The math is simple: Value = NOI ÷ Cap Rate. If a facility produces $1,000,000 in effective gross income at a 45% NOI margin, NOI comes out to $450,000. At a 6.0% cap rate, that points to a value of about $7,500,000. Move the margin to 48% with the same revenue, and NOI climbs to $480,000, which pushes value to roughly $8,000,000.
Lenders then add DSCR to the picture. If two facilities post the same revenue but one has a lower NOI margin, the lender won’t treat them the same. Debt sizing will depend on whether that cash flow looks durable enough to cover the loan.
That same underwriting view also shapes the next move: is the margin gap fixable, or is it smarter to cash out through a sale?
How Owners Can Decide Whether to Hold, Improve, Refinance, or Sell
Once margin gets translated into value, the next step is figuring out whether operations can close the gap faster than the market can price it in.
What matters most is the trend line, not just one snapshot. A facility with a steady or improving margin often supports a hold or refinance because lenders are more likely to view that cash flow as dependable and size debt on better terms. A flat or declining margin, especially when expenses keep climbing, can hint that the asset has limited room left to improve.
Here’s a concrete example. A storage facility generating $1,200,000 in annual revenue at a 42% NOI margin produces $504,000 of NOI. Improve margin to 46% through rate optimization and tighter expense control, and NOI rises to $552,000. At a 6.5% cap rate, that $48,000 gain translates to roughly $738,000 in added value. If that lift is low-cost and repeatable, holding or refinancing may make sense. If it takes major capital and the payoff is shaky, selling after stabilization may be the better call.
Use 12 to 24 months of trailing data. One month can send you in the wrong direction.
Key Metrics That Matter Most
These metrics help test whether a margin gap is structural, temporary, or already baked into pricing.
NOI margin works best when you read it with the rest of the operating picture. Pair it with:
- Economic occupancy
- Delinquency
- Same-store revenue growth
- Rental rate per square foot
- DSCR
That mix helps separate a real operating issue from a lease-up or repositioning phase.
| NOI Margin vs. Peers | What It Likely Signals | Suggested Path |
|---|---|---|
| Materially below peer range | Correctable inefficiency or pricing gap | Improve operations, then reassess |
| Near peer range | Stable, well-run asset | Hold or refinance if debt terms support it |
| Above peer range | Strong operating quality | Consider sale if market pricing is attractive |
Oakside helps owners benchmark margin and model hold, improve, refinance, and sale scenarios.
FAQs
Should I use EGI or gross revenue?
No. Don’t use EGI or gross revenue as the main basis for valuation.
EGI can help with expense-ratio analysis. But using gross revenue to price a self-storage deal is an old mistake.
As Nolen Masserman, Managing Director at Oakside, notes, self-storage trades on cap rates applied to stabilized NOI, not gross metrics. EGI on its own skips over the operating costs that shape profit, so the better number to watch is trailing-12-month NOI.
What is a good NOI margin for my asset type?
For well-run storage assets, a good NOI margin usually falls between 60% and 78% of effective gross income after operating expenses.
If operating expenses climb past the 35%–45% range, that can point to high costs, weak revenue, or both. As Nolen Masserman, Managing Director at Oakside, notes, self-storage assets are valued on stabilized NOI, not gross revenue.
How much can a small NOI margin change affect value?
Even a small shift in NOI can have a big effect on value.
Why? Because self-storage properties are often priced by dividing NOI by the market cap rate.
Here’s a simple example: if you add $72,000 in annual NOI at a 5.5% cap rate, the property’s value can go up by about $1.3 million.
The flip side matters too. At a 6% cap rate, missing just $1 in expenses can cut value by about $16.67.