If I want a fast read on value, I start here: land value + current build cost – depreciation. For boat and RV storage, that means I do not treat the property like one lump sum. I split it into open stalls, covered canopies, enclosed units, and site work, then price each part on its own.
Here’s the short version:
- I measure the full storage mix first
- I price buildings and site work at current U.S. costs
- I deduct physical wear, layout problems, and market pressure
- I add vacant land value
- I check the result against rents, occupancy, and sales
A simple example from the article makes the math clear:
- Land: $1,750,000
- Replacement cost new: $4,250,000
- Depreciation: $1,000,000
- Indicated value: $5,000,000
A few cost ranges shape the result fast:
- Covered metal canopies often run $15 to $35 per sq. ft.
- Partly enclosed bays often run $30 to $60 per sq. ft.
- Fully enclosed RV and boat units often run $65 to $95 per sq. ft.
- Heavy-duty asphalt often runs $3 to $8 per sq. ft.
- Heavy-duty concrete often runs $6 to $12 per sq. ft.
- Security systems often make up 3% to 5% of total construction cost
The main point is simple: higher build cost does not always mean higher value. If stall depth is too short, aisles are too tight, or local self-storage vs RV storage demand is weak, the market may not pay for the extra spend.
I’d sum up the article like this:
- Measure first
- Price each component
- Apply depreciation by component
- Add land
- Check the answer against the market
That is the core cost approach for boat and RV storage in plain English.
Step 1: Identify the Storage Mix and Measure the Improvements
Before you can build a cost estimate, you need to break the property into its main parts. Start with the site plan, then walk the property and sort every revenue-producing area into one of three buckets: open storage, covered canopy parking, or enclosed units.
As you go, record stall counts, dimensions, and square footage for each storage type directly on the site plan. That inventory is the starting point for replacement cost new. Those measurements also feed the replacement-cost estimate in the next step.
Open, Covered, and Enclosed Storage Configurations
Each storage format has its own physical traits, and those traits push replacement cost up or down. The table below shows the main details to document for each type.
| Storage Type | Typical Bay/Unit Width | Typical Stall Depth | Key Features to Document |
|---|---|---|---|
| Open storage | 12–14 ft | 35–55 ft | Surfacing type (asphalt, concrete, gravel), stall count, pull-through vs. back-in, drainage features |
| Covered canopy | 12–14 ft | 30–50 ft | Canopy area (sq ft), clear height, column spacing, framing type, lighting under canopy |
| Enclosed units | 14-ft unit width common | 30–50 ft | Gross building area (sq ft), unit count by size, door width and height, wall system, electric hookups, sprinklers |
A few measurements matter more than others. Clear height is a big one for canopies and enclosed units. For large Class A motorhomes, 14 ft is a common minimum target. With canopy structures, post spacing also matters. 24-ft post spacing often supports two 12-ft stalls per bay.
For enclosed units, don’t stop at the total building size. Record net rentable area by unit type. That’s where the cost picture gets sharper. A 40,000 sq ft building might include a mix of standard boat bays and oversized RV units with 14-ft-wide doors, and those unit types can carry very different cost rates per square foot.
Once you have the unit mix pinned down, move to the site improvements that support it.
Site Layout Items That Must Be Counted
After measuring the storage types, count the site improvements one by one. Track paving in square feet, fencing in linear feet, gates by unit, lighting by fixture, and offices or support buildings by square foot.
Drive aisles need close attention because they often make up a big share of the paved area. For perpendicular RV bays, design guidance calls for 50–55 ft aisle widths so large rigs can back in safely. Angled spaces at 30–60° can work with aisles as narrow as 32–35 ft.
Measure each drive lane in feet. Width multiplied by length gives square footage, and that number flows straight into the paving cost estimate.
Beyond paving, count:
- Perimeter and internal fencing in linear feet
- Each gate and access control device by unit
- Pole lights and wall-mounted fixtures by unit
- Offices and maintenance buildings by square footage and construction type
sbb-itb-09b4138
Step 2: Estimate Replacement Cost for Buildings and Site Work
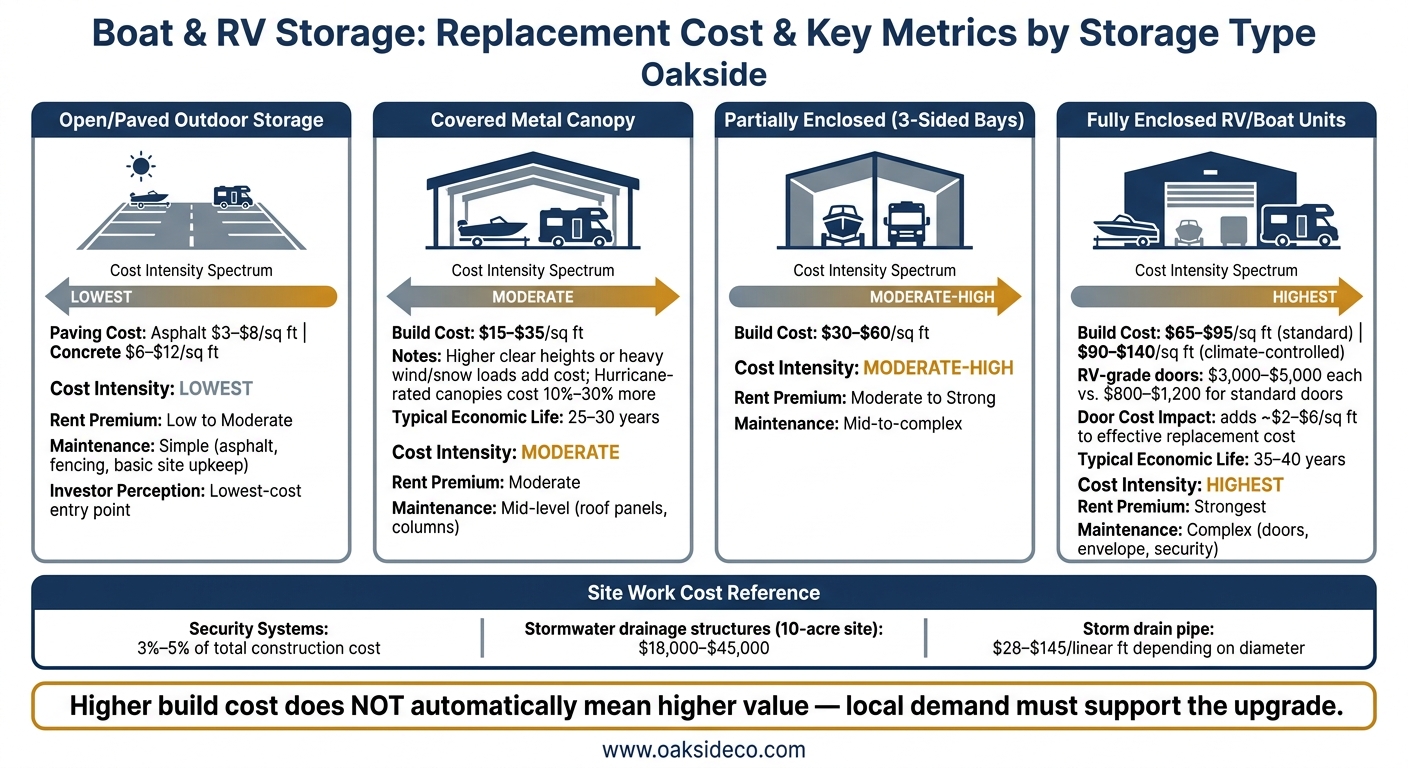
Boat & RV Storage Cost Breakdown by Type
Estimate replacement cost by splitting above-grade structures from site work for open stalls, canopy bays, enclosed units, and site improvements. That split matters because each category uses different unit costs, economic lives, and depreciation patterns. Start with the structures. Then price the site work.
Costing Open Storage, Canopies, and Enclosed Units
Open storage cost comes mostly from pavement, drainage, and vehicle circulation. Metal canopies are usually priced by the square foot of roof coverage. A pre-engineered steel canopy with no walls and standard lighting will often fall in the $15–$35 per square foot range for hard costs. If you move to higher clear heights or heavier wind or snow loads, costs climb because the steel, foundations, and engineering get heavier too. Hurricane-rated canopies can cost 10%–30% more than lower-load inland designs.
Partially enclosed structures – three-sided bays with shared side walls – usually land in the $30–$60 per square foot range. Fully enclosed RV and boat bays often run $65–$95 per gross square foot, while indoor climate-controlled boat storage can reach $90–$140 per gross square foot in some markets.
Door packages also matter more than people sometimes expect. A standard 8×8-foot roll-up door costs far less than the oversized 12×14-foot or 14×16-foot sectional doors needed for Class A motorhomes or large boats. In many U.S. markets, RV-grade doors cost $3,000–$5,000 each, compared with $800–$1,200 for standard doors. Depending on the bay layout, that can add about $2–$6 per square foot to a building’s effective replacement cost.
Costing Paving, Drainage, Utilities, and Security
For site work, pavement type is usually the biggest cost swing. In most cases, the choice comes down to asphalt or concrete, and each serves a different role in RV circulation:
| Factor | Asphalt | Concrete |
|---|---|---|
| Typical cost (heavy-duty) | $3–$8 per sq ft | $6–$12 per sq ft |
| Best use case | Drive aisles | High-load turning radii, entry aprons |
| Key cost driver | Pavement thickness, subgrade prep, haul distance | Mix design, forming labor, cure time |
Stormwater controls should get their own line item. On a typical 10-acre commercial site, drainage structures alone – catch basins, manholes, and outlet controls – can run $18,000–$45,000, before adding pipe runs or detention ponds. Standard precast catch basins cost $1,800–$3,800 each, and storm drain pipe can range from $28–$45 per linear foot for 12-inch PVC up to $75–$145 per linear foot for larger-diameter runs.
Utility runs, fencing, access control, and lighting round out the site work estimate. Security items – gates, keypads, cameras, and lighting standards – usually account for 3%–5% of total construction cost for storage facilities. That share gets higher when owners want integrated license plate recognition, high-pole LED arrays, or redundant data infrastructure. The cost approach should match the market-typical security level for the subject’s competitive set.
After pricing all components, apply a local cost multiplier to move the base estimate from a national average to the subject market. High-cost coastal metros may carry factors of 1.15–1.30, while lower-cost interior markets often run 0.90–0.95. Then time-adjust the result to the effective valuation date with a published construction cost index. Compare the index at the source date with the index at the effective date, then apply the ratio. After each component is priced, apply depreciation and reconcile the result against land value.
Step 3: Apply Depreciation and Reconcile the Value Indication
Once you’ve priced each component, the next step is to reduce that amount for depreciation. That reduction is called accrued depreciation. It comes from three sources: physical deterioration, functional obsolescence, and external obsolescence. Each source affects value in its own way, so each one should be measured on its own.
Physical, Functional, and External Depreciation
Physical deterioration is the easiest place to start. It covers age, wear, and deferred maintenance: cracked asphalt, rusted canopy columns, failing drainage inlets, and corroded fencing. The usual starting point is the age-life method. Divide a component’s effective age by its total economic life to get a depreciation rate, then apply that rate to its replacement cost new.
Use a separate economic life for each component. A blended rate can skew the result.
| Component | Typical Economic Life | Common Depreciation Driver |
|---|---|---|
| Asphalt paving | 15–20 years | Freeze-thaw cycles, cracking, alligatoring |
| Metal canopies | 25–30 years | Corrosion, roof panel condition |
| Enclosed metal buildings | 35–40 years | Building envelope, door systems |
| Security systems / gate controllers | 7–10 years | Technological obsolescence |
| Drainage pipe and inlets | 30–40 years | Design quality, maintenance history |
A 10-year-old canopy with a 30-year life and average condition would show about 33% physical depreciation. But a 10-year-old asphalt surface with visible alligatoring and ponding could be closer to 60–70%. Why the gap? Because visible damage and deferred maintenance can make the effective age older than the actual age.
Curable items should be handled separately as a cost to cure. That includes things like resurfacing, drainage repairs, and lighting upgrades. Add any rent loss tied to the repair period as well. Climate, traffic, and maintenance history can push these figures higher or lower.
If the problem comes from layout or design, don’t treat it as wear. That’s functional obsolescence.
Functional obsolescence shows up when the property no longer fits what tenants want. Maybe the stalls are too shallow for larger RVs or boats. Maybe the drive aisles are too tight for easy turning. Maybe the drainage plan leaves spaces under water after a storm. In each case, the issue can limit rents and narrow the tenant pool. The cleanest way to measure it is to estimate the rent discount or occupancy loss tied to those weaker spaces, then capitalize that income shortfall at a market cap rate.
External obsolescence comes from outside the property line. Think excess competing supply in the trade area, a site that no longer sits near the main recreational corridor, or weaker demand across the market. You usually see it in the numbers first: low occupancy that sticks around, slower re-leasing, or heavier concessions. To measure it, compare the income level suggested by the cost approach with the stabilized income the market will support. Capitalize that gap at a market rate, and the result is the external obsolescence deduction.
Adding Land Value and Checking Market Support
After applying all depreciation, add vacant land value at its highest and best use. Land value comes from recent comparable land sales, adjusted for size, zoning, access, topography, and proximity to interstates or recreational hubs. Highest and best use matters here in a direct way. If another use supports a much higher land value, that finding will affect the reconciled result.
At that point, you have depreciated improvement value plus land value. Then compare that total with the value signs from the income and sales approaches. If the cost approach lands far above where similar properties trade on a price per stall or price per rentable square foot basis, that’s usually a warning sign. In most cases, it points to missed depreciation or an aggressive land assumption, not a premium the market will pay.
On the flip side, if the cost indication comes in well below recent sales, the issue may be that economic lives were set too short or land comps were understated.
The last check comes down to what the local market supports in rent, occupancy, and sale price.
Clear capital records and a capital plan that lines up with the property’s condition make the depreciation case much easier to support. That support carries the most weight when the market data and the capital plan are telling the same story.
Market Factors, Investor Use Cases, and Final Takeaways
After depreciation, one last issue remains: will the market pay for what was built? Replacement cost is just the opening number. Market support comes down to demand, competing supply, operating costs, and how buyers view risk.
How Storage Type Affects Value
As storage moves from open to covered to enclosed, value usually moves up with it.
| Storage Type | Cost Intensity | Rent Premium Potential | Maintenance Profile | Investor Perception |
|---|---|---|---|---|
| Open/paved outdoor | Lowest | Low to moderate | Simple; asphalt, fencing, and basic site upkeep | Lowest-cost option |
| Covered canopy | Moderate | Moderate | Mid-level; roof panels and columns | Captures customers who want weather protection without full enclosure |
| Fully enclosed | Highest | Strongest | Complex; doors, envelope, and security | Highest revenue potential when demand supports it |
But higher cost does not automatically mean higher value. It only matters when local tenants and buyers are willing to pay for the upgrade.
In coastal and high-wind markets, weather protection can support rent premiums. At the same time, it pushes replacement cost higher. That link needs to show up in both the cost estimate and the depreciation analysis.
Site-level constraints matter too. Approvals, setbacks, height limits, stormwater rules, and use restrictions can change what is feasible and what a buyer will pay. A facility with limited expansion rights or legal nonconforming status carries added risk, and that risk should show up in the value conclusion.
Market evidence should either support the cost indication or pull it back into line. For example, a property with high-cost enclosed bays may still call for a downward reconciliation if the market only pays modest premiums for covered storage.
Investors use this framework across several situations:
- Acquisitions
- Dispositions
- Refinancing
- Redevelopment analysis
Conclusion: Core Steps Owners Should Follow
The cost approach for boat and RV storage works best when it starts with precise inputs and then gets checked against the market. In practice, that means building a full inventory of the storage mix, pricing each part at current replacement cost, applying depreciation separately to each building and site improvement, adding land value, and then testing the result against actual rents, occupancy, and comparable sales.
Oakside supports self-storage and boat/RV clients with data-driven valuation and transaction support.
FAQs
When should I use the cost approach?
Use the cost approach when you need a replacement-cost-based value check for boat and RV storage. It fits best for new development, expansions, or properties where site and construction details have a big effect on utility and risk.
It also helps when market comps can point you in the wrong direction. Paving, drainage, and covered vs. enclosed areas can materially affect buyer and lender confidence, so assumptions need to stay disciplined and should include a 5%–10% contingency – or more when soil or water conditions are unknown.
How do I estimate depreciation by component?
Use a cost segregation study to move parts of a property out of the default 39-year building schedule and into shorter tax lives.
Here’s what that can look like:
- 5 or 7 years for personal property, such as security cameras, gate operators, and keypads
- 15 years for land improvements, such as paving, fencing, exterior lighting, and drainage
That shift can front-load tax deductions through accelerated depreciation or 100% bonus depreciation.
Why might higher construction costs not raise value?
Higher construction costs do not always lead to higher property value. In commercial real estate, value usually comes from stabilized Net Operating Income and market cap rates, not simply from what it cost to build.
That gap matters. You can spend more on land, labor, materials, and interest carry, but if the market won’t support higher rents, the property may not be worth much more when it stabilizes.
When that happens, higher costs can create a few problems:
- Returns get squeezed
- Financing carry goes up
- Lenders may tighten terms or become less willing to lend
In plain English: if revenue doesn’t rise with costs, the deal can get ugly fast.
That’s why a ground-up project can underperform an acquisition of an existing facility. Buying an operating asset may offer better economics if it already has income in place and avoids the added risk that comes with construction.