Climate sets demand, rent, and product mix in boat and RV storage. If I boil this article down, the pattern is simple: snow drives long winter storage in the North, heat and humidity push enclosed demand in the Sunbelt, and UV plus hail support covered or enclosed storage in Western and Plains markets.
If you own, build, or study this asset class, here’s what matters most:
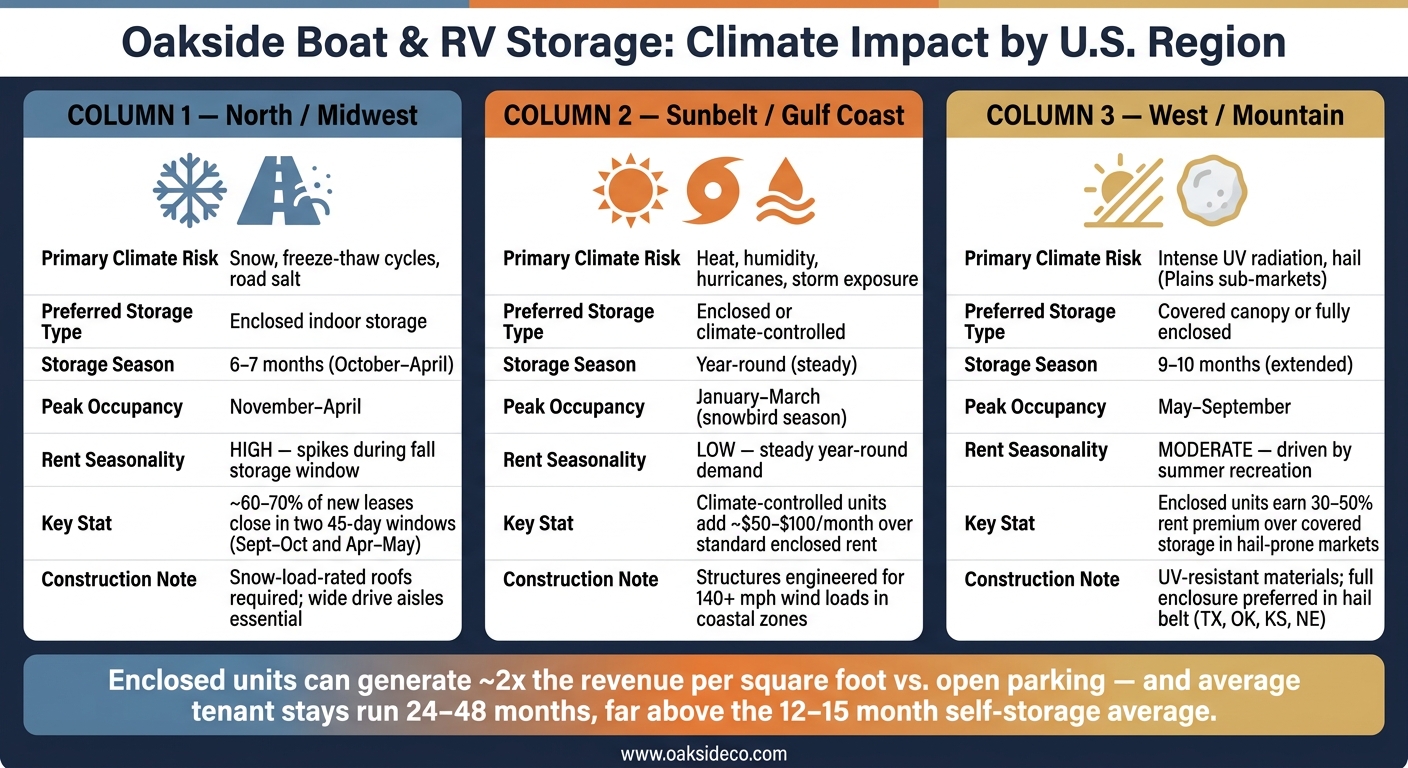
- Northern markets often have a 6- to 7-month storage season, with demand packed into fall and spring leasing windows.
- Sunbelt and Gulf Coast markets see year-round demand, shaped by snowbird traffic, storm risk, heat, and moisture.
- Western and Mountain markets often lean toward covered storage because of harsh sun, while hail-prone areas can support fully enclosed units.
- Enclosed storage can command a strong rent gap, and climate-controlled space may add about $50 to $100 per month over standard enclosed rent.
- In some markets, enclosed units can produce about 2x the revenue per square foot of open parking.
- Climate also affects costs through insurance, paving, wind-load standards, snow-load design, and maintenance.
Here’s the core takeaway: the best product type depends on local weather risk. If the mix is off, rent and occupancy can fall short. If the mix lines up with climate, income is often steadier and easier to underwrite.
| Region | Main weather issue | Storage demand tends to favor | Demand pattern |
|---|---|---|---|
| North / Midwest | Snow, freeze-thaw, road salt | Enclosed indoor storage | Strong winter peak |
| Sunbelt / Gulf Coast | Heat, humidity, storms | Enclosed or climate-controlled | Steady all year |
| West / Mountain | UV exposure, hail in some areas | Covered or enclosed | Longer use season |
I see this article as a market-read piece: climate is not just a background factor; it directly shapes lease timing, rent levels, build choices, and cash flow durability.
Boat & RV Storage: Climate Demand by U.S. Region
Regional Climate Patterns and Demand Clusters
Climate pressure doesn’t hit every market the same way. For boat and RV storage, region matters a lot. Western, Sunbelt, and Northern markets each deal with different weather risks, and those risks shape both product mix and customer demand.
Western and Mountain Markets: UV, Hail, and Covered Storage Demand
In desert and high-altitude markets, intense UV exposure wears down seals, roof membranes, tires, and graphics. Over time, that pushes more customers toward covered storage.
Across hail-prone parts of the central U.S., the risk shifts. Hail can cause major damage to fiberglass shells and roof vents, which makes fully enclosed units more appealing. If you’re looking at sites in known hail belts, fully enclosed structures usually make more sense than open or three-sided options.
Farther south, hail becomes less of the main issue. Heat and storm exposure start to drive storage needs instead.
Sunbelt and Gulf Coast Markets: Snowbird Patterns, Heat, and Storm Exposure
Sunbelt and Gulf Coast markets tend to follow snowbird migration. That pattern drives winter demand and off-season storage needs, which creates fairly predictable peak demand windows and a busy leasing season heading into fall.
Heat and humidity bring another problem: moisture. That can increase the risk of interior mold and mildew in high-end boats and RVs. As a result, demand often leans toward climate-controlled enclosed storage.
Coastal markets add one more layer. Storm and hurricane exposure can shift customer preference toward hardened enclosed structures with high wind-load ratings.
Northern markets, by contrast, move the focus away from short-term weather events and toward long idle periods.
Northern Markets: Longer Winter Storage Seasons and Indoor Premiums
In many Northern markets, the storage season usually runs from October through April. Once freezes begin and road salt use starts, open-air storage becomes less practical. Vehicles may sit idle for months, facing heavy snow loads, freeze-thaw cycles that can damage plumbing, and corrosive salt that affects undercarriages and frames.
Demand in these markets is concentrated and predictable. Customers often book earlier in the season to lock in space before winter arrives. That makes wide drive aisles and snow-load-rated roofs a must.
| Region | Primary Climate Risk | Preferred Storage Type | Key Demand Driver |
|---|---|---|---|
| Western & Mountain | UV radiation, hail | Covered or enclosed | Asset protection, hail damage prevention |
| Sunbelt & Gulf Coast | Heat, humidity, storms | Enclosed, climate-controlled | Snowbird migration, storm exposure |
| Midwest & Northeast | Snow, freeze-thaw, road salt | Enclosed | Long off-season, winterization needs |
sbb-itb-09b4138
Season Length, Occupancy Cycles, and Rent Movement
Season Length by Region and Vehicle Use Cycle
Regional weather patterns shape storage seasons and rent cycles in a pretty direct way. When climate limits how often people can use boats and RVs, those vehicles spend more time parked. That turns storage into a repeat line item for owners.
The length of the storage season has a big effect on occupancy. In Northern and Midwest markets, the pattern is fixed: winter storage usually runs about six to seven months, and occupancy tends to peak from November through April. Mountain and Western markets sit somewhere in between, with a longer use season of about nine to ten months, mostly tied to summer recreation. Sunbelt and coastal markets work differently. Demand runs year-round, so swings are softer and there isn’t the same hard stop between seasons.
That longer hold time also tends to keep tenants in place. Average length of stay often lands between 24 and 48 months, far above the 12- to 15-month average for self-storage.
Seasonal Occupancy Swings and Peak Leasing Periods
In Northern markets, leasing activity bunches up fast. About 60% to 70% of all new leases often close during two tight 45-day windows: the fall storage window in September and October, and the spring retrieval window in April and May.
Outside those windows, turnover usually stays light. It’s common to see occupancy dip by 5% to 10% in May as owners pull vehicles out for summer use. If an operator has a solid waitlist, those spots can often be filled without much delay. Still, annual averages need to reflect that swing instead of leaning on peak-month snapshots.
These patterns also affect rent movement by product type.
| Region | Typical Storage Season | Peak Occupancy Months | Rent Seasonality |
|---|---|---|---|
| Northern / Midwest | 6–7 months (fixed) | November–April | High – spikes during fall storage window |
| Sunbelt / Gulf Coast | Year-round (steady) | January–March | Low – steady year-round demand |
| Mountain / West | 9–10 months (extended) | May–September | Moderate – driven by summer recreation |
Advertised Rent Trends for Uncovered, Covered, and Enclosed Storage
Covered storage earns a clear premium over uncovered parking. Enclosed units at the top end can bring in about 2x the revenue per square foot of open parking.
In Northern markets, fall tends to offer the strongest pricing power. During the fall storage window, demand for indoor and heated storage is highly inelastic. That’s why many operators add peak-season surcharges for new leases signed in September and October. Some have also started shifting away from pure month-to-month deals and toward 6-month or 12-month seasonal blocks, which helps hold revenue through the slower stretch.
In hail-prone Plains markets and high-UV Southwest markets, enclosed units often get a 30% to 50% rent premium over covered storage during peak season. That gap comes from how each product type handles local weather, not just from geography.
Those rent patterns tie straight back to product mix and climate risk.
Climate Risk, Product Mix, and Asset Performance
Those same climate pressures also shape construction cost, insurance, and NOI.
Matching Product Type to Local Weather Risk
The right product mix at a boat and RV storage facility needs to match local weather risk. In hail-prone Plains markets across Texas, Oklahoma, Kansas, and Nebraska, demand tends to shift toward fully enclosed storage. High-end RV owners often want full enclosure to avoid hail damage and insurance claims.
In Western and Mountain markets, intense UV exposure makes covered canopy storage the minimum many customers will accept. In the Sunbelt and Gulf Coast, heat and humidity push demand toward ventilated or climate-controlled enclosed units. That usually adds about $50 to $100 per month above base enclosed rent. Climate shapes both occupancy and achievable rent, so matching product type to local weather risk is what helps keep both steady across the hold period.
That same product mix also affects site standards, insurance costs, and long-term maintenance.
Operating and Insurance Considerations by Climate Profile
Climate doesn’t just shape demand. It also affects whether a facility can keep operating after severe weather.
In high-heat markets, reinforced concrete is often needed to avoid rutting and early failure. Concrete can last 20+ years with minimal maintenance, while asphalt usually needs sealing every 3 to 5 years.
In Gulf Coast and Florida coastal hurricane zones, structural hardening is the starting point. Facilities engineered for 140+ mph wind loads come with higher up-front construction costs, but they are in a better spot to stay open after major storm events and protect income continuity. In Northern markets, snow load ratings and snow removal contracts are the parallel cost item. Canopy and roof structures need to meet local snow load specs, and 24/7 site access depends on having a dependable removal plan.
Insurance costs tend to follow these risks closely. Facilities with hardened features like wind-rated doors, fire-resistant materials, and reinforced steel can often qualify for better premium terms, which helps keep NOI steadier over time.
How Oakside Frames Climate in Feasibility and Underwriting
Feasibility models should account for climate-driven risk before capital is committed. Climate needs to be underwritten as a core operating assumption.
Oakside typically applies a Climate Sensitivity Analysis when underwriting boat and RV assets. That means stress-testing NOI against scenarios such as a 20% to 30% jump in insurance premiums or a shortened rental season caused by unseasonable weather. The point is to confirm that the debt-service coverage ratio (DSCR) stays healthy even when climate-driven expenses move the wrong way.
That analysis also shapes how Oakside looks at product mix during feasibility. In hail-prone or storm-exposed markets, a pro forma built around uncovered parking can underperform because it misses both the demand signal and the insurance cost structure. Matching the product type to the local climate profile is what helps make the income stream durable enough to hold up through a sale or refinance.
Conclusion: What Climate Trends Mean for Feasibility and Strategy
These climate patterns flow straight into feasibility, pricing, and exit value. In boat and RV storage, climate is a core market driver. It shapes where demand clusters, how long the season lasts, which unit types people want, and how rents move across each U.S. region.
Key Takeaways for Owners and Investors
For owners and investors, the message is pretty simple: climate should guide product mix, pricing, and hold strategy. Northern markets tend to have longer winter storage seasons and more concentrated demand. Sunbelt markets operate year-round, but they also bring storm and heat risk. Western and Mountain markets deal with UV and hail exposure, which often pushes renters toward covered or enclosed storage.
Product mix needs to line up with weather risk. If it doesn’t, occupancy and rent can lag. The rent gap only matters when it’s big enough to cover the added construction and operating cost. And in markets with real weather exposure, covered and enclosed units keep supporting that premium.
Facilities with covered or enclosed infrastructure also draw stronger buyer interest at exit because the cash flow is easier to underwrite. Oakside underwrites climate by testing whether the added cost of cover or enclosure is paid back through higher rent, steadier occupancy, and lower seasonal churn. The goal is to confirm that DSCR still holds even if insurance costs rise or seasonal swings go the wrong way.
Climate-aware product design is what turns seasonal demand into durable cash flow.
FAQs
How should product mix vary by region?
Base your product mix on local demographics and nearby recreation access, not national averages.
That sounds simple, but it changes a lot. A market with lots of homeowners won’t behave the same way as one with more renters. And a site near a lake won’t need the same setup as one near a dense urban corridor.
In homeowner-heavy markets, put more weight on climate-controlled units. If you’re near lakes, coastal areas, or national parks, lean into open paved lots or canopy-covered spaces for boat and RV users.
Urban-adjacent sites may support premium add-ons like wash bays and power hookups. Suburban and exurban sites should line up with HOA rules and the amount of land you can actually use.
In short, the right mix comes from what people nearby own, how they live, and where they spend their free time.
When do rents and occupancy peak?
For boat and RV storage, rents and occupancy usually hit their high point from spring into early summer, with the most consistent peak showing up between May and September.
Some markets also see a bump in the fall as snowbirds head south. And in areas where space is tight, facilities can stay above 90% occupied and still keep moving rents up.
Is enclosed storage worth the extra cost?
Yes, enclosed storage is often worth the extra cost.
Open lots usually cost $75 to $150 per month, but they leave your RV, boat, or trailer out in the open with no shield from sun, rain, wind, or snow.
Fully enclosed units, which often run $150 to $400+ per month, give you much better protection from weather, theft, and UV damage. That price jump can make a lot of sense if you own a high-value asset or live in a harsh climate. In those cases, enclosed storage can help prevent costly fiberglass oxidation and structural degradation.