Population growth alone does not fill boat and RV storage. I look first at who is moving, what they own, and whether they can park at home.
If I were sizing demand fast, I’d focus on four things:
- In-migration with the right household profile: higher-income households, retirees, and owners more likely to bring boats or RVs
- Parking limits: about 85%–86% of HOAs restrict on-site RV or boat parking
- Seasonal movement: snowbirds can support demand in both home and destination markets
- Local supply and timing: even strong inflow can fall flat if too much new space opens nearby
A few numbers frame the market: the U.S. has about 11.8 million registered boats, and about 11.2 million RV-owning households. From July 2020 to July 2024, the South added about 2,685,000 net domestic migrants, with Florida alone at about 810,000. Those moves matter most when incoming households land in smaller-lot housing, HOA communities, condos, or 55+ projects where home parking is limited.
I’d also separate market types early. Northern markets often lean on winter storage. Sun Belt markets often have two peaks: snowbird season and warm-weather boating or travel. Recreation corridors near lakes, parks, and RV resorts often peak in summer. That timing changes occupancy, lease length, and pricing.
Here’s the short version: migration helps storage demand only when it lines up with ownership, parking pressure, seasonality, and tight supply. That’s the lens I’d use before trusting headline population growth.
In-migration and long-term demand by market
In-migration matters most when it brings in households with the income and vehicle ownership that support off-site storage use. Between July 2020 and July 2024, the South added about 2,685,000 net domestic migrants, a shift that changed demand across many Sun Belt storage markets. Florida took in about 810,000 of those migrants, while North Carolina, South Carolina, Tennessee, and Arizona each posted net gains above 200,000 during the same stretch.
That leads to a practical question: which migration flows actually turn into local storage demand?
Which in-migration patterns carry the most weight
For feasibility work, the best lens is local rather than statewide. County and metro migration flows are what shape site-level decisions. IRS migration files track inflows and outflows by income and age, which helps investors judge whether incoming households are likely to own boats or RVs.
A county on the edge of a fast-growing Sun Belt metro can be a strong setup. If it shows solid inbound migration, limited dedicated storage supply per capita, and zoning that makes new projects hard to build, lease-up can move faster and rents can hold up better. On the flip side, older metros can lag when supply grows faster than demand.
Migration metrics to test during feasibility review
The most useful metrics in a boat and RV storage feasibility study are net domestic migration, county-to-county and state-to-state flow data, household mobility rates, and the direction of urban-to-suburban or exurban movement near the subject site. Together, these data points show whether a market is pulling in households from other places and whether that growth is close enough to the proposed facility to affect performance.
These patterns don’t play out the same way in fast-growth markets and places with little migration.
Comparison table: High-growth markets vs. flat-migration markets
| Metric | High-Growth Markets | Flat-Migration Markets |
|---|---|---|
| Net domestic migration | Strong, sustained positive inflows | Little to no net inflow |
| Boat & RV registration intensity | Typically stronger | More dependent on replacement demand |
| Dedicated storage supply per capita | Often tighter relative to demand | More balanced or supply-heavy |
| Occupancy and rent trend | Stable to high occupancy; firmer pricing where supply is limited | More competitive; limited pricing power |
The pattern is pretty clear: migration helps most when supply stays tight. Even a market with positive migration can disappoint if new supply hits faster than demand grows.
The next filter is retiree relocation and seasonal movement, which can create demand in both origin and destination markets.
sbb-itb-09b4138
Retiree relocation and seasonal movement
Retiree migration creates steady demand for boat and RV storage. The reason is pretty simple: many older households keep their recreational vehicles, but later move into smaller homes with less room to park them. So this isn’t just about population growth. It’s a direct signal of off-site storage demand.
Retiree-heavy markets and ownership intensity
RV ownership is highest among people ages 55 to 64, at roughly 13% to 14%. About 10% of American householders over 55 own an RV, versus 8.9% of those ages 35 to 54.
That makes markets with a large 65+ population worth a close look, especially when they also have strong homeownership and above-average income. Homeowners are more likely than renters to own long-life recreational assets. And retirees with income from pensions, Social Security, or investments often keep paying storage fees even when they use the vehicle less during part of the year.
A lot of retirees also downsize into smaller homes, condos, or age-qualified 55+ communities. That’s where the storage angle gets more direct. On-site parking for large vehicles is often limited or banned outright. Florida’s HB 1203 strengthens owners’ ability to store boats and RVs if they are not visible from the parcel’s frontage or adjacent parcels. Even so, many larger units still need off-site storage. Ownership stays high, parking options shrink, and storage facilities pick up the spillover. Once a household moves into a restricted community, storage often stops being a nice extra and becomes a must-have.
How snowbird flows create demand at both ends of the route
Snowbird migration can support storage demand in both the origin and destination market. For example, a retiree might keep an RV near a winter destination so they don’t have to tow it long distances every year. At the same time, they may also pay for storage near their main home for summer use. One household can end up supporting two facilities.
Gerontological research estimated about 818,000 snowbirds in Florida during peak winter season, falling to around 119,000 in late summer. Arizona gets about 100,000 Canadian snowbirds each year. Canadians also own or rent an estimated 100,000 homes in the state and spend about $1.5 billion per year there. Those movement patterns are large, seasonal, and fairly predictable, which makes timing a useful input when underwriting occupancy curves.
Sun Belt markets that mix retiree density, HOA-governed housing, and strong RV or boat ownership tend to be prime storage nodes. The table below shows what that looks like by micro-market type.
Comparison table: Retiree-focused micro-markets
| Micro-Market | Retiree Profile | Seasonal Resident Concentration | Parking/HOA Conditions |
|---|---|---|---|
| Southwest Florida | High retiree concentration | High | Common in newer and age-restricted communities |
| Phoenix and Tucson metros, AZ | Strong 55+ and snowbird base | High | Common in 55+ and master-planned communities |
| Carolinas’ coastal and near-coastal zones | Growing retiree and second-home base | Moderate to high | Increasing in planned communities |
| Texas coastal markets and Hill Country lakes | Mix of retirees, boaters, and seasonal visitors | Moderate to high | Variable, with more restrictions in newer subdivisions |
| Central Florida lake corridors | High retiree concentration near recreation assets | High | Common limits on visible parking |
These migration patterns also drive seasonal occupancy swings, which the next section breaks down.
Seasonality, occupancy patterns, and operating implications
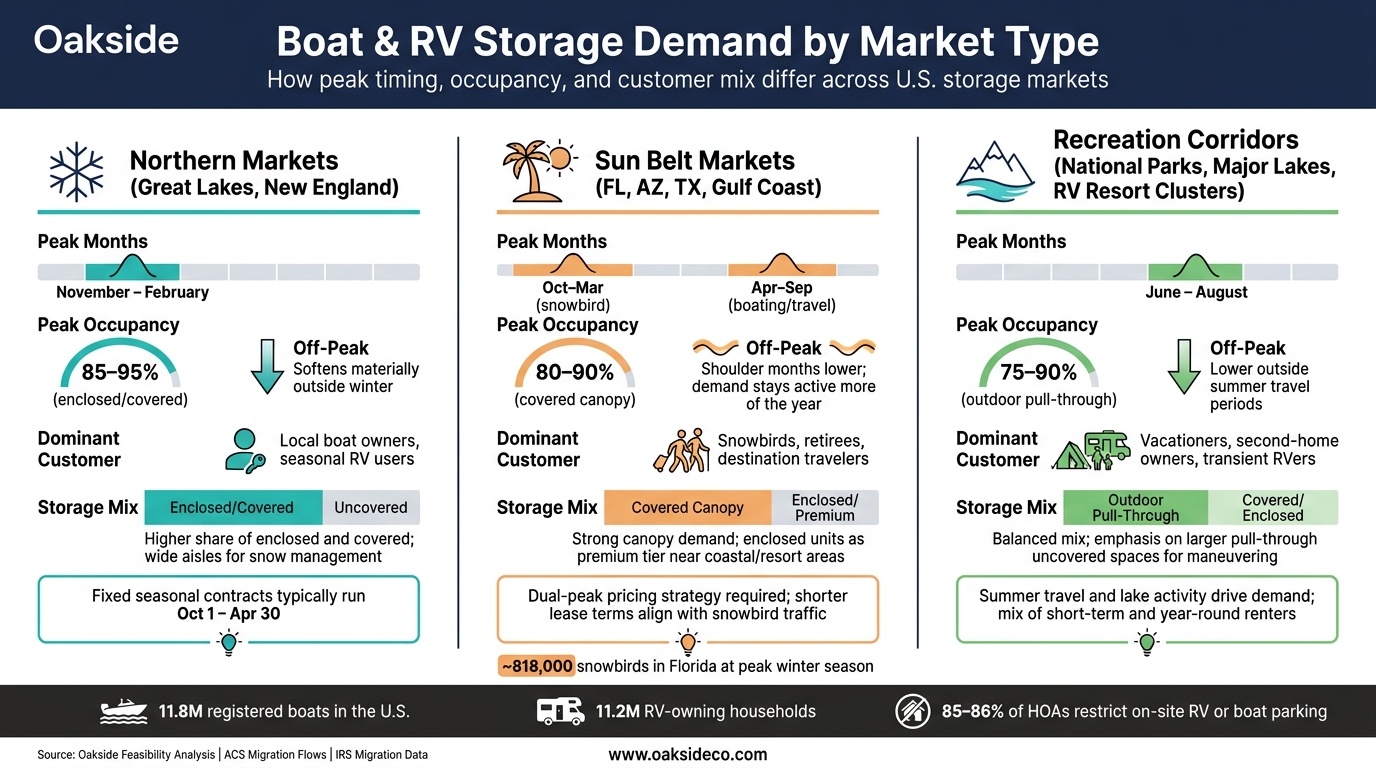
Boat & RV Storage Demand by Market Type: Northern vs. Sun Belt vs. Recreation Corridors
Once migration builds the customer base, seasonality decides when that demand shows up in occupancy. And for boat and RV storage, timing changes almost everything: lease length, unit mix, pricing windows, and day-to-day operations.
This isn’t just about who rents space. It’s about when they arrive and how long they stay.
Typical demand cycles for boat and RV storage
Northern markets – Wisconsin, Michigan, Minnesota, and New England – tend to follow a winter storage cycle. Demand starts climbing in October, peaks from November through February, and then cools off in March and April as owners pick up their boats and RVs for the season. In many of these markets, operators use fixed seasonal contracts that run from about October 1 through April 30. Some marina winter storage programs set the season from October 15 to April 15 and charge penalties for boats that remain past May 30.
Sun Belt markets work a bit differently. They usually get two demand peaks: snowbird season from late fall into early spring, then boating and travel demand in late spring and summer. That means demand shows up at both ends of the route, not only in the winter destination market. October and April often act as shoulder months, while November through March is the stretch when Sun Belt operators can push occupancy and pricing the hardest.
Markets near national parks, major lakes, and RV resort clusters usually peak in summer. Vacation travel, lake activity, and second-home ownership drive a lot of that demand. These areas often serve a mix of short-term renters passing through and local owners who store year-round.
That’s why monthly operating data tells a much clearer story than annual averages. Annual numbers can smooth over the spikes and dips that drive leasing and pricing.
Operating data that sharpens underwriting
Underwriting should follow monthly occupancy by unit type, covered versus uncovered absorption, and seasonal churn across local owners, snowbirds, vacation travelers, and commercial users. When operators break demand out by unit type, they often find that larger back-in or pull-through RV spaces and outdoor drive-up boat spaces lease up before smaller trailer spots.
Weather matters too. Freeze days, snowfall, extreme heat, hail frequency, and hurricane risk all shape what renters will pay more for. In plain terms, climate pressure affects the premium on covered or enclosed storage.
Campground and marina calendars also have a direct effect on nearby storage demand. If a local marina pulls boats from the water in mid-October, nearby storage sites will often see occupancy jump right after.
"Monthly occupancy by unit type shows where demand is concentrated and which unit mix the market will actually absorb." – Cameron Vale, President at Oakside
Comparison table: Northern, Sun Belt, and recreation-corridor markets
| Region | Peak Months | Typical Peak Occupancy | Off-Peak Occupancy | Dominant Customer Segment | Covered/Uncovered Mix |
|---|---|---|---|---|---|
| Northern (Great Lakes, New England) | Nov–Feb | 85–95% (enclosed/covered) | Softens materially outside winter | Local boat owners, seasonal RV users | Higher share of enclosed and covered; wide aisles for snow management |
| Sun Belt (FL, AZ, TX, Gulf Coast) | Oct–Mar (snowbird); Apr–Sep (boating/travel) | 80–90% (covered canopy) | Shoulder months are lower; demand stays active across more of the year | Snowbirds, retirees, destination travelers | Strong canopy demand; enclosed units as premium tier near coastal or resort areas |
| Recreation Corridors (national parks, major lakes, RV resort clusters) | Jun–Aug | 75–90% (outdoor pull-through) | Lower outside summer travel periods | Vacationers, second-home owners, transient RVers | Balanced mix; emphasis on larger pull-through uncovered spaces for maneuvering |
Different demand cycles call for different pricing calendars. Northern facilities can often support winter premiums and off-season concessions. Sun Belt assets usually need dual-peak pricing and shorter lease terms that line up with snowbird traffic and boating season.
Migration data sources and feasibility takeaways
Once seasonality is clear, the next step is to test it against migration and registration data.
Core public and private data sources
Start with three public datasets: ACS migration flows, IRS migration data, and Census population estimates.
ACS migration flows show where households came from and where they moved. They also include useful cuts by age, income, and tenure. For smaller trade areas, the 5-year files are often more useful because they’re more stable for small-area analysis than annual point-in-time data.
IRS migration data covers tax filing years 1991–2023 and adds an income view. It tracks net inflows and outflows of tax filers by county and state.
Census population estimates help separate migration from natural change. Age mix matters here because county estimates rely on IRS data for ages 0–64 and Medicare data for ages 65+.
Those datasets show who is moving. Registrations and local comps help answer the next part: does that movement turn into boat and RV storage demand? County- or ZIP code-level registration counts can estimate the local ownership base, while operating comps tie that estimate to actual demand.
Oakside combines migration, registration, and operating data in feasibility and disposition underwriting.
What to prioritize during market feasibility review
Focus on the data that best predicts paid storage demand.
The inputs that tend to matter most are net migration trend, the share of inbound households made up of retirees or higher-income earners, and registration intensity relative to local household counts. HOA covenants and parking rules also matter because they can push owners into paid storage. That’s the key distinction: some markets grow, but not all of them absorb storage space.
The next step in underwriting is figuring out which signals carry the most weight.
| Priority Input | What It Answers |
|---|---|
| Net migration trend (ACS, IRS) | Is the trade area gaining the right household types? |
| Retiree and higher-income inflows | Will demand be durable and premium-oriented? |
| Registration intensity (state registration data) | How large is the local ownership base? |
| Seasonal occupancy patterns (operating comps) | When does demand peak, and how sharp is the swing? |
| HOA/parking restrictions (local codes) | How much demand is pushed into paid storage? |
| Existing supply depth and waitlists | Is the market already constrained or oversupplied? |
Conclusion: Key points for owners and investors
Migration, retiree moves, and seasonal relocation shape both where boat and RV storage demand shows up and when it peaks. The strongest feasibility work pairs migration data with registrations, restrictions, and monthly operating results.
FAQs
Which migration trends matter most for boat and RV storage demand?
The migration trends that matter most are pretty straightforward:
- Net in-migration linked to job growth, especially markets that hit the 1% annual growth screen
- Retiree and snowbird moves into warmer Sun Belt markets
- Household formation and downsizing into smaller homes or apartments
These shifts tend to push demand up, especially in places where home parking is limited by HOA or local rules. They also often lead to occupancy peaking in the fall, then easing in late spring.
How do HOA parking rules affect storage demand?
HOA parking rules are a main reason off-site storage demand stays strong. About 86% of homeowners associations limit boat and RV parking on residential property. On top of that, many rigs run past 40 feet, so parking them at home often just doesn’t work.
City and county rules add more pressure, especially when oversized-vehicle parking limits get tighter. In a market feasibility review, compare the share of local HOAs that ban on-site parking with county-level vehicle registration data. That side-by-side look can help you spot unmet demand.
What data should I review before underwriting a market?
Review local supply, demand drivers, and performance metrics within a defined trade area. Look at existing facilities, the development pipeline, building permits, and demographic data like population density, household growth, median income, and housing trends.
Then zoom in on hyper-local data. That includes NRSF per capita, physical vs. economic occupancy, rent trends, and the property’s last three years of financials, rent roll, occupancy history, and delinquency reports.