If I’m judging boat and RV storage demand, I don’t start with population growth. I start with jobs and income. A market can add a lot of people and still fall short on demand for larger parking units if local paychecks are too low or too uneven to support a $50,000 to $150,000+ boat or RV.
Here’s the short version:
- Income matters first. In many markets, households at $75,000+ are more likely to pay for storage, while $100,000+ households are more open to covered or enclosed parking.
- Job mix matters next. Healthcare, government, manufacturing, logistics, energy, and skilled trades tend to support steadier monthly storage payments.
- Seasonality matters too. A market can show strong ownership but still have uneven occupancy if local work rises and falls during the year.
- Local rules can add demand. About 65% of RV owners live in neighborhoods with some type of parking restriction, which can push them off-site.
- For underwriting, I’d check the five-mile trade area first. Median household income, employer base, wage stability, and five-year growth tell me more than headcount alone.
Put simply: boat and RV storage demand comes from households that can buy, finance, and keep paying. That’s why I’d treat income bands, employer quality, and seasonal work patterns as the main screen before setting unit mix or pricing.
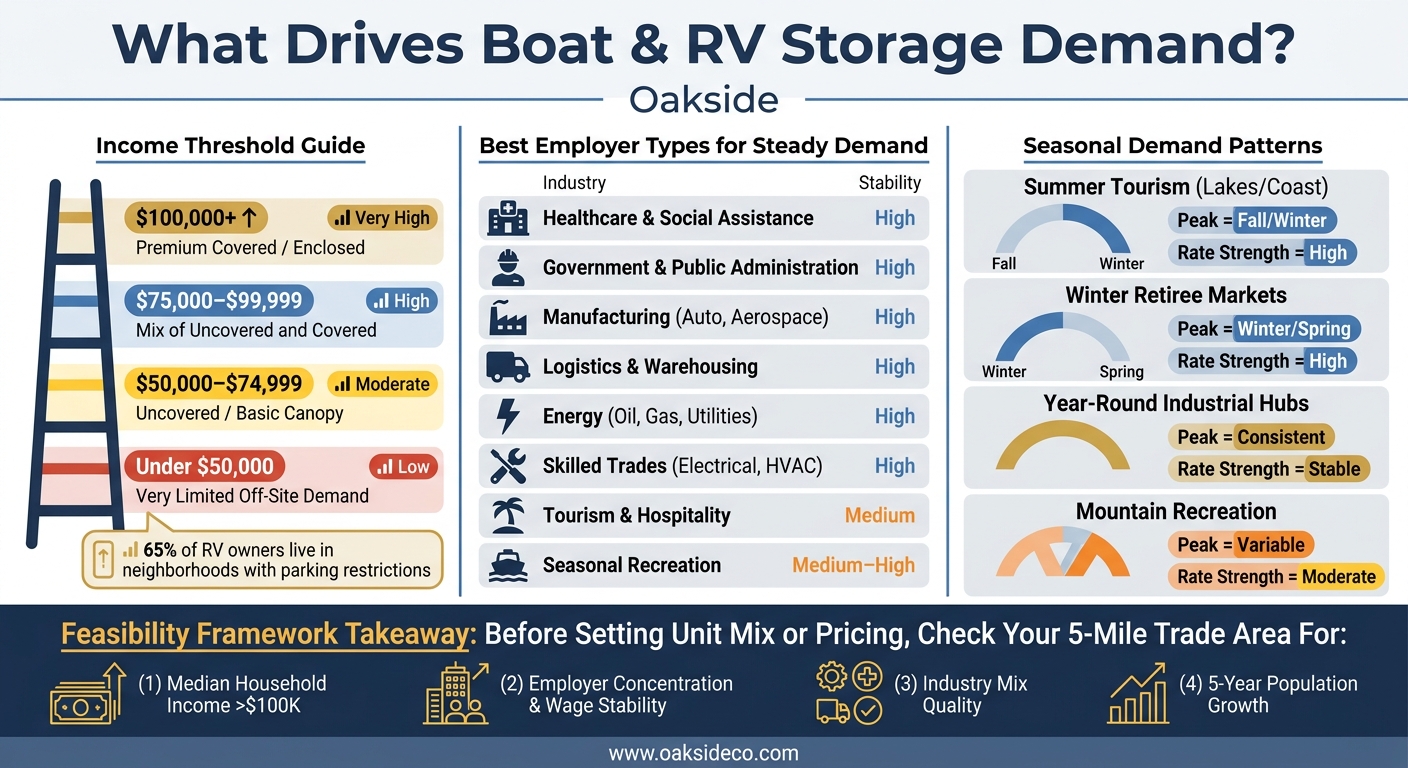
Income Bands & Industry Mix: What Drives Boat and RV Storage Demand
Income Bands That Drive Demand for Larger Parking Units
For boat and RV storage, income distribution often tells you more than raw household count. A smaller market with more higher-income households can beat a bigger trade area with lower incomes. After that, the next check is simple: are incomes high enough to support covered or enclosed parking?
How $60,000 to $100,000+ Households Generate Storage Demand
Boat and RV ownership isn’t cheap. People need extra cash for insurance, maintenance, fuel, towing, and storage. That’s why income bands help you estimate who can support uncovered, covered, or enclosed parking.
In many feasibility models, $75,000 works as a practical threshold. Below that level, demand tends to lean toward uncovered parking. Above it, households are more likely to pay for covered or enclosed parking. Once you get to $100,000+, price pushback usually eases, and demand often shifts toward premium covered or enclosed parking.
There’s another piece here too. In higher-income neighborhoods, HOA rules and parking limits can push owners to look for off-site storage. Roughly 65% of RV owners live in neighborhoods with some form of parking restriction.
Table: Income Brackets vs. Boat and RV Storage Potential
| Household Income Bracket | Ownership Propensity | Rate Sensitivity | Likely Parking Demand |
|---|---|---|---|
| Under $50,000 | Low | Very High | Very limited off-site demand |
| $50,000 – $74,999 | Moderate | High | Uncovered / Basic Canopy |
| $75,000 – $99,999 | High | Moderate | Mix of Uncovered and Covered |
| $100,000+ | Very High | Low | Premium Covered / Enclosed |
Income shows who can buy. Industry mix helps show whether those paychecks are steady enough to keep occupancy in place.
One caution: income bands don’t mean the same thing everywhere. In a higher-cost market, a household earning $100,000 may have less room in the budget than a household at the same income in a lower-cost area. So feasibility models should adjust for local cost-of-living differences instead of treating these brackets like fixed rules.
Cost of living matters, but the next feasibility filter is whether the local employer base can support steady demand over time.
sbb-itb-09b4138
How Local Industry Mix Affects Boat and RV Ownership
Income shows who can buy. Industry mix shows who can keep paying. After that, the next thing to check is simple: do local paychecks come from steady employers or from work that swings with the season?
Industries That Support Steady, Recurring Storage Demand
Stable, year-round sectors give you the strongest base for recurring storage demand. Healthcare systems, local and state government agencies, manufacturing plants, logistics and warehousing operations, and energy-related employers have one thing in common: they tend to pay steady wages on predictable schedules. That makes workers in these fields more likely to support multi-year storage contracts and keep up with monthly payments for larger parking units.
Skilled trades are worth a closer look. Electricians, plumbers, HVAC technicians, and general contractors often rely on trailers and specialty vehicles for work. At the same time, many also own boats, travel trailers, and fifth wheels for personal use. That overlap can drive demand from both sides – work and recreation – for oversized parking units. And this kind of demand often holds up better when the economy cools off a bit. Put plainly, it can put more pressure on larger parking spaces.
Energy jobs can also play a big role. They often come with strong pay and rotating schedules, which can support RV ownership and add demand for secure storage close to home.
Table: Local Industry Categories vs. Storage Demand Impact
| Industry Category | Income Stability | Ownership Propensity | Storage Demand Impact |
|---|---|---|---|
| Healthcare & Social Assistance | High | Moderate–High | High |
| Government & Public Administration | High | Moderate–High | High |
| Manufacturing (Auto, Aerospace, Consumer Goods) | High | High | High |
| Logistics, Warehousing & Transportation | High | High | High |
| Energy (Oil, Gas, Utilities, Renewables) | High | Very High | High |
| Skilled Trades (Construction, Electrical, HVAC) | Moderate–High | Very High | High |
| Tourism & Hospitality | Low–Moderate | Moderate | Medium |
| Seasonal Recreation & Marine Services | Moderate | High | Medium–High |
Coastal resort towns and lake communities often post high boat ownership rates per household. That’s a clear demand signal. But there’s a catch. Hospitality workers – servers, hotel staff, seasonal guides – often depend on tips or part-time work. That can make recurring storage payments less steady and make customers more sensitive to rate changes. So yes, the ownership may be there. The payment pattern may be less steady.
The next filter is seasonality: some markets support ownership, but not steady storage payments.
How Seasonal Employment Patterns Affect Larger Unit Demand
Seasonal job cycles can swing boat and RV storage demand just as much as ownership rates. In seasonal markets, strong ownership alone doesn’t lead to steady demand when jobs and visitor traffic rise and fall during the year. That timing shapes both lease-up speed and unit-mix choices.
What Seasonal Work Means for Occupancy, Rates, and Lease-Up
Boat and RV storage in seasonal markets often follows a reverse occupancy cycle. In northern lake markets, fall move-ins often push occupancy to its high point, while spring tends to bring the biggest wave of move-outs. Winterization can support the strongest pricing, especially for covered space. To steady revenue, seasonal markets often need 6- or 12-month terms, or annual prepay. Those timing shifts should flow straight into underwriting assumptions.
In seasonal recreation areas, nearby year-round job centers can matter more than the local population. Put simply, the income profile of those employment hubs may deserve more weight than the local seasonal headcount when you’re underwriting boat and RV demand.
The table below shows how different seasonal markets tend to map to storage behavior.
Table: Seasonal Demand Profiles vs. Expected Storage Behavior
| Market Profile | Typical Seasonal Window | Peak Demand Period | Rate Strength | Demand for Covered/Enclosed |
|---|---|---|---|---|
| Summer Tourism (Lakes/Coast) | 6–8 months (off-season storage) | Fall/Winter | High during the pre-freeze rush | High – protection from winter weather |
| Winter-Season Retiree Markets | 4–6 months (peak season) | Winter/Spring | High in Q4 and Q1 | Moderate – primarily sun protection |
| Year-Round Industrial Hubs | 12+ months (steady) | Consistent year-round | Stable, inflation-indexed | High – security for high-value assets |
| Mountain Recreation Markets | Variable (seasonal) | Around mud season/winter | Moderate | High – snow load and weather protection |
Use these patterns to build the employment-based feasibility framework below.
Building an Employment-Based Feasibility Framework
Those three demand drivers lead to a simple feasibility screen. In boat and RV storage underwriting, employment data is one of the main inputs. Income bands, industry mix, and seasonal work cycles shape how you size units, price them, and estimate lease-up timing. Use this screen before you lock in unit mix or pricing.
What to Review Before Committing to Unit Mix or Pricing
Before you settle on a unit mix or pricing plan, review local wage and job data for the five-mile trade area around your site. Start with median household income. As a first filter, focus on five-mile markets with median household income above $100,000 and solid five-year growth when you’re testing demand for premium covered and enclosed storage.
Then look at employer concentration, wage stability, and job growth. Sites near large employers often show steadier occupancy, better rate hold, and a shorter lease-up period. Five-year population growth projections matter too. They can help show whether demand is likely to build fast or stay more even over time.
Key Takeaways for U.S. Boat and RV Storage Feasibility
When the employment profile is strong, it’s easier to support a higher share of covered and enclosed units. Use income, industry stability, and seasonality together to size larger parking supply and set pricing. Put simply, the employment profile – especially how much covered or enclosed parking the market can support – should guide this call, with income, industry mix, and seasonal patterns doing the heavy lifting behind it.
FAQs
Why do jobs matter more than population for boat and RV storage demand?
For boat and RV storage, jobs often matter more than raw population. A market’s employment base says a lot about its long-term economic health and day-to-day stability. If local jobs are strong – especially in sectors that tend to hold up over time – demand is often steadier than in places where population growth is tied to short-term shifts.
Workforce household formation matters too. So do younger professionals, who can shape how much storage a market uses and how that demand grows over time. As Nolen Masserman, Managing Director at Oakside, notes, data-driven local market insight is key to identifying real growth potential.
What income level usually supports covered or enclosed storage?
Higher-income areas tend to have the strongest demand for premium storage, especially covered and fully enclosed RV and boat units.
In a lot of markets, that means household incomes above $100,000. That said, the right cutoff isn’t the same everywhere. Local costs and regional economic conditions can shift what customers are willing to pay.
Oakside notes that reviewing local demographics – especially median income – can help show whether a market can support the higher rents needed for weather-protected storage.
How does seasonal work affect boat and RV storage occupancy?
Seasonal jobs and local recreation habits can have a big effect on boat and RV storage occupancy. In areas near lakes and coastlines that draw heavy tourist traffic, demand tends to climb during peak boating and camping months.
In snowbird markets like Florida and Arizona, occupancy usually tops out in the fall and starts to ease in late spring. As Nolen Masserman, Managing Director at Oakside, notes, these seasonal swings can affect annual net operating income in markets with shorter usage seasons.