Boat and RV storage is growing because demand is outpacing supply. I’d boil the whole market down to this: more people own boats and RVs, fewer can store them at home, and there still aren’t enough purpose-built facilities to meet that demand.
By the numbers, the article points to a market that grew to $1.8 billion in 2024 and could reach $4.1 billion by 2031 at a 12.5% CAGR. It also shows a sharp supply gap: roughly 25 million U.S. households own a boat, an RV, or both, while there are fewer than 2,000 dedicated facilities serving them.
If I had to summarize the 10 drivers in plain English, they are:
- More owners: a bigger installed base of boats and RVs needs storage
- Younger buyers: demand now comes from more age groups, not just retirees
- More recreation use: people are using these vehicles more, but they still sit idle most of the year
- Less room at home: smaller lots and tighter neighborhoods leave little space
- More parking limits: HOA and city rules often block at-home storage
- Asset protection: owners will pay to protect vehicles worth $50,000 to $500,000+
- Investor interest: low churn, long stays, and strong margins are drawing more capital
- Extra income streams: power, dump stations, wash bays, and concierge services add revenue
- Modern design matters: older layouts can miss demand if stalls and aisles are too tight
- Zoning slows new supply: entitlement delays and land-use limits keep new projects from coming online fast
Here’s the short version of what that means for you: this is not a demand problem. It’s a space, layout, and zoning problem. That’s why occupancy often stays high, rents keep moving up in tight markets, and well-located facilities can trade at lower cap rates than older or poorly designed sites.
| Driver | Why it matters |
|---|---|
| Ownership growth | More vehicles need year-round parking |
| Demographic shift | Demand base is spread across more buyer types |
| Recreation spending | More active use still leads to long idle periods |
| Smaller home lots | At-home storage often doesn’t fit |
| HOA/city rules | Legal limits push owners off-site |
| Security needs | High-value vehicles support premium rent |
| Institutional capital | More buyers are chasing a small asset pool |
| Amenities | Add-ons can lift gross income |
| Layout standards | Modern rigs need bigger stalls and aisles |
| Zoning barriers | New supply is slow and costly to approve |
So if I were introducing this article in one line, I’d say this: boat and RV storage is growing because ownership is high, home storage is harder, and new supply is still hard to build.
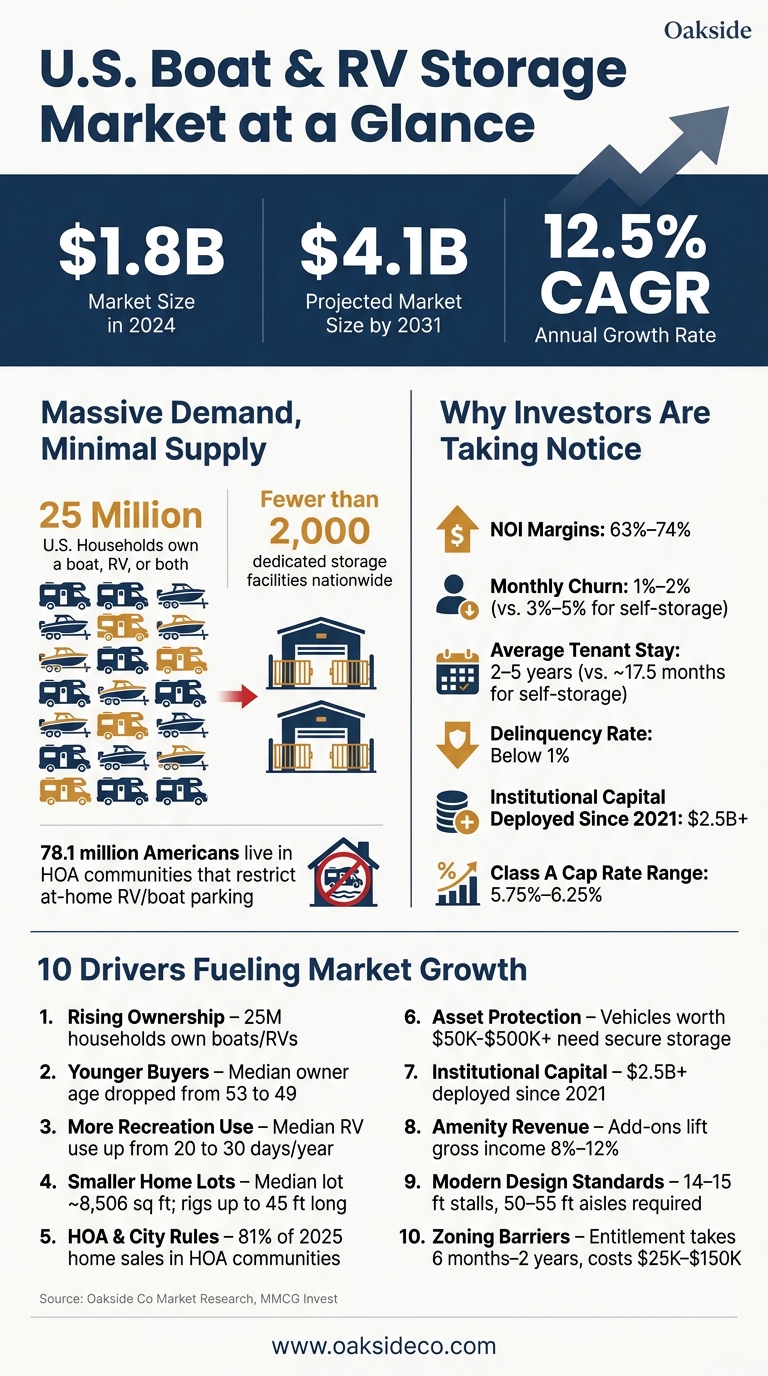
U.S. Boat & RV Storage Market: Key Stats & Growth Drivers (2024–2031)
Why Boat and RV Storage Is Attracting Investor Interest
Boat and RV storage is getting more attention from investors for a simple reason: the demand tends to stick around. Supply is tight, and the business works a lot like self-storage. Put that together, and you get steady demand for off-site parking.
How Recreational Vehicle Ownership Creates Storage Demand
A big part of the demand comes down to basic logistics. HOA rules and local ordinances often block oversized vehicles from being parked at home, and many newer subdivisions just don’t have enough room for them. That creates a steady need for storage, which helps support occupancy and pricing.
This demand isn’t tied only to new RV sales either. It comes from the fleet that’s already out there. Even if shipments slow, the roughly 25 million U.S. households that already own a boat or RV still need a place to keep it. That’s a steady demand base that doesn’t rely on new-unit volume.
Why Investors Treat This Sector as a Self-Storage-Adjacent Asset Class
Those market conditions have pushed a bigger gap between local owners and institutional buyers. Stabilized facilities can generate NOI margins of 63% to 74%, monthly churn tends to sit at 1% to 2%, and average tenant tenure runs two to five years. That’s much longer than the roughly 17.5 months often seen in traditional self-storage.
There’s another factor too: many tenants are storing high-value assets worth $50,000 to $500,000. Because of that, they’re usually less likely to switch facilities over a small rent change, which gives owners more room on pricing.
Most of the sector is still held by smaller operators. About 85% to 90% of facilities remain in independent or family ownership. Oakside Co tracks this niche because fragmented ownership and strong margins can create acquisition openings for institutional capital.
sbb-itb-09b4138
1. Rising RV and Boat Ownership
About 25 million U.S. households own an RV, a boat, or both. That number matters more than yearly sales. Storage demand follows the fleet that’s already out there, not just what sold this month or last quarter. So when ownership goes up, storage demand tends to go up right along with it.
You can see that in pricing. Market rents for dedicated RV and boat parking were up 4.4% year over year as of September 2025, which shows demand can stay firm even when vehicle sales move around.
Why Home Storage Isn’t an Option for Most Owners
For a lot of owners, keeping an RV or boat at home just doesn’t work. The median new single-family lot is about 8,506 square feet, while Class A motorhomes and fifth wheels are often 32 to 45 feet long. Add in new-subdivision setbacks that can be as narrow as 7.5 feet, and the math gets tight fast.
Then there’s the rule issue. 78.1 million Americans live in community associations, and 81% of 2025 home sales were in one. HOA and city rules often limit oversized vehicles in driveways, yards, and on the street. So even if someone has the vehicle, they may not have a legal or practical place to keep it at home. When that happens, off-site storage becomes the default.
What This Means for Rent Growth and Occupancy
When home storage is squeezed, occupancy and rents tend to move up. Carraway RV and Boat Storage in Magnolia, Texas, held 97% occupancy from 2021 through 2024 while lifting rents from $4.69 to $5.35 per square foot. That kind of steady demand helps explain why this part of the storage market keeps holding up – and it sets up the next driver: who’s buying these vehicles.
2. Shifting Owner Demographics
RV and boat owners look different than they did a few years ago. The median RV owner age dropped from 53 in 2021 to 49 in 2025, and first-time owners now account for 36% of the market. That change brings a larger pool of people who need a place to keep these vehicles when home parking isn’t an option.
Why the Demand Base Is Durable
This demand doesn’t come from just one group. It now spans retirees, mid-career buyers, and younger first-time owners.
Younger owners, in particular, often need off-site storage. HOA rules and neighborhood parking limits can make it hard, or flat-out impossible, to keep an RV or boat at home. So even if someone owns the vehicle, they still need a separate place to store it.
What This Means for Asset Valuation
A broader renter base can help owners hold pricing. And the customer profile here matters: people rarely walk away from high-value vehicles. That’s one reason delinquency stays below 1%.
That steadiness can support self-storage cap rates and stronger values. Stabilized Class A RV and boat storage assets have compressed into the 5.75% to 6.25% cap rate range.
3. Growth in Outdoor Recreation Spending
Owners are using RVs and boats more often. Median annual RV use climbed from 20 days in 2021 to 30 days in 2025. That matters for storage operators. People who use their RVs more need a secure place to keep them between trips, not just a spot to park. More travel also means more downtime between outings, and that parked time has to go somewhere.
The larger recreation economy adds to that demand. In 2025, 52 million U.S. households camped, and 33% of Gen Z campers were actively considering RV ownership. That points to a growing pipeline of future storage tenants.
How Spending Translates Into Storage Demand
Storage demand follows the installed fleet, not monthly shipment volume. So even when new RV shipments dropped 13.5% in early 2026, storage rents still increased 4.4% during the same period.
The idle-time numbers make the case pretty clear. The median RV sits unused for about 340 days per year, while boats average just 54 days of use each year. That creates a recurring need for off-site storage. Put simply, secure parking becomes a must between trips.
What This Means for Occupancy and Rents
Facilities in recreation-driven markets – near lakes, coastlines, and national parks – often do better because owners like to store vehicles close to where they use them. When heavy recreation demand runs into limited local supply, occupancy and rents usually move up with it.
Outdoor recreation spending is adding to the base of vehicles that need storage for most of the year. As usage goes up, the pressure shifts to a simple issue: where owners can legally and practically keep these vehicles at home.
4. Urbanization and Less Residential Storage Space
As ownership has spread, the main bottleneck has shifted. It’s no longer just about who wants an RV or boat. It’s about where people can put one once they own it.
Urbanization has made at-home RV and boat storage hard for a lot of owners. Large RVs and fifth wheels don’t fit well on smaller lots or tight side yards, so off-site storage becomes the default. That squeeze makes storage a need, not just a nice extra.
The demand also tends to stick because the limits are both legal and physical. In plain terms, people can’t just “make room” at home. That helps keep churn low at 1% to 2%, compared with 3% to 5% for traditional self-storage, and average stays run two to five years.
Carraway RV & Boat Storage in Magnolia, Texas held 97% occupancy from 2021 through 2024 while rents rose from $4.69 to $5.35 per square foot, a 14% increase.
That pattern feeds straight into asset performance. Low churn and steady occupancy help support predictable NOI and tighter cap rates.
5. Asset Protection, Security, and Value Retention
Once at-home storage is out, protection becomes the main issue. In this segment, many vehicles are worth $50,000 to $500,000+. And they often sit outside for most of the year. That means more sun exposure, more weather wear, and more theft risk.
What Drives the Premium
Professional facilities give owners a level of protection that most homes simply can’t. That usually includes perimeter walls or fencing, 24/7 camera surveillance with license plate recognition, gated entry with individual PIN codes, and bright LED lighting. Some sites also offer covered, enclosed, or climate-controlled storage, which adds more defense against damage.
| Storage Type | Avg. Monthly Rent | Protection Level |
|---|---|---|
| Open Lot | $75–$150 | Perimeter security only |
| Covered Canopy | $125–$250 | UV, rain, and hail protection |
| Fully Enclosed | $150–$400 | Full weather and theft protection |
| Climate-Controlled | $300–$500+ | Temperature and moisture management |
Those rent premiums show something pretty simple: owners will spend more to protect expensive property. And that willingness to pay feeds directly into pricing power and retention.
How Security Translates to Returns
This is where the business case gets interesting. People are not likely to walk away from a high-value boat or RV because of a small rent bump.
At dedicated boat and RV storage facilities, monthly churn is only 1% to 2%, versus 3% to 5% for self-storage. Delinquency rates stay below 1%. Customer stay is usually 2 to 5 years. Insurance enrollment at professional facilities falls between 60% and 85%.
For investors, those numbers point to steadier cash flow and stronger valuation multiples. That’s a big part of why larger buyers are watching the space more closely.
6. Institutional Capital Moving Into Boat and RV Storage
Stable cash flow is pulling bigger buyers into this niche. Boat and RV storage is still fragmented, but since 2021, more than $2.5 billion in specialized capital has moved into the space. That points to a clear shift toward institutionalization. When ownership is scattered and demand stays steady, buyers with deep pockets see a chance to buy, combine, and push values higher.
A lot of investors look at this asset class and see a model that feels close to self-storage: low overhead, recurring demand, and room to improve revenue. The supply picture also stands out. There are fewer than 2,000 dedicated facilities serving about 25 million owning households, which leaves a big gap between supply and demand. That gap gives institutional capital room to price aggressively.
Put simply, money is flowing toward facilities that can support more revenue per site. And because demand tends to repeat, many buyers can still underwrite deals with confidence even when vehicle sales cool.
Rent growth has also come in ahead of expectations, pushed by the structural gap between limited supply and durable demand. For institutional buyers, that setup is a big part of the appeal.
7. Revenue Gains Through Amenities and Ancillary Services
Once occupancy is steady, the next move is simple: grow revenue with add-ons.
Amenities and ancillary services can add 8% to 12% to a facility’s gross income. That extra income can also lift NOI and property value. The main add-ons here are dump stations, power hookups, wash bays, and concierge-style services.
The pricing can stack up fast:
- Dump station access: $15 to $25 per month
- 30-amp power: about $25 per month
- 50-amp power: $30 to $40 per month
- Concierge packages: $50 to $150 per month
These upgrades appeal to owners of higher-end rigs, especially those that need battery charging and climate control. Concierge service adds another layer of convenience. In some cases, staff can move and prep rigs before a trip, which helps owners avoid squeezing large vehicles through tight spaces.
Amenities also help keep tenants in place. Owners with rigs worth $50,000 to over $500,000 usually don’t want to switch facilities just to save a little on rent if they’re getting better protection and convenience where they are. Put plainly, a stronger amenity package makes tenants less likely to leave over small price gaps.
That mix of ancillary income and premium services can push NOI margins to 70% to 74%. Insurance can add one more recurring income stream. And when a facility has those extra revenue layers, it may trade more like a Class A asset, where cap rates are often 5.75% to 6.25%, compared with 7.5% to 8.5% for Class B assets.
There’s a catch, though: those gains depend on a layout that can handle the upgrades.
8. Design Standards and Functional Obsolescence Risk
RVs and trailers are bigger than they used to be, and that shift has changed what storage sites need to look like. Many older layouts just don’t fit the current market anymore. Class A motorhomes now usually run from 26 to 45 feet long, and in 2020 the RV industry removed the 430-square-foot cap on fifth-wheel trailers.
That puts pressure on older facilities. A site built around 12-foot stalls and tight aisles may struggle to handle today’s rigs. For enclosed units, current specs call for 14- to 15-foot stall widths, 14-foot door heights, and 16-foot eave heights. And width alone isn’t enough. The drive aisle has to work too.
Here’s where a lot of older properties fall short:
| Feature | Modern Standard | Older/Obsolescent Standard |
|---|---|---|
| Stall Width | 14 – 15 feet | 12 feet |
| Drive Aisle (Enclosed) | 50 – 55 feet | < 40 feet |
| Drive Aisle (Boat/90°) | 65 – 73 feet | < 50 feet |
| Door Height | 14 feet | 10 – 12 feet |
Aisle width matters just as much as stall size. Enclosed product needs 50 to 55 feet of clearance, while 90-degree boat-trailer setups may need 65 to 73 feet. If a facility misses those marks, it can slip into functional obsolescence. Put simply, the property still exists, but it no longer works well for what renters want now.
That gap shows up in pricing. Investors pay more for layouts that fit today’s vehicle mix, and they mark down sites that don’t. Modern Class A layouts trade at 5.75% to 6.25% cap rates, while older Class B assets trade at 7.5% to 8.5%.
Long waitlists can be a sign that a property’s design lines up well with market demand. Design matters a lot, but zoning still controls how much new supply can be added.
9. Technology-Driven Operations and Customer Experience
Technology now matters just as much as the physical layout. Once a site is built for today’s rigs, cloud-based systems and automation shape how well it runs day to day.
That shows up fast in the numbers. Operators that use cloud-based systems and keep on-site staffing lean can see a direct effect on the bottom line. Traditional facilities usually post NOI margins of 63% to 65%, while tech-enabled, unmanned platforms can reach 70% to 74%. The reason is pretty simple: lower labor costs, automated billing, and online leasing cut overhead.
A few tools do most of the heavy lifting:
- Cloud-based access control
- Automated billing
- Online lease execution
These systems lower labor costs and help support higher NOI. They also help meet a basic customer demand: security. For owners storing vehicles worth $50,000 to over $500,000, security isn’t a nice extra. It’s the minimum bar.
That trust tends to stick. Monthly churn at professional facilities is just 1% to 2%, in large part because tenants don’t want to move away from a setup they trust. On top of that, tech-enabled amenities can add ancillary income.
This shift matters even more because the customer base is getting younger and more digital. Many younger owners expect online reservations, app-based access, and digital billing. If you’re working with an older acquisition, the smart starting point is often simple: add online billing and automated gate access first to match current renter expectations. Then layer in more advanced features as the asset stabilizes.
Even with better operations, new supply is still held back by zoning and entitlement barriers.
10. Zoning Restrictions and Supply Constraints
Even a well-run facility can’t grow without zoning approval. And in boat and RV storage, that step is often slow, expensive, and uncertain.
Many projects need a conditional-use permit. Getting entitled can take six months to two years and cost $25,000 to $150,000 before financing even enters the picture. In this sector, zoning is often the biggest development risk because many cities view these sites as low-job, low-sales-tax uses.
That bottleneck matters. When new supply is hard to approve, existing facilities often keep more pricing power. Across at least 15 states, local governments have recently put moratoria or outright bans on new storage development in place.
Those rules don’t just slow new construction. They also push demand toward current facilities. Boat and RV storage projects often need 7 to 10 acres, compared with 3 to 5 acres for self-storage. On top of that, setbacks, buffers, and drainage rules usually cap buildable coverage at 35% to 40%.
How Zoning Constraints Support Baseline Demand
Local restrictions can steer demand to existing facilities by shrinking the number of places where owners can store vehicles at home.
What Tight Supply Does to Rents and Occupancy
| Market | Rent Growth (2025) | 3-Year Supply Growth |
|---|---|---|
| Los Angeles | +12.8% | 0% |
| Charleston | +11.4% | 0% |
| National Average | +4.4% | 13.0% |
| Houston | +0.5% | ~20% |
| San Antonio | 0.0% | 47.9% |
Source: MMCG Invest
The pattern is pretty clear. Markets with tight supply tend to hold rent growth better than places adding a lot of new inventory. The table above points to the same idea: restricted supply can support asset value.
You can see that in pipeline data too. Under-construction supply fell to 2.3% of existing inventory in late 2025, down from 4% in 2023.
In supply-constrained markets, stabilized facilities often stay above 90% occupancy and keep waitlists. That’s why zoning due diligence sits near the center of both acquisition and disposition decisions. Entitlement risk needs to show up in every acquisition and disposition model.
Amenity Premiums and Revenue Drivers
Amenity mix has a direct effect on pricing. The jump in rent by product type is hard to ignore: covered canopy spaces often earn a 40% to 80% premium over uncovered base rates, fully enclosed drive-up units can reach $150 to $400 per month, and climate-controlled enclosed units can hit $300 to $500+. Same footprint, very different income.
A few add-on services can push revenue even further. Power hookups, wash bays, dump stations, and stronger security packages can add 8% to 12% to gross income while also helping keep tenants in place longer.
The table below shows how each amenity tier affects rent premium, lease-up, and build cost:
| Amenity / Storage Type | Rent Premium Potential | Lease-Up Impact | Relative Development Cost |
|---|---|---|---|
| Covered (Canopy) | 40%–80% over uncovered ($125–$250/mo) | High; typically leases faster than uncovered product | Moderate ($20–$30/sq. ft.) |
| Enclosed Storage | $150–$400/mo; often 100%+ over uncovered | Very high; often carries waitlists | High ($38–$65/sq. ft.) |
| Power Hookups | $25–$40/mo per stall | High; supports battery maintenance | Moderate; requires electrical infrastructure |
| Wash Bays | Bundled or $20+/use | High; major convenience differentiator | Moderate; requires plumbing and drainage |
| Dump Stations | $15–$25/mo premium | High; critical for RV travelers | Low to moderate |
These pricing and development cost ranges reflect typical U.S. market patterns.
CapEx is where the tradeoff gets real. Paved outdoor stalls cost about $15 per square foot, while climate-controlled enclosed units can run past $100 per square foot. That spread is large. But the rent spread is too.
In supply-constrained markets, owners that build or retrofit toward covered and enclosed product often lease units faster. Part of that is simple: there just isn’t enough of this product. And when covered or enclosed storage is paired with services like dump stations and power hookups, lease-up is usually about 20% faster than at standard self-storage sites.
That speed matters even more when you look at customer stay. With average tenures of 2 to 5 years, amenity investment is one of the steadiest ways to improve a facility’s income profile over time.
Those premiums only hold when the site can physically support modern rigs.
Older Layouts vs. Modern Facility Standards
Physical layout is one of the biggest drivers of boat and RV storage performance. A site can sit in a strong market and still lag if the layout doesn’t fit the vehicles people own now. Put simply: demand alone isn’t enough. The property has to work for today’s larger rigs.
Older facilities were built for smaller units and tighter traffic flow. That setup doesn’t hold up as well now. Modern sites need 14- to 15-foot stalls and much wider aisles: 50 to 60 feet for 90-degree parking or 35 to 40 feet for angled layouts.
| Feature | Older/Legacy Layouts | Modern Facility Standards |
|---|---|---|
| Stall Width | 12 ft (tight for slide-outs/mirrors) | 14–15 ft (accommodates modern rigs) |
| Drive Aisle Width | 25–35 ft | 50–60 ft for 90° parking; 35–40 ft for angled |
| Turning Radius / Circulation | Limited; dead-end aisles or tight U-turns | Designed for 45 ft rigs; one-way loops and pull-through capability |
| Max Vehicle Support | Class B/C or small boats | Full Class A, 45 ft fifth wheels, large wake boats |
These differences matter in day-to-day use. A 12-foot stall may look fine on paper, but it can feel cramped once mirrors, slide-outs, and turning space come into play. The same goes for narrow aisles. If drivers can’t move in and out without stress, the site becomes harder to rent at the top end of the market.
When a layout fits modern rigs, owners can charge more and churn tends to stay low. Enclosed units also need enough vertical clearance. That usually means 16+ foot eave heights and 12- to 14-foot roll-up doors to fit taller rigs. Miss those clearance marks, and the site can lose premium demand while taking on more entitlement risk.
Even a strong layout isn’t the whole story. A project still needs enough land and the right local approval to move forward.
How Zoning Constraints Shape Market Performance
Zoning is the main thing that limits new boat and RV storage development, and the effect changes a lot from one city or county to the next. A workable project usually needs 7 to 10 acres, which cuts down the list of possible sites before the entitlement process even starts. That lack of buildable land is a big reason existing facilities can keep pricing power.
For investors, the issue isn’t only whether a site can be developed. It’s also how tough it will be to get approval. Most projects still require a CUP or SUP, which brings approval risk, neighborhood pushback, and $25,000 to $150,000 in pre-financing soft costs. In plain English, two sites that look similar on a map can have very different outcomes once they hit the local review process. Commercial sites tend to get the most scrutiny, industrial sites often move through faster, and overlay districts usually create the highest entitlement barriers.
Then there’s the site plan itself. Even when a parcel gets approved, the amount of land that can actually earn income drops fast. Typical buildable coverage is only 35% to 40% of the total lot. Setbacks, screening walls, buffers, and stormwater detention all take their share. So a site may look big on paper, but a lot of that land won’t produce rent. That limits new supply and gives existing, well-placed facilities a stronger position.
The pattern is showing up across the market. Municipalities in at least 15 states have recently imposed moratoria or pushed storage uses into industrial zones. When supply gets squeezed, rents often move up. In March 2025, supply-constrained Chicago posted 4.2% rent growth, while San Antonio saw rents fall 1.3% over the same period. That gap says a lot: zoning friction doesn’t just slow development. It can shape revenue, value, and maximize property value at exit.
For investors, entitlement status isn’t a side issue. It’s part of the asset’s pricing, lease-up profile, and exit profile.
Oakside’s View on Market Positioning
These drivers stack on top of each other: ownership goes up, HOA rules push demand off-site, and zoning slows new supply. That’s why submarket underwriting matters so much. It helps separate deals that are priced right from deals that only look right. For Oakside, that compounding effect is the reason to start with submarket data, not national averages.
Oakside sees fewer than 5,000 dedicated boat and RV facilities nationwide, compared with about 52,000 traditional self-storage properties. That supply gap changes the way demand should be measured.
Oakside also warns against tying demand too closely to annual RV and boat sales. Sales move up and down. Their advisory approach looks at the installed fleet instead of annual sales flow, because that gives a better read on recurring demand.
How Data-Driven Advisory Supports Acquisition and Disposition Decisions
Demand analysis should lean on local vehicle registrations, seasonal population patterns, and the competitive pipeline – not self-storage square-foot benchmarks. That level of detail has a direct effect on acquisition pricing, hold-period assumptions, lease-up projections, and exit timing.
Why Sector Specialization Matters in Boat and RV Storage
The same underwriting logic carries over to design and entitlement risk. If design, zoning, or amenity assumptions are priced wrong at acquisition, returns can get squeezed in a big way. Features like power hookups and wash bays can help Class A assets stand out and support stronger revenue performance. Those factors need to be built into every acquisition and disposition model.
Conclusion
The U.S. boat and RV storage market is being pushed by demand on one side and tight supply on the other. About 25 million households own a boat, RV, or both. At the same time, 78.1 million Americans live in community associations that often limit on-site parking for large vehicles. Yet there are fewer than 2,000 dedicated, purpose-built facilities built to meet that need. Put those facts together, and the pressure on the market becomes pretty clear.
That helps explain why the sector is projected to grow from $1.8 billion in 2024 to $4.1 billion by 2031, at a 12.5% CAGR. This kind of gap between demand and available space points to a market with staying power, not just a brief upswing.
That staying power matters when assets are being priced. It comes from demand drivers that stack on top of each other: ownership growth, parking limits, and a small pool of dedicated supply. Dedicated facilities often produce NOI margins of 63% to 74%, and more than $2.5 billion in institutional capital has moved into the sector since 2021. The properties most likely to win are the ones underwritten well at the start. That’s where Oakside’s data-driven advisory can help improve acquisition and disposition outcomes.
FAQs
Why is demand so much stronger than supply?
Demand for boat and RV storage is higher than supply for a simple reason: more owners need a place to store these vehicles, and fewer can keep them at home.
About 25 million U.S. households own a boat or RV. That’s a huge group of people looking for space. But for many of them, home storage just doesn’t work. HOA rules can block driveway or street parking. Local ordinances can do the same. On top of that, lot sizes have gotten smaller, while boats and RVs have gotten bigger.
The result is a clear mismatch. There are lots of owners, but not enough places to store their vehicles off-site. As Nolen Masserman, Managing Director at Oakside, notes, this creates a persistent structural supply gap.
What makes a boat and RV storage facility more profitable?
Profitability comes from high demand in markets where supply is tight, paired with lean operating models. Open-air lots often generate net operating income margins of 63% to 65%. Tech-enabled platforms can push that figure as high as 74%, mostly because they sidestep the heavier payroll, utility, and maintenance costs that come with climate-controlled indoor storage.
Owners can also increase property value by shifting toward Class A, purpose-built facilities. These sites often include canopies, wide drive aisles, stronger security, wash bays, and electrical hookups.
Which markets have the best growth potential?
High-growth metro areas usually offer the best upside, especially when three things show up at the same time:
- rising household incomes
- dense HOA restrictions
- limited land near residential corridors
That mix tends to create strong demand.
Examples include Phoenix, Denver, Austin, Nashville, Raleigh, Charlotte, Tampa, Orlando, and parts of Southern California. Markets near major waterways or national parks also tend to stay attractive.