If I had to boil this down to one point, it’s this: self-storage demand tracks households in motion more than raw population growth. A market can add people and still post weak storage demand if few new households form, people move less, or new supply piles up too fast.
Here’s the short version:
- Household formation matters more than population growth because one household often means one storage demand point.
- Storage use is still spreading even as household growth slows. National penetration went from 11.1% in 2022 to 13.4% in 2024.
- Renters, delayed homebuyers, and older households are driving much of today’s demand.
- Moves still matter a lot, but mobility has slipped. Only 8.3% of U.S. households moved in 2024, down from 9.8% in 2019.
- Sun Belt markets still have demand, but some face pressure from too much new inventory.
- Midwest markets often look steadier because supply is lighter and rent pressure is less severe.
- For underwriting, I’d focus on household growth, renter share, apartment size, age mix, migration, turnover, and new supply.
A few numbers frame the story well. The U.S. added about 1.61 million households in 2023 and 1.56 million in 2024, but long-term growth is expected to slow to about 860,000 per year from 2025 to 2035. At the same time, more households are using storage, which means demand is coming less from sheer growth and more from who lives in a market and how they live.
Here’s the main takeaway for owners and investors: don’t underwrite storage off headline population growth alone. I’d look at local renter-heavy areas, smaller apartments, aging households, and migration flows first. Then I’d weigh that demand against the supply pipeline.
| What to watch | Why it matters |
|---|---|
| Household formation | New households create new storage demand points |
| Renter share | Renters tend to move more and have less space |
| Apartment size | Smaller units often push belongings off-site |
| Migration | Tells you where demand is arriving |
| Age mix | Younger movers and older downsizers both use storage |
| New construction | Too much supply can weaken lease-up and rents |
That’s the lens I’d use to read this market: count households, not just people; track movement, not just growth; and always compare demand with supply.
National Household Growth and Self-Storage Penetration
Recent Household Formation Trends and the Current Slowdown
The U.S. added 1.7 million households in 2022–2023, but that pace has cooled. Growth slipped to 1.61 million in 2023 and 1.56 million in 2024. Harvard’s Joint Center for Housing Studies expects about 860,000 new households per year from 2025 through 2035, down from more than 1 million per year in the 2010s.
A few forces are behind that slowdown. Housing costs are still high, mortgage rates remain elevated, and people are moving less often than they used to. Thirty-year mortgage rates hit 7.79% in October 2023, and only 8.3% of households (10.9 million) moved in 2024, down from 9.8% (12.6 million) in 2019. When fewer people move, fewer people need storage during a life transition. That drop in mobility has cut move-related storage demand by about 10%.
The next piece is just as important: who is forming households now. More of that demand is tied to renters, delayed homebuyers, and older age groups.
Storage Penetration by Household Base
Even with slower household formation, storage penetration is still moving up. National penetration rose from 11.1% in 2022 to 13.4% in 2024 – the biggest jump recorded across any two-period span in the Self Storage Association‘s recurring demand study.
Those two trends are moving in opposite directions. Household growth is slowing, but storage use is spreading across a larger share of the household base. That shifts the focus away from simple household count and toward household mix.
| Year | Approx. Net New Households | Self-Storage Penetration | Est. Households Renting Storage |
|---|---|---|---|
| 2023 | 1.61M | ~12.6% | Mid-teens millions |
| 2024 | 1.56M | 13.4% | High-teens millions |
| 2025–2035 outlook | ~860,000 per year | Low-to-mid teens % | High-teens millions |
Even small gains in penetration can add hundreds of thousands of renter households across the country. That’s a solid demand buffer at a time when the raw number of new households is getting smaller.
For owners and investors, the point is pretty simple: this isn’t just about how many households are being added. It’s also about how far storage use is spreading across the households that already exist.
To read demand the right way, local household growth needs to be looked at alongside renter share and migration patterns.
sbb-itb-09b4138
Renter Growth, Delayed Homeownership, and Age-Cohort Demand
Why Renters and Delayed Buyers Often Use More Storage
As storage use climbs, the big issue is simple: which households are behind that growth?
Renters stand out first. Smaller apartments create an immediate space problem, and that problem often leads straight to self-storage. Average new apartments shrank from 941 sq. ft. a decade ago to 887 sq. ft. in 2022. At the same time, studios and one-bedrooms made up 57% of new construction. When people have less room, overflow has to go somewhere. That helps explain why about 54% of renters say they use storage because they don’t have enough room at home.
Delayed homeownership adds even more pressure. High home prices and mortgage rates are keeping many households in rentals for longer. And with the housing supply gap estimated at about 4 million units in 2024, many people are staying put in smaller spaces while still building up furniture, seasonal items, and life-stage stuff along the way. The result is pretty straightforward: people are living like renters for longer, but their belongings keep growing.
That shows up most clearly in renter-heavy age groups and in households stuck in transition.
| Tenure | Typical Housing Constraints | Common Storage Triggers |
|---|---|---|
| Long-term renters | Smaller units, limited in-unit storage, no garages | Moves, lease expirations, roommate changes, space overflow |
| Homeowners | More square footage and garage access, but still subject to clutter | Renovations, downsizing, vehicle or equipment storage, estate transitions |
| Transitional households (graduates, relocators) | Temporary or undersized rentals; belongings may not fit the unit | First moves, job relocations, short-term leases, co-living arrangements |
Which Age Cohorts Drive the Strongest Usage Patterns
Baby Boomers post the highest current usage rate at 42%. That makes sense when you think about where they are in life. Many have decades of accumulated belongings, and many are also moving out of larger homes, handling estate transitions, or trying to sort through what stays and what goes. They often need larger units and tend to remain longer, which makes them a steady customer base for operators.
Millennials make up 35% to 40% of self-storage renters, and use within the group jumped 22% between 2023 and 2025. This is a high-mobility cohort. Urban living, frequent moves, and later home buying all feed storage use. A lot of Millennials are in that awkward middle ground: too established to live with very little, but not yet settled into homes with enough space.
Gen Z is still smaller today, with only 10% to 13% renting a unit now. But the future signal is hard to miss: as many as 50% say they plan to rent storage later. As younger adults move through several leases in their twenties, storage becomes part of the moving cycle. In renter-heavy markets, that can create a steady stream of demand tied less to long-term wealth and more to life in motion.
Boat and RV Storage Demand in Aging and Migration-Led Markets
Boomer demand also reaches past standard self-storage. Retirement migration and lifestyle vehicle ownership are helping drive self-storage vs RV storage demand, especially in Sun Belt markets and places built around outdoor living. That ties aging and in-migration directly to this part of the sector.
There are 11.2 million RV-owning households in the U.S., and the total RV fleet is estimated at 25 million units. Many owners can’t keep these vehicles at home because of HOA parking rules or simple size limits. So they turn to dedicated storage sites instead.
For operators, that matters because boat and RV storage often comes with longer stays and steadier occupancy. These trends are strongest in markets where population inflows meet tight parking rules – a mix that can keep demand humming along.
Migration Patterns and Regional Demand Differences
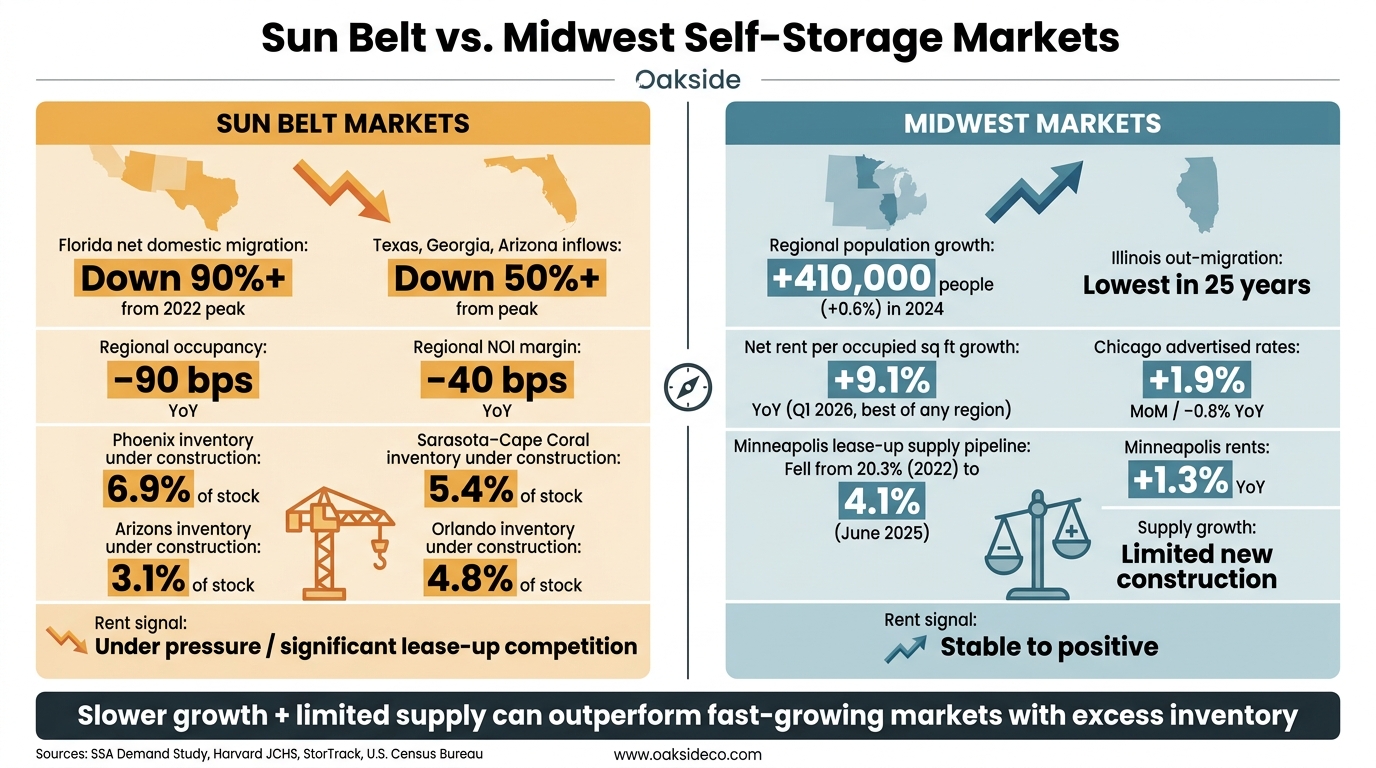
Sun Belt vs. Midwest Self-Storage Markets: Key Demand & Supply Metrics
National household growth can make the market look simple. It isn’t. Self-storage demand shows up where households actually move, not in the national headline number.
About 7.5 million Americans moved to a different state in 2023, and seven of the top ten net-migration states were in the South.
Sun Belt Inflows, Development Growth, and Lease-Up Pressure
When household growth piles into a handful of metros, it turns into lease-up pressure fast. That was the story across Sun Belt markets after 2020. Metros like Dallas–Fort Worth, Atlanta, Orlando, Phoenix, and Charlotte pulled in strong inflows, and developers moved hard to add space.
The problem is timing.
A lot of those projects opened in 2023–2025, right as interstate migration started to cool. Florida’s net domestic migration fell more than 90% from its 2022 peak, and Texas, Georgia, and Arizona each saw inflows drop by over 50%.
That left some markets with a mismatch between new demand and new supply, raising concerns about a self-storage market bubble. Cape Coral, Orlando, and Atlanta now have heavy new inventory still working through lease-up. At the regional level, the South lost 90 basis points of occupancy and 40 basis points of NOI margin year-over-year. Phoenix has about 6.9% of its existing inventory under construction, Sarasota–Cape Coral around 5.4%, and Orlando near 4.8%.
The long-run demand story hasn’t disappeared. But that doesn’t erase near-term pressure from too many new openings at once. That’s the gap investors need to measure before putting money to work.
Midwest and Slower-Growth Markets with Steadier Supply Conditions
The same migration view points to a different setup in the Midwest and other slower-growth markets.
Michigan, Minnesota, and Ohio recently turned positive on net migration, while Illinois posted its lowest out-migration in 25 years. The full Midwest region grew by about 410,000 people (+0.6%) in 2024, and every state posted gains. Paired with a lighter construction pipeline, that steadier household growth has helped support more even demand absorption and firmer rent trends.
Midwest net rent per occupied square foot rose 9.1% year-over-year in Q1 2026, the best gain of any region in the country. Chicago’s advertised rates rose 1.9% month-over-month and slipped only 0.8% year-over-year. That’s a very different picture from the sharper annual drops seen in oversupplied Sun Belt metros. Minneapolis also saw new-construction pressure ease in a big way: its trailing three-year lease-up supply fell from 20.3% in 2022 to just 4.1% by June 2025.
| Region / Metro | Net Migration Trend | Household Growth | Supply Growth | Rent Signal |
|---|---|---|---|---|
| Chicago – Midwest | Positive net migration | Modest, steady | Limited new construction | Rates –0.8% YoY |
| Minneapolis – Midwest | Positive net migration | Moderate, stable | Pipeline fell from 20.3% to 4.1% (2022–2025) | Rents +1.3% YoY |
| Cleveland / Columbus – Midwest | Modest positive to near flat | Cleveland ~+0.7% YoY; Columbus near flat | Limited new construction | Reliable rate management |
| Orlando – Sun Belt | Florida net domestic migration down more than 90% from 2022 peak | Still expanding, but slower | ~4.8% of inventory under construction | Rent under pressure |
| Phoenix – Sun Belt | Inflows down over 50% from peak | Still expanding, but cooling | ~6.9% of inventory under construction | Significant lease-up competition |
These regional differences make one point pretty clear: national averages can blur what’s happening on the ground. In this market, local occupancy, rent, and construction data tell you a lot more than the headline numbers do.
Reading Local Demand Signals and Applying Them to Investment Decisions
National averages can hide submarket lease-up risk. For underwriting, local household, renter, and migration data tell you much more about where demand is likely to show up.
The Local Indicators That Matter Most
| Indicator | Underwriting Cue |
|---|---|
| Annual household formation | 10,000+ net households can absorb new supply more reliably when existing inventory is not already saturated. |
| Renter share of households | Higher renter shares usually mean faster turnover and more storage use. |
| Average apartment size | Sub-800 sq. ft. averages signal stronger off-site storage need. |
| Homeownership affordability | Lower affordability keeps households renting longer. |
| Net migration | Shows where demand is arriving. |
| Age distribution | Concentrations in 25–34, 35–44, and 55–74 signal life events that drive storage use. |
| Downsizing potential | More older homeowners point to estate and downsizing demand. |
| Residential turnover | Moves as a share of households directly track move-related storage demand. |
These inputs shape rent, occupancy, and unit-mix assumptions. And those are the variables that make or break a deal.
The key is to read these signals together. One data point on its own can point you in the wrong direction. A market with strong household growth may still be a weak bet if supply is piling up. On the flip side, a slower-growth area can perform well when renter share is high, turnover is steady, and new construction stays limited.
A Market Classification Framework for Owners and Investors
| Market Type | Household Profile | Primary Demand Drivers | Strategic Implication |
|---|---|---|---|
| High-migration, renter-heavy | Strong net in-migration, renter share above 45–50%, younger population, smaller apartments | Frequent moves, lease transitions, transitional storage | Target growth acquisitions, favor smaller-unit mixes, and watch the pipeline closely. |
| Aging and downsizing | Above-average 55+ and 65+ shares, large single-family inventory, rising property taxes | Downsizing moves, estate transitions, off-site RV/boat storage | Larger units, long-duration leases, premium boat/RV storage; partner with estate planners and senior communities. |
| Slow-growth, under-supplied | Flat household formation, limited new construction, older inventory | Steady, non-cyclical life events with constrained supply | Value-add acquisitions; operational upgrades over new builds; consult a self-storage guide for execution details; highlight supply discipline to buyers. |
| Hybrid | Mix of high migration and growing older cohorts | Move-related storage plus downsizing and RV/boat demand | Diversified unit mixes; consider co-locating traditional storage with boat/RV; segment marketing by age cohort. |
This framework turns raw data into a plan. Instead of treating every market the same, it helps owners and investors match product type, lease assumptions, and marketing to the households that are actually driving demand.
Hybrid markets deserve extra attention in the Sun Belt, where in-migration and aging are starting to overlap. That mix can change demand composition even when the top-line growth rate cools. In plain English: the market may still have plenty of storage demand, but the reason for that demand starts to shift.
Conclusion: Key Household Trends to Monitor Now
That is why local underwriting should come before market-wide assumptions. Slower household formation has not weakened storage demand; it has concentrated it in renters, delayed buyers, and older households. A market with flat population growth but limited supply and high renter share can outperform a fast-growing metro with too much new inventory. Reading that difference means tracking the right indicators at the submarket level, not the national one. Household growth matters only after renter mix, migration, age profile, and supply pipeline are weighed together.
Oakside Co uses these signals to guide acquisition, disposition, and portfolio strategy for self-storage and boat/RV assets.
FAQs
Why does household formation matter more than population growth for storage demand?
Household formation is a better signal of self-storage demand than population growth because it points more directly to one thing: the need for extra space.
Here’s why. When people form new households, they often move into smaller homes or apartments with less room for their stuff. That shift can create immediate demand for off-site storage.
As Nolen Masserman, Managing Director at Oakside, notes, local household formation patterns often reveal trade area demand more clearly than broad population trends.
Which local metrics best predict self-storage demand?
Focus on hyper-local metrics. In urban areas, look at a 1- to 3-mile radius. In suburban and rural markets, stretch that to up to 5 miles.
The signals that matter most are:
- Population density
- Household formation
- Net in-migration
- The renter-to-homeowner mix
You’ll also want to track occupancy (82%–95%), NRSF per capita (about 1.68 sq. ft. per person), and the local development pipeline over the next 24–36 months.
Then compare achieved rents with asking rents and RevPAF. That’s where you start to see what the market is doing on paper versus what operators are getting in practice.
Why can slower-growth Midwest markets outperform some Sun Belt metros?
Slower-growth Midwest markets can beat some Sun Belt metros for a simple reason: they often sidestep the heavy wave of new supply that has flooded many high-growth areas.
In parts of the Sun Belt, new construction has put pressure on rents. Meanwhile, secondary and tertiary Midwest markets can get a lift from lower per-capita storage supply and tougher barriers to entry, like zoning friction and limited land availability. As Nolen Masserman, Managing Director at Oakside, notes, storage demand is highly local.