Housing turnover still drives storage demand, even when overall storage use is up. I’d boil the research down to this: when home sales, household formation, and local moves slow, self-storage lease-up gets harder, rent growth cools, and owners need to lean more on product mix and in-place rent changes.
Here’s the short version:
- About 83% of storage demand ties back to housing needs in some form, including moves, life changes, and lack of space at home.
- Existing home sales fell to 4.06 million in 2025, which helps explain weaker move-in volume.
- Same-store occupancy was still 90.2% in Q3 2025, but that did not mean pricing was strong.
- Street rents rose just 0.7% year over year in October 2025, showing how flat turnover can limit rate power.
- Smaller apartments and renter-heavy markets keep demand in place, especially for small, climate-controlled units.
- New storage supply still matters a lot. When annual supply growth pushes past 2.0%, rent growth often stalls.
- Longer stays help occupancy, but they also reduce chances to reset rates with each new tenant.
If I were buying or operating a facility, I’d focus on three things first:
- Local home sales and moving activity
- Multifamily growth vs. storage supply
- Whether demand is move-driven or lifestyle-driven
That’s the core takeaway: stable occupancy can hide soft demand, so storage owners need to read housing data at the submarket level, not just trust national averages.
Housing Market Cycles and Self-Storage Demand
Home sales and turnover play a big role in self-storage move-ins. When home sales climb, move-related demand tends to climb with them. That usually helps facilities lease units faster and hold firmer rates. When the housing market slows, self-storage operators often see the change first in move-in volume.
Home Sales, Household Formation, and Demand Timing
Home sales drive storage demand during moves, home staging, and renovations. Industry analysis estimates that about 25% of total storage demand comes directly from people moving into new homes. That’s a large share of demand tied to one housing signal.
Household formation adds another piece to the picture. When young adults move out, roommates go separate ways, or families relocate for work, people often end up with more stuff than space. That gap can lead to storage demand even if no home purchase happens. So while resale activity may stay flat, storage demand doesn’t always move in lockstep.
Timing matters too. A jump in home sales can lead to more inquiries and move-ins pretty fast. But occupancy and revenue often peak later, once tenants get settled and leases start to stick.
What Slower Housing Turnover Means for Storage Performance
The current market shows that same pattern. Existing home sales totaled 4.06 million units in 2025, the lowest volume since 1995 and well below the long-term average of about 5.2 million. Home sales as a share of households are 93 basis points below the long-term average, close to levels last seen during the Global Financial Crisis. That slowdown shows up in operating data. Fewer home transactions mean fewer move-ins and slower lease-up.
Longer tenant stays have helped keep occupancy in place. Nationally, same-store occupancy sat at 90.2% in Q3 2025, while net move-ins as a share of units fell to a five-year low in the same period. Street rents showed the same strain, rising just 0.7% year-over-year in October 2025.
For operators underwriting new assets or mapping out lease-up timelines, that gap matters. A facility can stay close to full while still losing pricing power. Put simply, stable occupancy doesn’t always mean demand is strong.
sbb-itb-09b4138
Apartment Construction, Local Supply, and Utilization
Beyond moves and turnover, the kind of housing a market adds has a direct effect on storage demand.
Multifamily Growth and Small-Unit Storage Demand
Apartment construction and self-storage demand often move in the same direction, especially in renter-heavy metros. Across about 100 U.S. metros, self-storage development has tracked apartment construction, with the clearest pattern showing up in dense renter markets. Dallas, New York, and Houston are good examples. Over the past decade, those markets added 199,000, 162,000, and 142,000 apartments, and each delivered more than 15 million sq ft of self-storage over that same stretch.
Part of the reason is simple: newer apartments are smaller. On average, new units are about 75 sq ft smaller than units built in the early 2000s. Since 2015, studios and one-bedroom units have accounted for 53% of multifamily completions nationwide. That matters because many of those homes don’t come with garages, basements, or much closet space. So when people run out of room, they look elsewhere. In fact, not having enough space at home is now the top reason people rent storage, cited by about 40% of users.
The pull is strongest at the small end of the unit mix. In dense, high-rent metros such as New York and San Francisco, units under 50 sq ft can hit around 95% occupancy and produce 40% to 60% more revenue per sq ft than larger units. Urban operators can also charge about $1.50 to $2.50 per sq ft for compact lockers. That’s why sites near multifamily growth corridors tend to work best with smaller, climate-controlled units.
This setup works best when renter growth is outpacing new storage supply.
Development Pipelines, Vacancy Pressure, and Zoning Limits
Apartment growth helps storage demand, but only if new storage supply stays in check. Once self-storage supply grows above about 2.0% per year without enough demand to absorb it, rent growth tends to stall or slip negative. You can see that in markets such as Las Vegas and parts of Florida, where supply pressure has held back rent growth even with solid demand in place.
That’s why the current development slowdown matters. As apartments keep adding renters, a slower pace of storage construction improves the odds of firmer occupancy and better pricing. Full-year 2024 construction starts fell about 22% year over year, and Q1 2026 starts were roughly 29% below the prior year’s pace. The under-construction pipeline now sits at about 46.5 million net rentable sq ft, equal to 2.3% of inventory, and more projects are being deferred or abandoned. In markets where multifamily building is still bringing in renters while storage supply growth slows, occupancy can tighten, and vacancy and rent pressure usually ease.
Zoning adds another barrier in many dense markets. Cities often limit self-storage to industrial or general commercial zones, require conditional use permits, set spacing rules between facilities, or pause new development with moratoria. New York City shows how strong that constraint can be. It has only about 2.4 sq ft of storage per capita, far below the national average of more than 6 sq ft, despite its large renter base. In infill markets where zoning keeps supply tight, that scarcity helps curb new competition and supports pricing power and occupancy. That’s usually where lease-up and rate power improve the most.
Moving Activity, Migration, and Tenant Behavior
After housing supply, the next piece is simple: who’s moving into these units, and how often are they moving?
Migration and Local Moves as Demand Drivers
Moves, both local and interstate, are a main source of self-storage demand. About 31% of U.S. storage users rent during a move, and moving is still one of the top reasons people turn to storage.
State-to-state migration has cooled in a big way. It dropped to about 550,000 people, a 12-year low. Florida’s net inflows fell 93% from their 2022 peak, and Texas, Georgia, and Arizona were each down more than 50%.
That matters because fewer long-distance moves mean fewer new tenants in many high-growth markets. Local moves still help fill units, but they often lead to shorter stays tied to closings, home staging, renovations, or temporary housing. When move activity slows, operators usually feel it fast through tenant churn and shorter or less predictable stay patterns.
Longer Stays, Lower Churn, and Revenue Trade-Offs
Lower mobility has stretched average stay length from about 9–14 months to 18–19 months at many facilities. At the same time, only 11% of Americans changed addresses in the latest tracked period, down from 14.3% in 2015.
On the surface, longer stays look good. They can help keep occupancy steady. But there’s a catch.
Lower churn means fewer chances to reset rents with each new move-in. So the revenue playbook shifts. Operators have to lean more on:
- smaller intro discounts
- tighter renewal handling
- periodic in-place rent increases
The big question is how far rent increases can go before tenants leave. In softer markets, sharper increases can push churn up. In tighter markets, tenants may absorb those increases with only a small hit to retention.
That changes which tenant groups matter most when operators think about pricing and lease-up.
Demand Drivers and Storage Outcomes
Storage demand now leans more heavily on lifestyle tenants. Lifestyle storage, driven by limited space at home and household consolidation, has become more important as migration and home turnover have slowed. Downsizing, remodeling, and life events like divorce or having a child still bring in a steady stream of renters.
Transitional demand usually skews toward smaller units, especially 5×5, 5×10, and 10×10. Downsizing and household consolidation can also support larger units when people are between homes or holding items they don’t yet have room for. Move-driven tenants tend to fill space fast, then leave once the transition is over. Lifestyle and downsizing tenants usually stay longer and are less likely to leave over modest rate increases.
Those demand groups don’t behave the same way, and that has direct pricing and lease-up effects. What’s taking shape is a clearer split between short-term move-related demand and longer-stay lifestyle demand.
Pricing, Lease-Up, and Asset Positioning: What the Research Shows
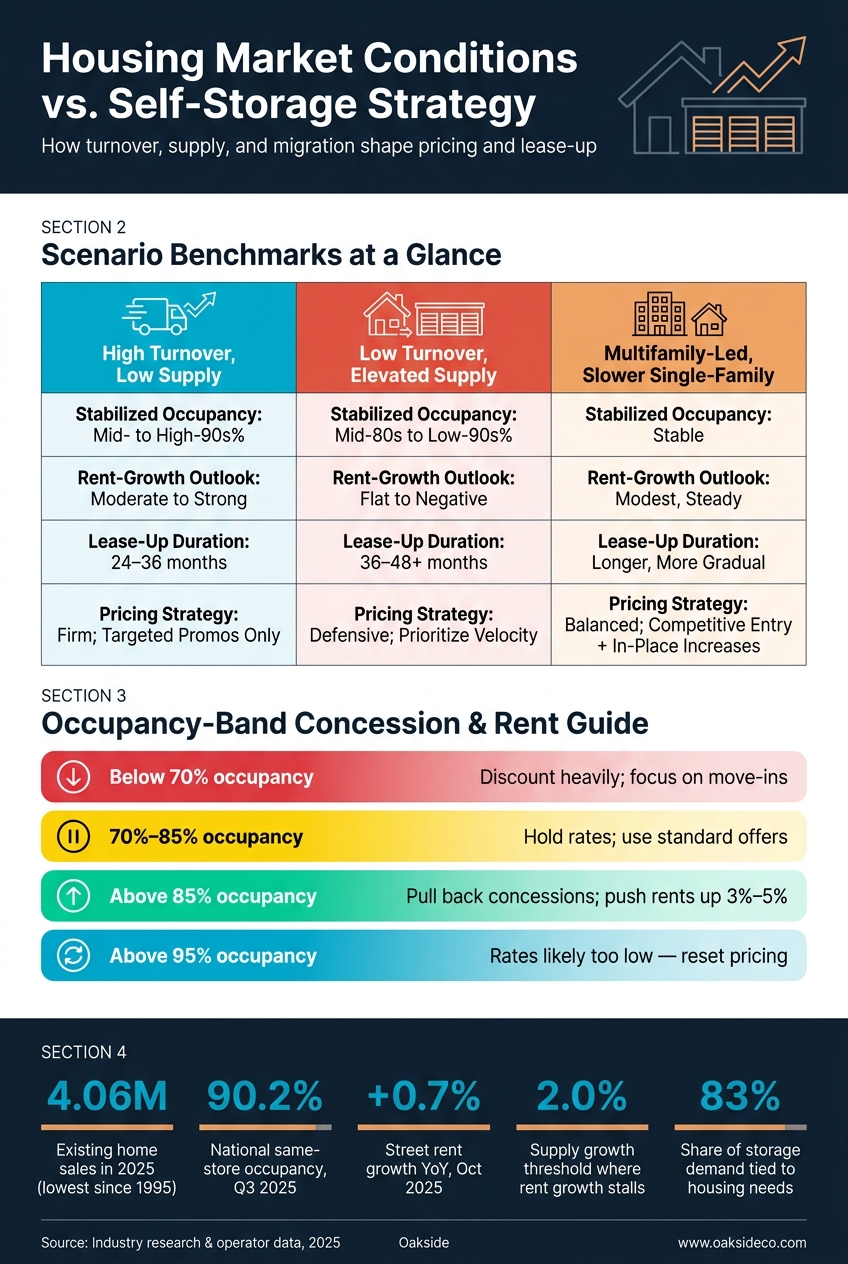
Housing Market Conditions vs. Self-Storage Strategy: Key Metrics & Scenarios
Revenue Management and Lease-Up Assumptions by Housing Scenario
When move activity slows down or picks up, pricing and product mix should move with it.
Street rates should reflect local housing turnover and supply. In markets with high turnover and limited supply, operators can stay firmer on pricing and use promotions in a narrow way, mainly to smooth out seasonal slowdowns.
That changes in softer markets. If home sales are weak, migration slows, and new supply keeps coming online, pricing pressure gets harder to ignore. In 2023 and 2024, street rents fell more than 10% for two straight years. In that setup, speed matters more. Focus on lease-up velocity, use deeper intro offers when needed, and expect stabilization to take longer. After the promo period ends, stepped rent increases can help rebuild revenue as occupancy improves.
A simple occupancy-band framework can guide concessions and rent growth:
- Below 70%: discount more heavily and focus on move-ins
- 70% to 85%: hold rates with standard offers
- Above 85%: pull back concessions and push rents up 3% to 5%
- Above 95%: rates are likely too low and should be reset
The same housing signals that affect rent growth also shape which asset types are likely to work best.
Positioning Self-Storage and Boat & RV Assets Along Growth Corridors
Pricing tends to follow housing turnover. Format choice tends to follow the kind of housing being built nearby.
Dense renter-heavy areas usually lean toward smaller, climate-controlled units. That setup can support premium pricing for well-located self-storage, along with covered or enclosed boat/RV storage.
Outer-ring suburbs often tell a different story. HOA rules that limit RV and boat parking shift demand off-site. In mixed-growth corridors, a hybrid layout – standard self-storage plus boat/RV space – often reaches the broadest pool of demand. Oakside uses RV and boat registrations, HOA rules, and permit data to sort corridors into self-storage, hybrid, or boat/RV-heavy inventory.
Housing Conditions vs. Storage Strategy
The clearest way to use the research is to tie housing conditions directly to pricing strategy.
| Housing Scenario | Expected Occupancy (Stabilized) | Rent-Growth Outlook | Lease-Up Duration | Pricing Strategy |
|---|---|---|---|---|
| High turnover, low supply | Mid- to high-90s% | Moderate to strong | 24–36 months | Firm; targeted promos only |
| Low turnover, elevated supply | Mid-80s to low 90s% | Flat to negative | 36–48+ months | Defensive; prioritize velocity |
| Multifamily-led, slower single-family sales | Stable | Modest, steady | Longer, more gradual lease-up | Balanced; competitive entry + in-place increases |
Conclusion: Key Takeaways for Owners and Investors
The research points to three main takeaways that should guide pricing, underwriting, and asset strategy.
First, housing turnover is one of the biggest near-term demand drivers. When home sales and household formation are active, lease-up tends to move faster and pricing holds up better. When turnover stalls, each new tenant takes more work, and underwriting needs to reflect that.
Second, local supply conditions shape pricing power. Markets with heavy apartment construction and restrictive zoning tend to support steady demand, especially for smaller, climate-controlled units. Markets with lots of new self-storage supply and slower migration face real rent pressure, and projections should reflect that plainly.
Third, migration patterns change churn and stay duration in ways that affect revenue management. Longer stays can cut churn, but they also reduce chances to reset rents at move-in. That puts more weight on in-place rent strategy – timing, size of increases, and tenant sensitivity – than it did when turnover was faster.
Asset strategy works best when it is built on submarket housing data rather than national averages. National occupancy around 91% to 92% can hide major local differences. The best operators and investors pull Census migration data, housing permit activity, and storage supply per capita into one underwriting view, then adjust product mix and pricing to fit the market.
FAQs
Why can occupancy stay high while rents stay flat?
High occupancy paired with flat rents can be a warning sign. It often means a facility is leaning on heavy concessions or old pricing to keep units full instead of growing revenue. Physical occupancy tells you how many units are rented. It does not tell you how much income is coming in.
That’s where the gap between physical and economic occupancy starts to matter. A property may look full on paper, while collected revenue tells a weaker story. That kind of mismatch can make revenue feel less stable than it first appears.
As Cameron Vale, President at Oakside, notes, data-driven pricing helps turn high occupancy into stronger net operating income.
Which housing metrics matter most for storage demand?
Focus on hyper-local housing data. In urban markets, that usually means a 1- to 3-mile radius. In suburban and rural areas, you can stretch that to up to 5 miles.
The main numbers to watch are:
- Household formation
- Population density
- In-migration
- Apartment renter concentration
You should also check HOA rules and municipal codes. Why? Because limits on oversized vehicle parking can have a direct effect on boat and RV storage demand.
If people can’t keep a boat, trailer, or RV at home, they have to put it somewhere else. That simple rule can make a big difference in local demand.
How should operators adjust pricing in low-turnover markets?
In low-turnover markets, put Existing Customer Rate Increases (ECRIs) at the center of your revenue plan. Long-term tenants tend to bring more stability, so they’re often the best place to look for steady growth.
Skip blanket rate changes. Instead, group tenants by payment history, length of stay, and unit type. If occupancy holds above 90%–95%, that’s a strong sign you can apply moderate, market-backed annual increases in the 3%–8% range instead of leaving old legacy rates in place.