
A high occupancy rate does not mean a self-storage property is worth more. Cash collected does. If a facility is 92% physically occupied but only 86% economically occupied, that gap can cut NOI and lower value. In plain terms: buyers care less about how full the property looks and more about how much rent it actually turns into.
Here’s the short answer:
- Physical occupancy shows how much space is leased
- Economic occupancy shows how much rent is collected after discounts, delinquency, and bad debt
- Stabilized occupancy means the property has held its level for 12 to 24 months, not just one strong month
- Lease-up pace matters because two properties at 90% occupancy can still be priced very differently
- Rent roll quality tells buyers if billed rent matches collected income
- Value comes from stabilized NOI ÷ cap rate - for example, $420,000 ÷ 6.5% = about $6.46 million
If I were sizing up a self-storage deal, I’d focus on one question: does this occupancy hold up in cash flow? That means checking collections, concessions, delinquency, unit mix, street rents, and a 12- to 24-month trend instead of trusting one headline number.
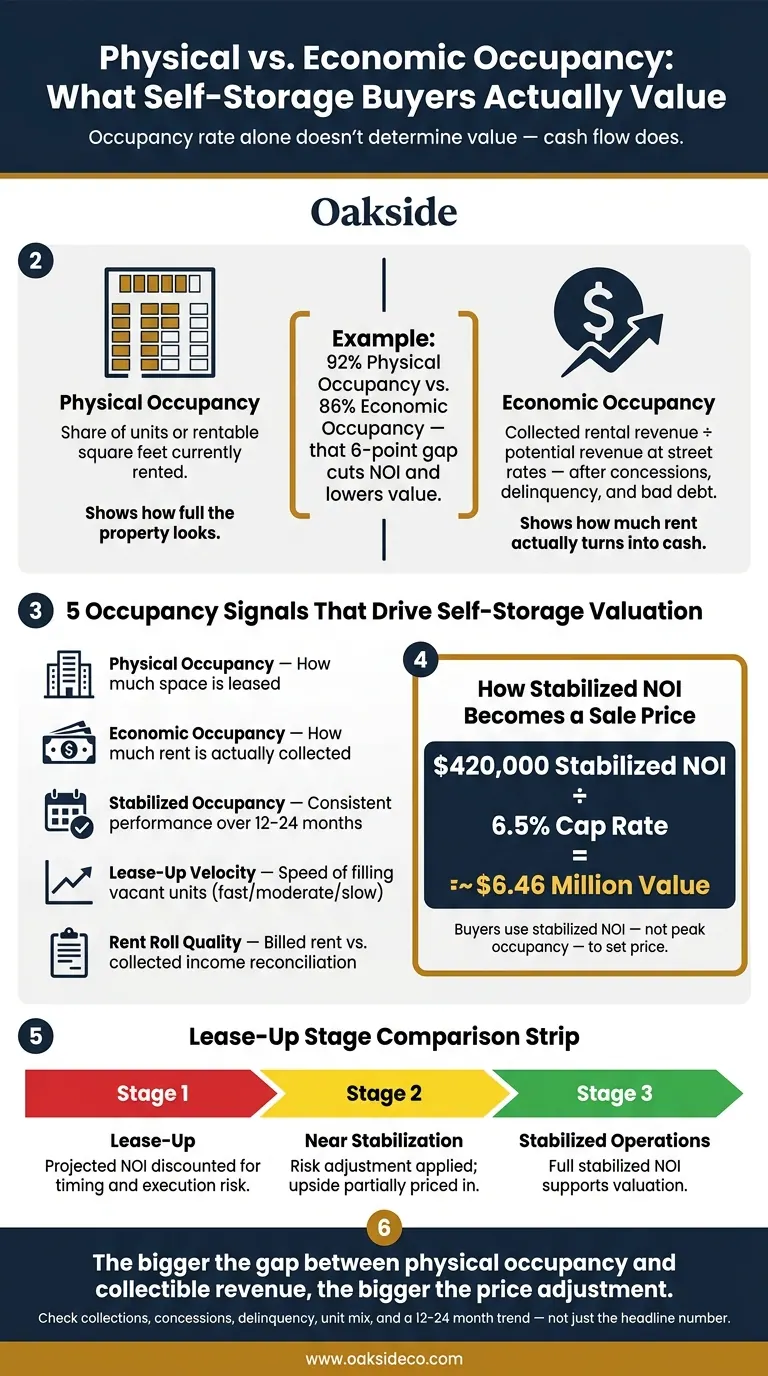
Physical vs. Economic Occupancy: What Self-Storage Buyers Actually Value
Stabilized occupancy means more than a good month. It means the property has held up through normal seasonal swings, with rents, concessions, and collections sitting at run-rate levels. That’s the line buyers use to separate a lease-up deal from a property with settled operations.
Current Occupancy vs. Stabilized Occupancy
Current occupancy is a snapshot. Stabilized occupancy is a pattern.
If you want to treat today’s occupancy as stabilized, it needs to hold over multiple months - ideally 12 to 24 months and across both strong and slower leasing periods. A high summer occupancy number that hasn’t made it through softer months doesn’t tell buyers much about staying power.
And the number alone isn’t enough. The quality of that occupancy matters just as much. If in-place rents sit well below current street rates, or a large chunk of tenants came in on move-in specials, the property may be buying occupancy instead of earning it. In that case, underwriters usually mark rents to market and model a burn-off period, when some price-sensitive tenants leave, before they use a stabilized revenue figure. Heavy discounting pulls down underwritten value.
Buyers also want proof that the income is holding up in practice, not just on paper. That means normalized expenses, strong collections, low delinquency, and a rent roll that matches trailing financials. Standard concessions and a reconciled rent roll help show that reported occupancy lines up with actual, collectible income.
How Underwriting Reads Lease-Up, Near-Stabilization, and Stabilization
Underwriters don’t use one fixed occupancy percentage for every deal. The right level depends on the market, unit mix, nearby competition, and seasonality. What they do use is a consistent way to judge where the property stands in its operating cycle and what proof backs that up.
| Occupancy Condition | Buyer View | Supporting Evidence | Pricing Implication |
|---|---|---|---|
| Lease-up | Current occupancy does not yet show a long-term run rate. | Rising or choppy occupancy; recent move-ins make up a large share of tenants; high concessions; economic occupancy trails physical occupancy; short operating history. | Value reflects lease-up costs, timing risk, and execution risk. Projected stabilized NOI is discounted. |
| Near stabilization | The asset is improving, but buyers still need to see that it can hold. | Several months of improving or steady occupancy; concessions coming down; collections improving; rents backed by market data; remaining vacancies clustered in certain unit types. | Pricing may include some forward upside, but buyers usually apply a risk adjustment or ask for a higher return until the performance is proven. |
| Stabilized operations | Occupancy and revenue look like a believable run rate. | Consistent multi-month performance; strong economic occupancy; standard concessions and low delinquency; rents backed by the market; reconciled financials; normalized expenses; no unexplained swings. | Stabilized NOI can support valuation, subject to market cap rates, comparable sales, and any remaining operating risk. |
Once stabilized status is clear, buyers test how long it has held.
Once stabilized occupancy looks believable, buyers usually dig into the trend behind it. One occupancy number tells you where a property sits right now. A 12- to 24-month history tells you whether that level is likely to hold.
That difference matters. If occupancy is moving up, staying flat, or slipping, buyers will underwrite forward NOI very differently. And that flows straight into price.
What to Review in 12- to 24-Month Occupancy History
Look at monthly physical occupancy, economic occupancy, move-ins, move-outs, net absorption, renewal activity, delinquency, and effective rent.
A 24-month line chart can do a lot of heavy lifting here. If it shows separate lines for physical occupancy, economic occupancy, and occupied rentable square feet, buyers can spot the direction in seconds. Add a monthly operating table, and it becomes much easier to tell the difference between a real shift and normal seasonal swings.
A simple year-over-year check helps too. Compare each month with the same month from the prior year to separate trend from seasonality.
A growing spread between physical and economic occupancy is a warning sign. It often points to more concessions, weaker collections, or both.
If the trend is moving in the right direction, buyers usually ask one more thing: How fast did the property get there?
How Lease-Up Velocity Changes the Value Story
Lease-up velocity is the speed at which vacant units turn into occupied, income-producing space. For newly built, expanded, or repositioned assets, that pace can matter more than the current occupancy rate.
The clearest metrics are monthly net move-ins, absorption by unit type, and the time needed to hit key milestones like 70%, 80%, and 90% occupancy.
That’s where the story gets more interesting. Two properties can show the same occupancy rate and still deserve different values. One may have climbed in a steady, healthy way. The other may have leaned on heavy promotions or dealt with rising move-outs. Same snapshot, very different picture.
Verified collections and lease-up timelines grounded in reality tend to carry more weight with buyers than best-case forecasts.
Fast, Moderate, and Slow Lease-Up in Underwriting
Fast lease-up helps value only if it holds up over time.
| Lease-up pace | Occupancy change pattern | Pricing behavior | Underwriting interpretation |
|---|---|---|---|
| Fast | Consistent positive net absorption; rapid milestone achievement; improving occupied rentable square feet | Effective rent stable or rising; concessions limited or temporary | Supports an earlier stabilization date and stronger forward NOI - but only if collections and retention stay healthy |
| Moderate | Positive but uneven absorption; seasonal pauses or mixed results by unit type | Some concessions or rate changes needed, but effective rent still holds up | Supports a measured lease-up schedule with conservative revenue growth assumptions |
| Slow | Minimal or negative net absorption; repeated occupancy setbacks; long periods below milestones | Heavy concessions, below-market rates, weak collections, or rising delinquency | Points to execution and demand risk; may call for lower forward NOI, a longer lease-up period, or a higher risk premium |
These pace thresholds should match the market, unit mix, competing supply, and delivery conditions. After that, buyers move to the next check: whether the rent roll actually backs up the reported occupancy.
Once buyers see that occupancy looks stable, they turn to the rent roll to check the part that matters most: can that occupancy actually turn into cash? A property can post strong physical occupancy and still miss on income if concessions, delinquency, or old lease rates drag down cash flow. That’s the proof buyers want before they treat occupancy as durable NOI.
The Data Points That Test Revenue Quality
This review needs to be broken out by unit type and square footage. Why? Because a property that is full of small units can produce a very different income picture than one loaded with larger drive-up, climate-controlled, boat, or RV spaces.
At a minimum, the rent roll should show each unit’s:
- type
- size
- status
- in-place monthly rent
- move-in date
- tenant balance
- delinquency status
- concession
- billed rent
From there, buyers compare in-place rent against the current street rate for the same unit type and size. The goal is simple: figure out whether the gap points to real upside or whether the underwriting is getting ahead of itself.
Long-tenured tenants can be a clue that rents sit below current street rates. On the flip side, a heavy share of recent move-ins can point to promo-driven lease-up instead of steady demand. Buyers should also flag occupied units with zero rent, no recent payments, recurring credits, or no balance movement. Those cases may point to complimentary occupancy, reporting mistakes, delinquent tenants, or income that probably won’t stick.
Delinquency and lien status should have their own column in the review. Tenants in the lien or auction phase are still counted as occupied in most management systems, but they are not producing normal revenue and may add auction-related costs. If delinquency is piled into certain unit types, like larger drive-up spaces or boat and RV storage, the NOI hit can be worse than the unit count alone would suggest. That’s why occupancy always needs to be segmented by unit type, so weak spots in high-rent categories don’t get hidden by strong numbers in lower-rent units.
How to Reconcile the Rent Roll to Financial Statements
The rent roll shows current billing. The T12 shows actual results. Buyers should reconcile them in this order: billing → collections → T12 revenue.
Start by matching occupied units and billed rent on the rent roll to the management system’s billed-rent report. Then reconcile billed rent to collected rent, while accounting for concessions, credits, delinquency, and timing differences. After that, tie collected rental income to the matching revenue lines on the operating statement. If the rent roll total doesn’t line up with the T12 rental income line, that gap is a signal to dig deeper, not something to wave away.
Vacant-but-unavailable units should be carved out from ordinary vacancy. Damaged units, units under repair, spaces being converted, and units used for office or maintenance should not sit in the same bucket as normal rentable vacancy. Complimentary or owner-used units also need to be called out, because they can look occupied while bringing in no rent. Buyers should calculate both reported occupancy and adjusted occupancy, with clear support for what is included in the denominator.
Metrics Table: Occupancy, Rent, and Collections
| Metric | What It Measures | What It Helps Test | Valuation Question Answered |
|---|---|---|---|
| Physical occupancy | Share of units or rentable square feet currently rented | Whether space is rented and demand exists | How much inventory is in use right now? |
| Economic occupancy | Collected rental revenue divided by potential revenue at street rates | Whether occupied space produces cash after concessions, delinquency, discounts, and bad debt | How much of the reported revenue is actually collectible and sustainable? |
| In-place rent | Contracted rent currently charged to tenants | Revenue embedded in the rent roll and exposure to below-market legacy rates | What revenue is actually under contract today? |
| Street rent | Current asking rent for comparable vacant units | Mark-to-market potential and competitive positioning | Is the projected upside realistic and supportable? |
| Collection performance | Cash received after concessions, delinquency, credits, and write-offs | Whether billed revenue converts into cash | How much of what’s billed is hitting the bank? |
The bigger the gap between physical occupancy and collectible revenue, the bigger the likely price adjustment.
Once occupancy and rent roll quality are clear, the next step is simple: turn that operating data into price.
Build a Clear Pricing Bridge From Occupancy to Value
A pricing bridge shows buyers how day-to-day property performance leads to value they can check for themselves. The flow starts with reported occupancy, moves to normalized occupancy, then to effective rental and ancillary revenue, stabilized NOI, the chosen capitalization rate, and the indicated value.
Sellers should adjust for delinquent, nonpaying, out-of-service, or temporarily unavailable units so buyers can separate repeatable performance from short-term noise. That distinction matters. A property can look full on paper while still falling short where cash flow is concerned.
For example, $420,000 of stabilized NOI at a 6.5% cap rate points to about $6.46 million in value.
How Sellers Should Present Occupancy Data Before Going to Market
To support that pricing story, sellers need a clean data package that buyers can underwrite without a lot of back-and-forth. At a minimum, it should include 12 to 24 months of monthly data by unit type, including climate-controlled, drive-up, vehicle storage, and boat and RV. For each segment, the package should show:
- Physical occupancy
- Economic occupancy
- In-place rent
- Concessions
- Delinquency
- Move-ins
- Move-outs
- Net absorption
That level of detail shows where unit-level performance drifts from the headline occupancy rate. A facility may show 90% overall occupancy, but the mix underneath can tell a very different story. For instance, climate-controlled 10-by-10 units may be at 98%, while larger drive-up units sit at 72%. Buyers will underwrite that difference, because it affects rent growth, leasing risk, and near-term income.
Sellers should also document new competing supply with the competitor’s location, unit mix, opening date, advertised pricing, and the observed effect on move-ins, move-outs, and in-place rents.
For sellers managing a self-storage vs RV storage investment returns during a disposition, Oakside Co provides investment-banking-level analysis and transaction support to help convert detailed operating data into a pricing strategy buyers can defend and to support diligence through closing.
Conclusion: The Occupancy Signals That Carry the Most Weight
Durable occupancy, credible collections, and a defensible stabilized NOI are what turn a reported occupancy rate into a sale price that holds through closing.
What occupancy gap is too large?
In self-storage, the gap between physical occupancy and economic occupancy is a key signal to watch.
In most cases, economic occupancy trails physical occupancy by 3% to 8%.
When that gap gets wider, it often points to operating problems. Common causes include heavy discounting, poor delinquency control, or too many tenants who occupy units but aren’t paying on time.
If the spread moves beyond that 3% to 8% range, the property may be filling units without turning that occupancy into steady cash flow. And that can drag down value.
How many months show stabilization?
In self-storage development and value-add projects, stabilization usually means hitting 85% to 92% occupancy.
Right now, getting there takes longer than it used to. What was once about 30 months has stretched to roughly 36 months in current market conditions.
And even after a property reaches that mark, a buyer will often want to see 12 to 24 months of occupancy history. The goal is simple: confirm that performance isn’t a short-term spike and that the trend has held up over time during a sale.
What rent roll issues lower value most?
The biggest drag on value is the gap between physical occupancy and economic occupancy.
A property can look full on the surface. But if that occupancy comes from heavy discounting, too many concessions, high delinquency, or rents that sit below market, the income story gets weaker fast. That hits revenue, NOI, and, in turn, value.
Buyers also pay close attention to move-in spikes that don’t last, occupancy trends that jump around, and rate changes that feel uneven. Those patterns can point to operating risk and income that may not stick.