
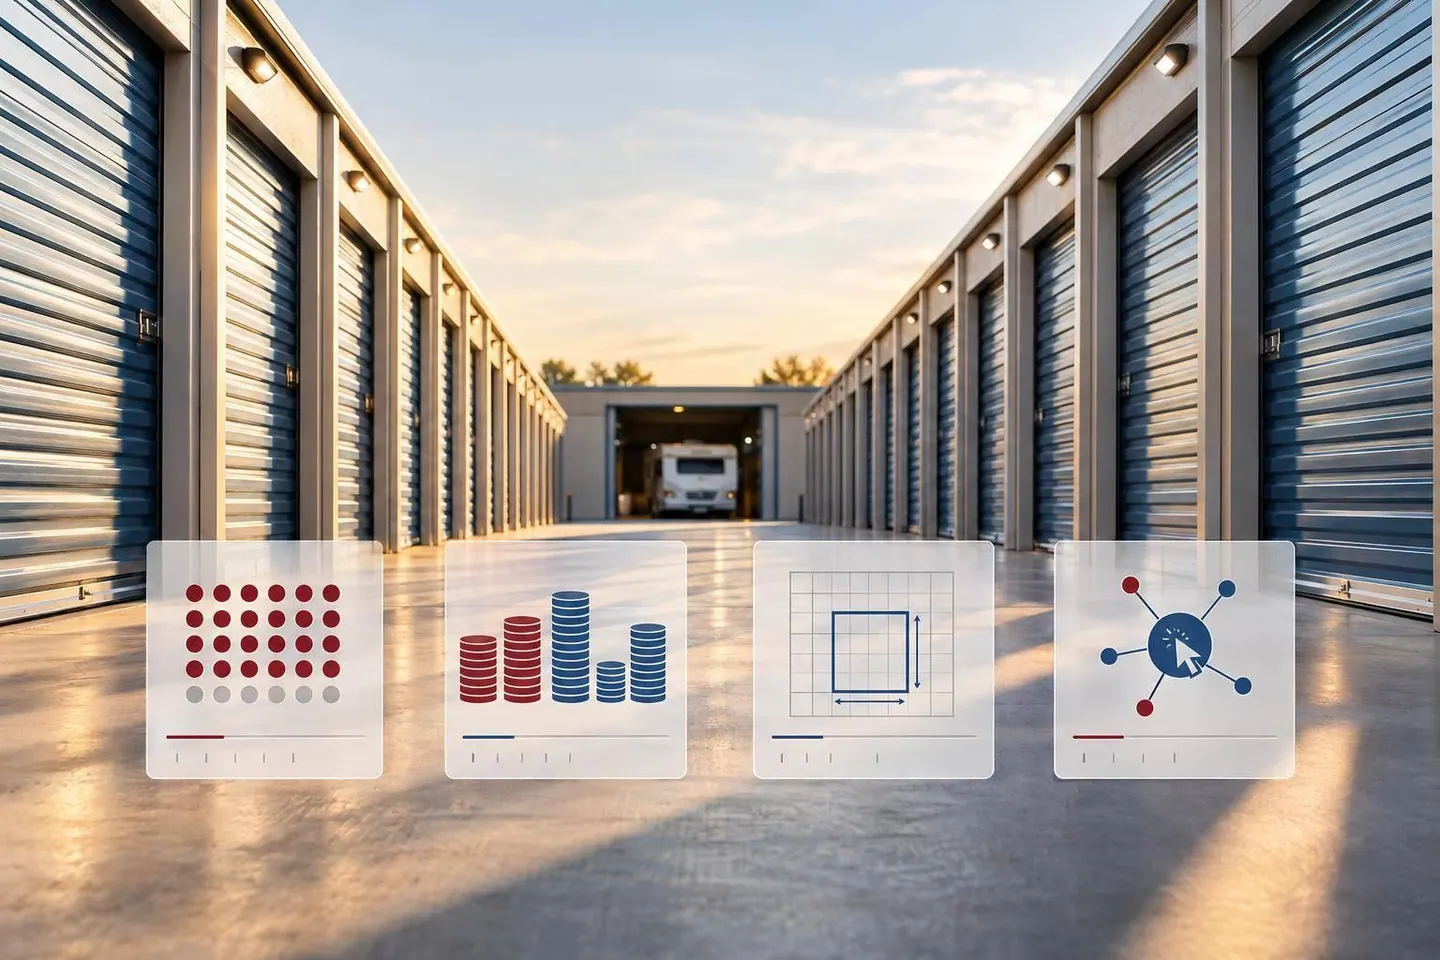
I compare self-storage and boat/RV competitors on total cost, verified occupancy, and site usability - not advertised rent alone. I start with a 3- to 5-mile radius, keep storage units and vehicle spaces separate, and use October 2, 2026, as the survey date.
Here’s what I check:
- Supply: Existing facilities, planned projects, local population, and drive times.
- Pricing: Matched unit sizes or parking types, discounts, mandatory fees, and average monthly cost over the first 12 months.
- Demand: Physical and economic occupancy, collections, and seasonal trends. Online availability is not proof of occupancy.
- Inventory and fit: Unit configurations, parking dimensions, vehicle clearance, and room to turn.
- Site quality: Security, access hours, visibility, surfaces, drainage, and building condition.
- Next steps: Pricing tests, repair priorities, and checks needed before a purchase, sale, or renovation.
My rule: <u>verify the gap before acting on it</u>. For example, 90% versus 85% occupancy is a 5-percentage-point gap - but it does not, by itself, prove that higher rents will work. This is a common pitfall in self-storage valuations.
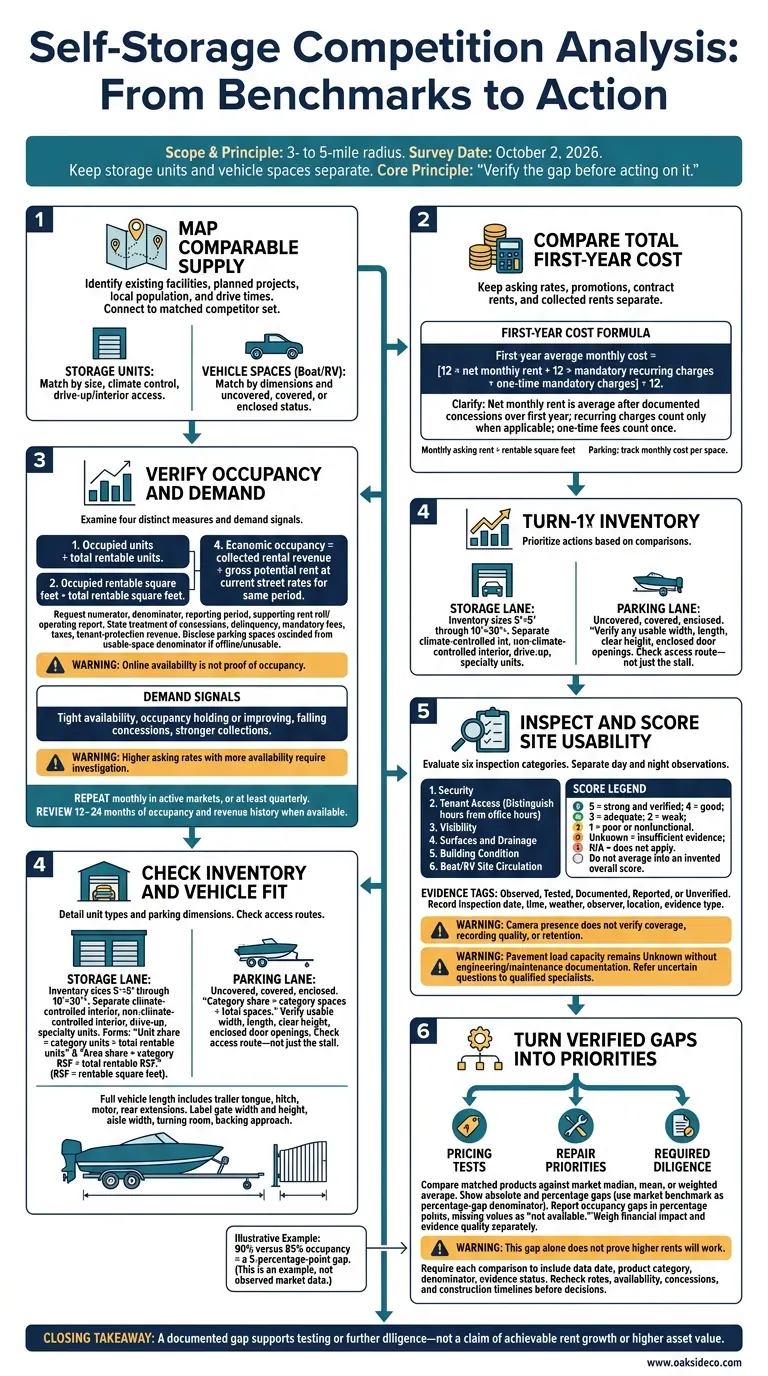
Self-Storage Competition Analysis: From Benchmarks to Action
Compare Street Rates and First-Year Costs
Compare like-for-like products: unit size, climate control, drive-up or interior access, and parking dimensions and covered status. Keep asking rates, promotions, contract rents, and collected rents separate. Record how long each discount lasts and who qualifies, including online booking, new-customer, autopay, or annual-prepayment requirements. Document the public asking rate before concessions or tenant-specific adjustments.
| Pricing field | What to compare | Cost treatment |
|---|---|---|
| Monthly street rate | Same size and configuration; compare uncovered, covered, and enclosed parking separately | Divide monthly asking rent by rentable square feet |
| Promotional price | Discount amount, duration, eligibility, and documented post-promotion rate | Apply only to eligible months |
| Mandatory charges | Administrative fee, required insurance or protection plan, mandatory lock purchase, taxes, and recurring access fees | Include documented charges; separate optional purchases |
| Contract and collected rents | Contractual tenant rents versus rental revenue actually received | Keep separate from advertised customer pricing |
First-year average monthly cost = [12 × net monthly rent + 12 × mandatory recurring charges + one-time mandatory charges] ÷ 12.
Use average net monthly rent after documented concessions over the first year. Count one-time fees once and recurring fees for each month they apply. Exclude undocumented future increases and optional fees. Include taxes only when documented.
For parking, track monthly cost per space alongside rent per square foot. Two spaces with the same area may not fit the same vehicle.
Start with pricing data, then check whether reported occupancy and collections support those rates.
Separate Occupancy from Availability
For each occupancy figure, request the numerator, denominator, reporting period, and supporting rent roll or operating report.
Economic occupancy = collected rental revenue ÷ gross potential rent at current street rates for the same period. State whether the calculation includes concessions, delinquency, mandatory fees, taxes, and tenant-protection revenue. Online inventory and waitlists point to demand; they do not measure leased occupancy.
| Occupancy measure | Source to request | Product category | Advertised availability to record | Discounts to record |
|---|---|---|---|---|
| Occupied units ÷ total rentable units | Dated rent roll and unit inventory | Storage, separated by configuration | Online count by unit size | Current move-in offers |
| Occupied rentable square feet ÷ total rentable square feet | Rent roll with unit areas | Storage, separated by configuration | Sizes shown as available | Offers by unit category |
| Leased usable spaces ÷ total usable spaces | Parking inventory and lease records | Uncovered, covered, and enclosed separately | Available spaces; temporary holds separately | Parking concessions |
| Collected rental revenue ÷ gross potential rent | Revenue report and current rate sheet | Storage and parking separately | Product-level availability alongside revenue results | Concessions during the reporting period |
Record parking spaces taken offline for paving, maintenance, construction, blocked access, or unusable pavement separately from leased spaces. If you exclude them from the usable-space denominator, disclose how many were excluded.
High physical occupancy does not prove strong revenue performance. To explain the gap, request concessions as a percentage of gross potential rent, delinquency, and average in-place rent compared with street rates.
Track these measures over time to distinguish demand-driven price changes from temporary shortages.
Track Rate Changes and Seasonal Demand
Repeat surveys monthly in active markets, or at least quarterly. Use the same unit types, parking dimensions, channels, and eligibility assumptions each time. Review 12–24 months of occupancy and revenue history when available.
Note openings, expansions, renovations, management changes, pricing changes, and storm or construction disruptions. Time surveys to account for seasonal boat/RV demand swings.
Treat rising asking rates as pricing power only when availability stays tight, occupancy holds or improves, concessions fall, and collections strengthen. Higher rates paired with more availability call for investigation - not an assumption of stronger demand.
Use these pricing and occupancy trends to test whether unit sizes, parking types, and vehicle fit match demand.
Use the pricing and occupancy findings above to check whether each competitor’s unit mix matches demand.
Compare Unit Sizes and Configurations
Build a verified inventory by size and configuration, from 5′ × 5′ through 10′ × 30′+ units. Separate climate-controlled interior, non-climate-controlled interior, drive-up, and specialty units. Calculate unit share = category units ÷ total rentable units and area share = category RSF ÷ total rentable RSF.
Record only observed inventory and asking rents.
| Size | Configuration | Inventory share to record | Available units | Monthly asking rent |
|---|---|---|---|---|
| 5′ × 10′ | Climate-controlled interior | Unit share and area share | Available units | Monthly asking rent |
| 10′ × 10′ | Non-climate-controlled interior | Unit share and area share | Available units | Monthly asking rent |
| 10′ × 20′ | Drive-up | Unit share and area share | Available units | Monthly asking rent |
Record floor level, elevator access, interior hallway access, and direct vehicle access. Note door and ceiling dimensions, plus loading features: carts, freight elevators, truck access, and delivery-hour restrictions. Compare rents only within matched configurations to isolate climate-control and ground-floor premiums.
Compare Parking Types and Vehicle Fit
Separate parking inventory into uncovered, covered, and enclosed spaces. Covered spaces provide overhead protection with open sides. Enclosed spaces have walls and a lockable door. Calculate each category’s share of total spaces and record its dimensions.
| Configuration | Space count | Inventory share | Dimensions to verify | Surface | Limits | Monthly asking rent |
|---|---|---|---|---|---|---|
| Uncovered | Verified count | Category ÷ total spaces | Usable width × length | Observed material | Length, weight, operability | Observed asking rent |
| Covered | Verified count | Category ÷ total spaces | Width × length; clear height | Observed material | Height, vehicle type, length, or weight limits | Observed asking rent |
| Enclosed | Verified count | Category ÷ total spaces | Interior dimensions; door opening | Observed material | Vehicle and use limits | Observed asking rent |
Measure the full vehicle, including the trailer tongue, hitch, motor, and rear extensions. Check the access route - not just the stall. Verify the narrowest gate width and height, aisle width, turning room, and backing approach. Note whether neighboring vehicles leave less room to maneuver. Use rent per square foot or linear foot only when dimensions and access are comparable.
Check Security and Tenant Access
After comparing parking fit, check how easily vehicles and tenants can enter, move through, and leave the site. Follow the same inspection route at every facility. Record fencing, gates, access controls, cameras, lighting, and emergency contacts. A camera’s presence does not confirm its coverage, recording quality, or retention. Mark recording, retention, monitoring, and access-control function as Unknown unless verified.
Inspect the site after dark, too. Look for gaps in lighting, glare, blocked sightlines, and burned-out fixtures.
Separate tenant access hours from office hours. Confirm holiday and after-hours rules for both storage units and boat/RV parking. With permission, time gate opening and closing, record queues, and check loading areas, elevators, and traffic flow. Document aisle and gate widths, entry and exit conflicts, repeated backing, curb strikes, and road blockage. Send uncertain maneuverability or emergency-access issues to a specialist for review.
Check Visibility, Surfaces, and Condition
Next, score what customers and vehicles encounter first: access, visibility, and pavement condition. Poor visibility can make leasing harder. Damaged pavement and drainage problems can interfere with tenant access and boat/RV movement.
Check frontage, signs, curb cuts, and entrance identification from the same travel directions, both day and night. Record surface material, potholes, rutting, slope, striping, and drainage. Inspect gate approaches and turning areas for heavy-vehicle wear. Mark load capacity as Unknown unless engineering or maintenance documents verify it.
Note visible roof and door damage, water staining, cleanliness, and deferred maintenance. Flag apparent expansion limits, structural questions, and development feasibility for review by qualified specialists.
Score Features and Document Defects
Use 5 = strong and verified; 4 = good; 3 = adequate; 2 = weak; 1 = poor or nonfunctional. Mark Unknown when evidence is insufficient and N/A when a category does not apply. Score each category separately. Good security should not hide poor drainage or restricted boat/RV access.
Apply the same evidence standard across categories so weak points stay visible rather than getting lost in an overall impression. Keep fixed asset traits separate from operating outcomes.
| Category | Benchmark type | Score | Evidence | Defects or limitations | Gap / follow-up |
|---|---|---|---|---|---|
| Security | Asset trait | 1–5, Unknown, or N/A | Control tests and coverage records | Breaches or control failures | Footage, access logs, alarm records |
| Tenant access | Operating outcome | 1–5, Unknown, or N/A | Published hours and access tests | Restrictions or delays | Confirm policies by product type |
| Visibility | Asset trait | 1–5, Unknown, or N/A | Approach observations | Entrance-identification problems | Night inspection or traffic review |
| Surfaces and drainage | Asset trait | 1–5, Unknown, or N/A | Condition observations and records | Damage or drainage failures | Civil review and repair estimate |
| Building condition | Asset trait | 1–5, Unknown, or N/A | Inspection findings | Damage or deferred maintenance | Roof report, property-condition assessment |
| Boat/RV site circulation | Operating outcome | 1–5, Unknown, or N/A | Entry, exit, and turning observations | Backing conflicts or road blockage | Swept-path or civil-engineering review |
For each finding, record the inspection date, approximate time, weather, observer, location, and evidence type. Label the evidence observed, tested, documented, reported, or unverified. Take photographs where permitted, locate major defects, and note inspection gaps, such as inaccessible roofs or missing nighttime observations.
Prioritize Pricing, Repairs, and Diligence
Once the checklist is complete, turn each verified gap into a pricing, repair, or diligence priority. Compare each subject metric with the market median, mean, or weighted average using both absolute and percentage gaps. Use the market benchmark as the denominator, mark missing values as “not available,” and report occupancy gaps in percentage points.
Compare only matched unit types and parking categories. Keep street rates separate from actual move-in rates and first-year effective costs. Then weigh each gap by its financial impact and the quality of the evidence.
Use the table below to turn field data into action.
| Metric | What to compare | Evidence quality | Proposed action | Required diligence |
|---|---|---|---|---|
| Rates by unit size and parking type | Subject rates versus the market median; dollar and percentage gaps | Verified leases/rent rolls; dated website records or phone surveys | Test pricing where comparable effective rates support it | Recheck concessions, fees, and leasing trend |
| Physical and economic occupancy | Subject and comparable figures; percentage-point gaps | High for verified records; low for availability-based estimates | Investigate product-level demand before changing inventory | Review rent rolls, waitlists, zoning, and pipeline costs |
| Asset risks: security, visibility, access, surfaces, and condition | Separate verified site findings from market findings | High for verified site inspections; low where unverified | Rank repairs by safety, operating impact, and cost | Obtain specialist reviews and bids; confirm scope and project status |
Include the data date, product category, denominator, and evidence status with every comparison. Before an acquisition, disposition, or renovation decision, recheck rates, availability, concessions, and construction timelines. A documented gap supports testing or further diligence - not a claim of achievable rent growth or higher asset value.
For vehicle storage, focus next on maneuverability and site usability. For boat/RV assets, verify turning radii, aisle width, gate geometry, drainage, pavement load capacity, and height restrictions.
Use Advisory Support for Transaction Planning
Oakside Co provides property-specific self-storage and boat/RV analysis to turn verified benchmarks into pricing, diligence, and transaction priorities.
How can I benchmark occupancy without rent rolls?
Base your analysis on verified facility-level data from CMBS disclosures and reported financials - not web-scraped estimates. Review past performance trends, then compare your property with local facilities within a 3- to 5-mile radius.
Look at the gap between physical and economic occupancy. A spread above 10% often points to collection problems or excessive concessions. To assess market health, track absorption rates, recent construction deliveries, and net rentable square footage per person.
When should I expand my survey beyond 5 miles?
Expand your survey beyond 5 miles mainly when analyzing boat and RV storage. Customers often travel 10 to 15 miles or more for these options. Standard self-storage typically serves a 1- to 5-mile trade area, depending on whether the location is urban, suburban, or rural.
Set your survey boundaries around how your target customers travel. Account for rivers, highways, and railroads, which can limit or extend how far customers will travel to your facility.
Which site improvements should I prioritize before raising rents?
Start with deferred maintenance and upgrades that improve security and curb appeal, such as asphalt resurfacing, motion-sensor LED lighting, exterior paint, and signage. Protect the property’s value by addressing roofing and drainage, along with smart locks, modern CCTV, and access controls.
For boat and RV properties, make sure drive aisles meet the standard width of 50–60 feet. These improvements support premium pricing and can help bring occupancy to 90% or higher - a signal that it may be time to consider rent increases.