A self-storage deal can look full and still lose income after closing. If physical occupancy is 90%+ but economic occupancy sits closer to 75%–88%, you may be buying revenue that depends on discounts, late payers, or space that is hard to lease at market rates.
Here’s the short version: when I review a self-storage, boat, or RV deal, I don’t stop at the occupancy number on the flyer. I check whether tenants are paying, whether rents are near market, whether concessions are filling space, and whether the layout makes every unit or stall easy to use. If not, the rent roll can overstate NOI.
Before closing, I’d focus on these checks:
- Compare physical vs. economic occupancy to see whether occupied units are turning into collected cash.
- Treat 90+ day delinquent units like vacant units in underwriting.
- Review 12–24 months of history to catch seasonal spikes, not just one strong month.
- Match the rent roll to bank deposits, the GL, and the management system.
- Check concessions and teaser rates that may be propping up occupancy.
- Review tenant mix by unit type because small units often turn faster and can be more price-sensitive.
- Study bad debt, lien activity, and auction logs to spot weak collections.
- Compare in-place rents with current street rates to find mark-to-market risk.
- Walk the site and test layout since tight aisles, poor access, and hard-to-use RV stalls can hurt leasing.
A simple rule helps: if there’s a big gap between occupied space and collected rent, I underwrite to the lower number. This conservative approach is a key part of sensitivity testing to ensure the deal remains viable under shifting conditions.
| Check | What I’m looking for | What it can mean |
|---|---|---|
| Physical occupancy | Units marked occupied | Can overstate income |
| Economic occupancy | Rent actually collected | Shows cash flow quality |
| Delinquency | 60, 90+ day past due tenants | Hidden vacancy risk |
| Concessions | Free rent, $1 move-ins, promos | Soft demand or weak pricing |
| Tenant mix | Unit sizes, stay length, payment habits | Churn and collection risk |
| Site layout | Aisles, access, turning room, visibility | Units that lease below market |
If occupancy only works with discounts, weak collections, or awkward space, it’s not stable income. That’s the lens I’d use before I price the deal.
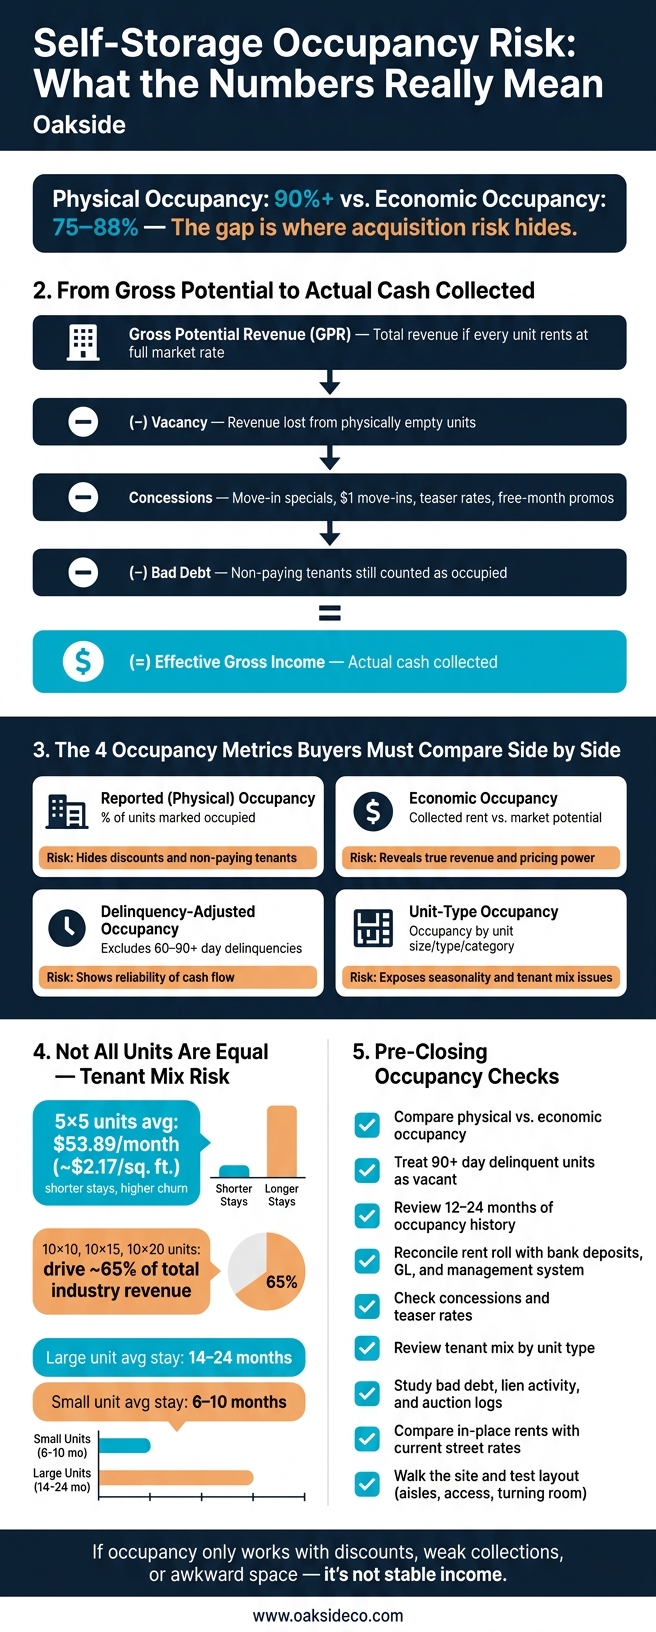
Physical vs. Economic Occupancy: Self-Storage Acquisition Risk Metrics
Problem 1: Reported Occupancy May Be Inflated
If occupancy looks strong, make sure it’s real, collectible, and repeatable. Reported occupancy can look better than it is because of timing, concessions, or delinquency. The key is simple: buyers should check collections, not just a snapshot on a rent roll.
Physical Occupancy vs. Economic Occupancy
Physical occupancy shows how many units are rented. Economic occupancy shows how much of the gross potential revenue is actually collected. That gap matters.
If physical occupancy looks high but collected revenue trails far behind, cash flow is weaker than it appears. In underwriting, treat units with 90+ day delinquency as vacant. That gives you a cleaner view of income that’s coming in versus income that exists only on paper.
How Discounts, Concessions, and Rate Lag Hide Revenue Gaps
Move-in specials like a first-month-free offer or teaser rate can fill units fast. But there’s a catch: cash flow sits below stabilized levels. A property can look busy while NOI stays soft. This discrepancy directly impacts your cap rate calculation.
The same issue shows up with rate lag. If in-place rents are well above current move-in rates, the asset may face reset risk when leases turn over. In plain English, today’s rent roll may not hold up tomorrow.
Use this hierarchy to check whether reported income lines up with cash collected.
| Component | What It Represents |
|---|---|
| Gross Potential Revenue (GPR) | Total revenue if every unit is rented at the full market rate |
| ( − ) Vacancy | Revenue lost from physically empty units |
| ( − ) Concessions | Revenue lost to move-in discounts and teaser rates |
| ( − ) Bad Debt | Revenue lost to non-paying tenants still counted as occupied |
| ( = ) Effective Gross Income | Actual cash collected |
How to Test for Inflated Occupancy Before Closing
Before closing, reconcile the rent roll against bank deposits, the general ledger, and the property management system. Then look at 12 to 24 months of occupancy history so you can spot seasonal spikes instead of taking one strong month at face value.
It also helps to pull delinquency and bad-debt reports. If a unit is shown as occupied but the tenant isn’t paying, underwrite that unit as vacant. That one adjustment can change the whole picture.
Once occupancy is verified, the next test is whether the tenants paying that rent are stable and current.
sbb-itb-09b4138
Problem 2: Tenant Mix and Collections Can Weaken Revenue Quality
A facility can sit above 90% physical occupancy and still have weak revenue quality. The issue isn’t only how many units are full. It’s also who is renting, how long they stay, and how often they pay on time. Two properties can post the same occupancy and end up with very different cash flow after closing.
The first thing to check is whether the tenant mix can support steady cash flow.
Weak Tenant Mix by Unit Type and Stay Profile
Not all occupied units are equal from a revenue standpoint. A facility packed with small units like 5×5s and 5×10s can look strong on paper, but those units often pull in shorter-stay tenants who are more sensitive to price. A 5×5 unit averages just $53.89/month or about $2.17/sq. ft. Meanwhile, 10×10, 10×15, and 10×20 units together drive about 65% of total industry revenue, and their average stays run 14–24 months, versus 6–10 months for smaller units.
That difference matters. A property tied too heavily to move-related or seasonal demand tends to deal with more churn and more pressure on pricing. That can push up marketing spend and create swings in occupancy that a one-month snapshot won’t show. And when too many tenants are sitting below market rent, near-term pricing power gets capped.
But even a good unit mix won’t help much if collections are shaky.
Delinquency and Bad-Debt Exposure
Collections show whether occupancy is actual revenue or just occupied space. A full unit that doesn’t pay rent doesn’t produce cash flow. It just takes up capacity.
Buyers should ask for:
- Aging receivables reports split into 0–30, 31–60, 61–90, and 90+ day buckets
- Monthly bad-debt write-off summaries for at least the last 12–24 months
- Lien status reports and auction logs
At well-run facilities, annual bad debt usually stays in the low single digits. If write-offs are well above that, or if lien and auction activity looks unusually high, that’s a warning sign. Oddly enough, activity that’s too low can also be a problem. It may mean management is slow to enforce collections. In that case, reported occupancy can look better than the tenant base actually is.
Another issue is the chronic late-payer who keeps dodging lien action with partial payments. Those tenants can create a steady drag on collections without ever showing up as a vacancy in physical occupancy data.
From there, the next step is to test whether the current rent roll can hold up after acquisition.
How to Test Tenant Stability
The best way to test tenant stability is to combine unit-level rent data with payment and retention history. Start with in-place rents and compare them with current street rates by unit type and size. Big gaps can point to mark-to-market risk.
Then layer delinquency history onto those underpriced tenants. That helps show which groups are most likely to default or move out once rents move up.
Payment method can also tell you a lot. Auto-pay tenants often have lower delinquency and better retention than manual-pay tenants. So if the rent roll leans heavily on manual billing, that’s a quiet signal worth flagging.
It also helps to group tenants by move-in quarter and track average stay length plus early churn. If a big share of recent move-ins came from promo campaigns, those tenants may be less stable than they first appear. The underwriting lens should stay focused on unit type and tenant behavior, not total occupancy by itself.
Problem 3: Poor Site Layout Can Limit Usable Capacity
A clean rent roll can still give you the wrong picture if the site layout gets in the way of day-to-day use. You might see a high unit count and solid occupancy on paper, yet still own a property that’s tougher to lease at market rates. Tight aisles, weak access, and awkward unit placement can leave part of the inventory technically rentable but underused in practice.
Layout Problems That Reduce Practical Occupancy
Aisle width is a big deal. About 23 to 28 feet between buildings supports two-way traffic, with 30 feet at building ends to allow for turning movements. When aisles come in below those ranges, moving trucks can’t pass each other cleanly. At that point, tenants start avoiding certain rows, and operators often lean on discounts to keep those units filled.
Placement matters just as much. Climate-controlled units hidden behind slow elevators, long interior corridors, or long walks from parking often lag behind the rest of the property. In a multi-story building, no unit should be more than about 150 feet from an entrance. If access is annoying, rent growth hits a ceiling fast. Push pricing too far, and move-outs tend to follow.
Poor visibility and confusing ingress can also hurt demand before a prospect even reaches the gate. That kind of friction usually doesn’t show up in the rent roll.
Boat and RV Site Usability Checks
Boat and RV sites make layout problems even harder to ignore because larger rigs need room to move. For 90° parking, about 55 feet of aisle width is needed. With 30° to 60° angled stalls, that can drop to about 35 feet. At corners and gate entries, target a 50- to 55-foot outside turning radius and about a 35-foot inner radius.
Miss those dimensions, and some stalls become hard to lease at market rates, even if they appear on the site plan and count toward reported inventory.
A few trouble spots to check:
- Gate opening width
- Keypad placement
- Ingress and egress flow
A keypad that’s too close to a turn can force awkward maneuvers or block traffic behind it. A single-entry gate without loop circulation can cause backups and make access feel clumsy. And that has a direct effect on which stalls can lease at full market rent and which ones need steady concessions.
How to Test Physical Usability During Due Diligence
The best way to test layout risk is simple: compare site-plan measurements to leasable units by type, then confirm what you find with a structured site walk.
Request CAD or scaled site plans that clearly show building separations, drive-aisle widths, and stall dimensions. Then compare those measurements with the benchmarks above. During the visit, drive and walk every aisle. Look for spots where two vehicles can’t pass with ease, where backing out is required, and where lighting or signage falls apart.
For boat and RV areas, don’t just guess. Simulate actual customer maneuvers with a box truck or a pickup with trailer to see what works in the field. Onsite managers can help here too. Ask which units are hardest to lease without discounts and where minor accidents or complaints tend to cluster.
If a unit cluster or stall row falls materially short, underwrite it on its own with lower rent, higher turnover, and added reconfiguration cost.
A Practical Due Diligence Framework for Buyers
The last due-diligence check is simple in theory, but easy to miss in practice: make sure reported occupancy lines up with rent you can actually collect.
A property can look full on paper and still fall short on cash flow. That usually shows up when occupied units carry discounts, tenants fall behind, or some “rentable” space isn’t usable in the field.
Key Documents and Tests to Request
Before closing, ask for these document groups:
- Occupancy history – 12 to 24 months, by unit count and square footage
- Rent roll – current and historical (at least quarterly), with move-in dates and collected revenue
- Delinquency aging reports – bucketed at 0–30, 31–60, 61–90, and 90+ days
- Bad-debt write-off history – at least 12 months
- Concession and discount reports
- Bank deposits and GL revenue summaries – reconciled month by month against management software
- Unit-level rate-change logs
- Scaled site plans and space audit – compare leasable inventory on the plan against what’s confirmed rentable on site; any gap should be underwritten as unusable capacity
Once you have the records, put physical occupancy, economic occupancy, and delinquency-adjusted occupancy next to each other. That side-by-side view usually tells the real story faster than a polished rent roll ever will.
Occupancy Metrics Buyers Should Compare Side by Side
The gap between physical and economic occupancy is where acquisition risk tends to hide.
| Metric | What It Measures | What It Reveals About Risk |
|---|---|---|
| Reported (Physical) Occupancy | % of units or square footage marked occupied | Apparent fullness; may hide discounts and non-paying units |
| Economic Occupancy | Collected rent vs. market potential rent | True revenue performance and pricing power |
| Occupied Units Current on Rent (Delinquency-Adjusted) | Economic occupancy excluding 60–90+ day delinquencies | Reliability of cash flow and collections discipline |
| Unit-Type Occupancy | Occupancy by unit type (size, climate, boat/RV, etc.) | Segment-specific risks, seasonality, and tenant mix issues |
If the gap is wide, underwrite to the lower figure. It’s the safer way to read the deal.
Final Takeaways for Acquisition Underwriting
The only occupancy figure that matters at closing is the one that still holds up after you reconcile collections, concessions, tenant stability, and usable capacity. Oakside Co helps buyers stress-test seller narratives and spot risks that a standard rent roll review can miss.
FAQs
Why does economic occupancy matter more than physical occupancy?
Economic occupancy matters more because it shows the cash a facility actually brings in. Physical occupancy only tells you how many units are full.
That difference matters. A property can look healthy on paper with high physical occupancy and still lag because of concessions, delinquency, or old rates that no longer match the market.
As Nolen Masserman, Managing Director at Oakside, notes, a gap of more than 10% can point to operating problems that hurt NOI and property value.
How should I underwrite delinquent units before closing?
Distinguish between physical occupancy and economic occupancy. A property can look full on paper while weak collections quietly drag down what it earns.
Ask for a direct export from the management software, not just summary reports. That gives you the raw numbers instead of a polished snapshot. Then compare delinquency against physical occupancy so you can see the gap between occupied units and rent that actually comes in.
When you underwrite NOI, use actual collections, not potential revenue. That means leaning on cash received, not rent the seller hoped to collect. As Nolen Masserman, Managing Director at Oakside, notes, underwriting should reflect stabilized cash flow, not seller projections.
Can a poor site layout reduce real occupancy and rent growth?
Yes. A poor site layout can make it harder to keep occupancy high and push rents up. Things like narrow drive aisles or tight turning radii can make access a hassle, especially for tenants with oversized vehicles or moving equipment.
That extra friction can cut demand for larger units and lead to more turnover. As Nolen Masserman, Managing Director at Oakside, notes, layout should fit local demand to support occupancy and protect value.