

If storage revenue is off by even a little, value, NOI, and DSCR can drop fast. I’d review 10 items before I trust a storage underwriting file: rent roll accuracy, billed rent vs. collected cash, physical vs. economic occupancy, in-place rent vs. street rate, move-in pricing, lease-up pace, concessions, bad debt, manager overrides, and market support.
Here’s the short version: in a market where occupancy is often around 88%, there is not much room for loose revenue assumptions. A property can look 90% occupied on paper and still perform closer to the high-70% range economically once I net out discounts, delinquency, and rent gaps. That’s why I’d test the source files first, then tie every pro forma line back to actual property data.
What I’d check:
- Rent roll quality: missing rents, duplicate units, bad status codes, and $0.00 occupied units
- Collections: whether billed rent matches cash received
- Occupancy: physical occupancy versus what the property is actually earning
- Rate gap: in-place rents compared with current street rates
- Move-ins and lease-up: whether new leases and absorption support the model
- Revenue leakage: concessions, write-offs, lien-sale losses, waived fees, and manual discounts
- Market support: comp rates and seasonal swings, especially when comparing self-storage vs RV storage investment profiles
- Pro forma tie-out: whether GPR, vacancy, concessions, bad debt, and other income trace back to source files
For boat and RV assets, I’d spend less time on rent per square foot and more time on occupancy, average rent per stall, and revenue per available space.
| Check | What I’m testing |
|---|---|
| Rent roll | Unit data and current rents |
| Collections | Billed rent vs. collected cash |
| Occupancy | Physical vs. economic performance |
| Rate position | In-place rents vs. street rates |
| Move-in pricing | Promo-adjusted new lease rates |
| Lease-up pace | Net absorption vs. pro forma |
| Concessions | Discount load as a share of GPR |
| Bad debt | Write-offs and lien-sale shortfalls |
| Overrides | Manual discounts and waived fees |
| Market fit | Comp support, seasonality, and tie-out |
The goal is simple: I want a clean revenue story before pricing the asset.
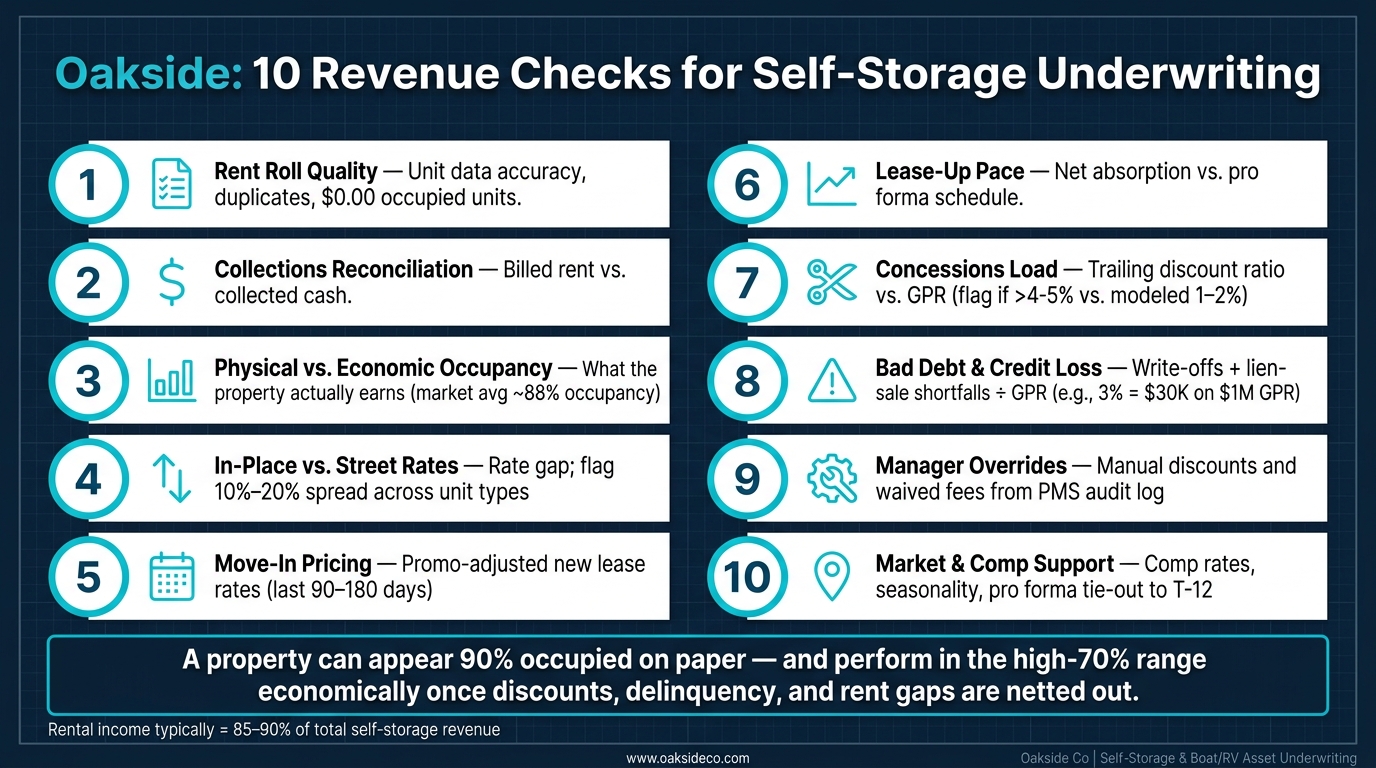
10 Revenue Checks for Self-Storage Underwriting
Base File Checks: Rent Roll, Collections, and Occupancy
Start with the base file: the rent roll, T-12, and collections data. If those files don’t tie out, stop there before you test any growth assumptions.
1. Check Rent Roll Quality and Unit-Level Accuracy
Look at the rent roll unit by unit. Each unit should have a unique ID, the right square footage, current status, move-in date, and current monthly rent. Pull the file and match it against the management system’s unit inventory. If the total unit count, size mix, or rentable square footage doesn’t line up with the offering materials, you’ve got a problem before a single model input goes in.
Flag issues like:
- Duplicate unit IDs
- Missing rent fields on occupied units
- $0.00 occupied units
- Conflicting status codes, like a unit marked “vacant” that also shows a tenant name and move-in date
Then compare each unit’s in-place rent with the current street rate for that unit type. If you see a 10% to 20% gap across a large chunk of units, that usually points to discounting or stale rate data.
2. Reconcile the Rent Roll to Actual Collections
The rent roll shows what’s billed. The T-12 shows what’s collected. Add up scheduled rent from the rent roll for a given month, then match that number to the rental income line on the operating statement for the same period. If there’s a variance, trace it back to concessions, delinquency, or timing differences.
Keep rental income separate from late fees, admin fees, insurance, retail, and other income. Model non-rent income on its own, because those lines affect EGI and tend to move around more. Rental income usually makes up 85%–90% of total revenue for a self-storage asset.
3. Compare Physical Occupancy to Economic Occupancy
Physical occupancy tells you how many units are occupied. Economic occupancy tells you how much rent is collected against potential gross rent at full street rates. That gap is where a lot of underwriting risk sits.
Calculate both every month over at least 12–24 months. Watch for physical occupancy staying flat while economic occupancy slips. Also watch for a large spread between the two that sticks around month after month. Adjust for owner-used, complimentary, damaged, and offline units. Those shouldn’t be treated like standard occupied income. Economic occupancy, not physical occupancy, is what supports NOI.
Once these base metrics tie out, you can move on to rent growth, move-in pace, and the rest of the upside story.
sbb-itb-09b4138
The 10 Revenue Checks in the Underwriting File
Once your base file ties out, move through the full checklist. These ten checks start with what the property earns today and work toward what it can reasonably earn next. The point is simple: anchor the story in operating history, not wishful thinking. Checks 1–4 focus on pricing and leasing pace. Checks 5–10 focus on revenue leakage and whether the market backs up the upside.
Checks 1–4: In-Place Rents, Street Rates, Move-In Trends, and Lease-Up Pace
Check 1 – In-place rents vs. street rates. For each unit type, calculate the average in-place rent and compare it with the current posted street rate. Only underwrite that gap when occupancy and move-in data show that rate growth is holding up.
Check 2 – Street rate integrity and change history. Pull the rate-change log and confirm that rates moved with the market while keeping a consistent unit-size ladder.
Check 3 – Recent move-in economics. Review the last 90–180 days of move-ins and compare each tenant’s effective starting rent with the street rate in place on that date. If most new leases are closing 5%–10% below posted rates because of active promotions, you can’t underwrite full street rate on future leases unless there’s a documented plan to roll those promos back.
Check 4 – Lease-up pace vs. pro forma. For unstabilized or expanding assets, pull monthly net absorption – move-ins minus move-outs – and compare it with the original pro forma schedule. If the pro forma assumed 25 net units per month but the trailing 12 months show 12–15, your forward view should match the pace you’ve actually seen unless there’s a clear, documented reason demand will step up.
Checks 5–7: Concessions, Bad Debt, and Manager Overrides
Check 5 – Concessions load. Add up all revenue given away through first-month-free offers, $1 move-ins, and recurring discounts over the trailing 12 months. Then divide that total by gross potential rent (GPR) to get the concessions ratio. If trailing concessions run 4%–5% and the pro forma assumes 1%–2%, forward revenue is probably too high unless there’s a solid plan to cut promo activity.
Check 6 – Bad debt and credit loss. Total write-offs plus lien-sale shortfalls over the trailing 12 months, then divide by GPR. A 3.0% credit loss rate on a $1,000,000 GPR property means $30,000 of annual revenue never shows up. If underwriting assumes 1.0% and collection practices aren’t changing, that’s an aggressive call that needs support.
Check 7 – Manager overrides and waived fees. Pull the audit log from the property management system and look for manual rate changes, unapproved discounts, and waived admin or late fees. If overrides happen often – especially on recurring rent, not just one-time fees – that’s a sign posted rates may be higher than what the market is actually paying. Say overrides removed $15,000 of rent and another $10,000 of ancillary fees over 12 months. If the pro forma still assumes full rate realization and full fee capture, that hole needs to be fixed before you price the deal.
Checks 8–10: Comp Support, Seasonal Demand, and Pro Forma Tie-Out
After you’ve measured internal leakage, test whether local comps and seasonality support what’s left of the upside.
Check 8 – Comparable rent support. Identify four to eight nearby facilities with a similar product type, age, and access profile. Record unit-level street rates for common sizes, convert them to $/sq ft, and compare them with the subject’s in-place and projected rents. If the comps don’t support the pro forma, trim the rent-growth line. For boat and RV assets, compare covered to covered and outdoor to outdoor. Mixing product types will skew the comp set.
Check 9 – Seasonal demand and seasonal rate swings. Map 24–36 months of monthly occupancy and rental rate data by unit type. Boat and RV assets tend to be more seasonal, so test monthly occupancy and rate swings on their own. In some markets, RV occupancy jumps from March through June, then softens in late summer and fall, with advertised annualized rates per square foot for common RV sizes falling from about $5.90 to $5.74 between June and September. A pro forma that assumes flat occupancy and steady rent growth all year misses that pattern. If the swings are real, build them into the revenue bridge.
Check 10 – Pro forma tie-out to actuals. Build a revenue bridge from GPR to EGI and tie each line back to a source file. Every line should trace to trailing data, with clear, documented adjustments for any gap versus the T-12.
| Revenue Bridge Line | What to Verify |
|---|---|
| Gross Potential Rent (GPR) | Ties to rent roll at full street rates |
| Vacancy & Lease-Up | Supported by trailing absorption pace |
| Concessions | Matches trailing 12-month promo history |
| Credit Loss / Bad Debt | Reflects actual write-offs and lien shortfalls |
| Other Income | Modeled separately from rental income |
| Effective Gross Income (EGI) | Reconciles to T-12 with documented adjustments |
How to Pressure-Test Revenue Assumptions
Use the file-backed findings from the 10 checks to build downside cases through sensitivity analysis. The goal is simple: turn each check into a downside scenario that puts a number on revenue risk.
Run Downside Cases on Growth, Concessions, and Credit Loss
Start with the base case. Use current achieved rents, trailing concessions, and file-backed credit loss.
Then test pricing pressure. If rent growth stalls, what happens? In a softer market, NOI and DSCR can slip fast, even when the rent roll still looks steady on the surface.
Test timing pressure too, especially for non-stabilized assets. Lease-up risk hits these deals harder. If leasing slows, stabilization moves out, and Year 2 revenue comes down with it.
The point of the pressure test is to show where coverage breaks and whether the deal still clears the target return.
Use a Revenue Review Table to Summarize Findings
Next, log every adjustment in one place so reviewers can trace each change from assumption to model input. After you run the scenarios, pull the results into one review table. That gives reviewers a fast read on what changed and why.
Each row should include:
- the source reviewed
- the finding
- the model adjustment tied to that finding
And each adjustment should map to a named input in the underwriting model. No guesswork. No loose ends.
| Check | Source Document Reviewed | Key Finding | Underwriting Adjustment Required |
|---|---|---|---|
| 1 – Rent Roll Quality | Unit-level rent roll | 25% of units carry legacy discounts | Cap discounts; adjust in-place rent assumptions |
| 2 – Collections Reconciliation | Bank statements, general ledger | Billed rent does not reconcile to collected cash | Reduce effective rent to match actual collections |
| 3 – Physical vs. Economic Occupancy | Rent roll, T-12 P&L | Economic occupancy trails physical once concessions and bad debt are netted | Model the lower economic occupancy |
| 4 – In-Place vs. Street Rates | Rate change log, rent roll | In-place rents average 7% below current street rates | Phase rent-to-market over time; do not assume immediate capture |
| 5 – Move-In Trends & Lease-Up Pace | Move-in/move-out log | Net absorption is weaker than the pro forma assumes | Reduce lease-up pace; extend stabilization timeline |
| 6 – Concessions Load | PMS concessions report | Trailing concessions exceed the pro forma assumption | Increase concessions to the trailing level |
| 7 – Bad Debt & Credit Loss | Write-off log, lien-sale records | Credit loss is higher than the model assumes | Raise bad debt to the file-supported level |
| 8 – Manager Overrides | PMS audit log | Manual overrides and waived fees reduce realized rent | Reduce other income and effective rent by the override amount |
| 9 – Comp Support | Comp survey, street rate data | Pro forma rent growth exceeds what the comp set supports | Trim rent-growth line to comp-supported levels |
| 10 – Seasonal Demand & Pro Forma Tie-Out | 24-month occupancy/rate data, T-12 | Historical seasonality does not match the flat pro forma path | Build a seasonal occupancy curve; model them in monthly revenue |
For each check, assign a reference ID. Also note the prior assumption, the revised assumption, who made the change, and when they made it. That audit trail is what makes the file credible.
Conclusion: Build a Clean Revenue Story Before You Price the Asset
After the 10 checks, the file should tell one clear revenue story: what is real today, what is repeatable, and what is supportable. Every number in a storage underwriting model should trace back to the same base: accurate rent roll data, verified collections, and assumptions tied to what the file actually shows. That’s how the revenue story stands up in diligence.
Treat the 10 checks like one chain: file accuracy, cash collection, occupancy, leakage, then market support. Miss one link, and the whole story gets weaker. That order keeps the model tied to actual performance instead of guesswork.
Clean data can support tighter pricing and stronger proceeds. Weak data usually does the opposite. Bad data cuts value.
Clear rent rolls, collections tie-outs, and documented assumptions can move diligence along faster and help capital markets execution.
Oakside Co can help review rent rolls, collections, concessions, and comps for self-storage and boat & RV assets. The goal is a revenue story that is clean, defensible, and ready to price.
FAQs
How do I calculate economic occupancy?
Divide actual revenue collected by gross potential revenue. This gives you a clearer read on a property’s revenue performance than physical occupancy, because it accounts for concessions, delinquent accounts, and unit-level discounting.
As noted by Nolen Masserman, Managing Director at Oakside, economic occupancy often trails physical occupancy by 3% to 8% in stabilized assets. A gap above 10% calls for closer underwriting review.
What revenue issues matter most in a storage underwriting file?
The biggest revenue issues come down to one thing: is the income steady, and is it backed by hard numbers instead of seller forecasts? That’s where the work starts.
Begin with the gap between physical occupancy and economic occupancy. If that spread is large, it can signal trouble with collections, heavy concessions, or units that look occupied on paper but aren’t paying as they should.
Then review the details that shape the income story: rent roll quality, concessions, bad debt, manager overrides, comp support, seasonal demand swings, ancillary income, unit mix performance, rate stagnation, and overall data integrity.
When should I adjust a storage pro forma downward?
Adjust it downward when underwriting points to performance below market norms or levels the property can keep up over time. That often applies when occupancy drops below 85% to 90% or when the spread between physical and economic occupancy is more than 10%.
You should also trim projections when occupancy is being propped up by rent discounts that won’t last or other numbers that make results look better than they are. In those cases, use more conservative assumptions for lease-up timing and rent growth if market conditions call for it.