If I’m comparing urban and suburban self-storage, I should not underwrite them the same way. Urban assets often have higher rent per square foot, tighter supply, and more entitlement risk. Suburban assets often have lower land cost, larger sites, and extra income from boat and RV storage.
Here’s the article in plain English:
- Urban storage tends to work best in dense areas with renters and small businesses.
- Suburban storage tends to work best where households need more space, drive-up access, and vehicle parking.
- Urban trade areas are often 1–2 miles in dense neighborhoods, while suburban demand is often measured across 3–5 miles or a 10–20 minute drive.
- Urban rents can reach $22–$35+ per sq. ft. per year, but build costs can run $130–$180 per sq. ft. all-in.
- Suburban rents are often lower, around $12–$17 per sq. ft., but suburban development may cost only $45–$65 per sq. ft.
- Urban occupancy often runs around 92%–95%. Suburban occupancy is often closer to 82%–89%.
- Boat and RV storage is usually a suburban play, backed by 8.1 million RV-owning U.S. households and about 11.8 million registered or documented boats in 2024.
- The right choice depends on rent, land basis, supply, tenant mix, seasonality, and vehicle demand in the trade area.
If I had to boil it down even more, it’s this: urban storage sells convenience and scarcity; suburban storage sells space and land-driven income.
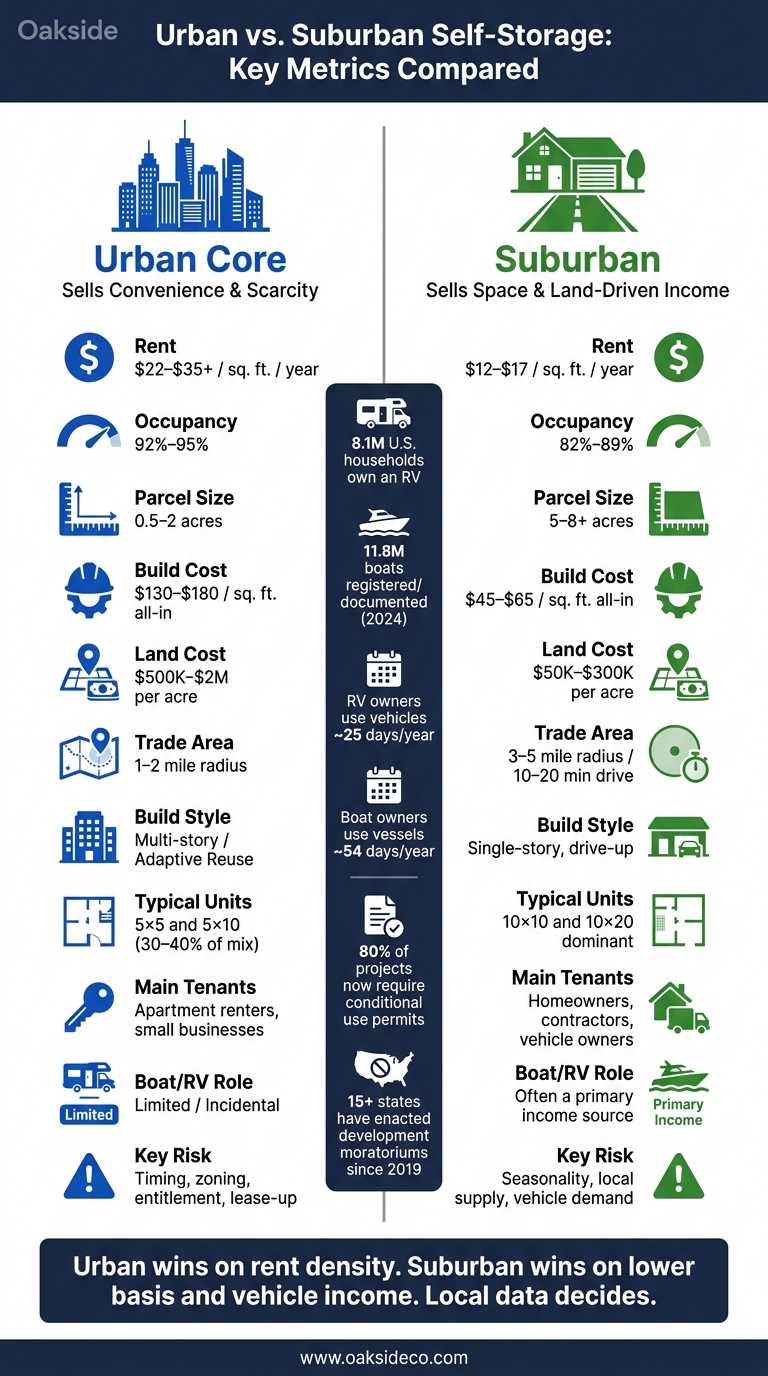
Urban vs. Suburban Self-Storage: Key Metrics Compared
Quick Comparison
| Factor | Urban Core | Suburban |
|---|---|---|
| Main demand base | Apartment renters, small businesses | Homeowners, contractors, vehicle owners |
| Typical rent | $22–$35+ / sq. ft. / year | $12–$17 / sq. ft. / year |
| Occupancy | 92%–95% | 82%–89% |
| Parcel size | 0.5–2 acres | 5–8+ acres |
| Build style | Multi-story, reuse projects | Single-story, drive-up |
| Land cost | Often $500,000–$2,000,000 per acre | Often $50,000–$300,000 per acre |
| Unit mix | More small units like 5×5 and 5×10 | More 10×10, 10×20, and parking |
| Boat/RV role | Limited | Often a main income source |
| Main risk | Timing, zoning, construction, lease-up | Seasonality, local supply, vehicle demand |
Bottom line: if you want rent density, urban markets may stand out. If you want lower basis and more land options, suburban markets may have the edge. The article’s core message is simple: look at local data first, then match the asset type to that market.
sbb-itb-09b4138
Urban Self-Storage Demand: Higher Rents, Tighter Land, Different Tenant Needs
Rent Levels and Land Constraints in Urban Markets
Urban self-storage is a different animal. Land is scarce, entitlements can drag on, and zoning rules often make new projects hard to get off the ground. That keeps supply tight, which can help support higher rents.
The cost gap tells the story. Developing climate-controlled urban storage can cost more than $72 per square foot, versus $15–$30 per square foot for a suburban drive-up facility. That difference often pushes developers into multistory projects or adaptive reuse. Both paths take more time and more money.
In cities like New York, San Francisco, and Boston, entitlement timelines alone can stretch past 18 months. On top of that, about 80% of self-storage projects now need conditional use permits instead of moving ahead by right. And since 2019, more than 15 states have put moratoriums or other limits on new development in place.
Put it together, and you get a market where new supply is tough to deliver. That can support stronger rents, but only if the deal is priced with execution risk in mind. Boston is a good example. As of early 2026, it had almost no new construction and just 0.7 square feet per capita, which made it one of the tightest major self-storage markets in the U.S. That kind of scarcity gives owners pricing power because adding new product is so difficult. It also marks a clear split from suburban sites, where bigger parcels and vehicle storage are often easier to pull off.
Urban Tenant Mix and Move-In Drivers
A big chunk of urban demand comes from apartment renters. People in smaller units still need space for furniture, holiday items, paperwork, sports gear, and all the extra stuff that doesn’t fit at home. In dense cities, frequent moves keep that demand active well beyond the busiest moving months.
Small businesses add another layer of demand. Retailers, service businesses, and contractors often use urban storage for inventory, records, and equipment. That setup makes sense in markets where commercial rents are high and back-of-house space is limited.
Urban move-ins still tie back to the Four Ds, relocation, and apartment turnover. But demand in cities tends to be steadier and less seasonal. That’s a sharp contrast with suburban storage, which leans more on larger households and people who need room for vehicles.
Oakside on Urban Underwriting
At Oakside, Cameron Vale makes a simple point: urban storage should be underwritten as an execution-risk story, not just a rent story.
If entitlement delays drag out, construction gets more complicated, or lease-up takes longer than expected, the upside on paper can shrink fast. That’s why urban deals only make sense when basis, entitlement risk, and lease-up timing are modeled conservatively.
The next step is to compare those urban economics with suburban sites across rent, land, and tenant mix.
Suburban Self-Storage and Boat/RV Demand: More Land, Larger Formats, Broader Use Cases
Lower Rents but Larger Sites and More Operating Flexibility
Suburban self-storage usually sits on bigger parcels and leans on single-story drive-up layouts, wide aisles, and outdoor vehicle parking. That extra room cuts down on development limits and opens up more ways to make money.
You can see the difference right away in the land. Suburban sites often trade in the $50,000–$300,000 per acre range, while urban and high-traffic locations can run $500,000–$2,000,000 per acre. When land is cheaper, operators can build more rentable area without adding floors or depending on structured parking.
The unit mix shifts too. Suburban properties tend to offer larger drive-up units averaging 140–180 sq. ft., versus 90–110 sq. ft. in urban markets. So even if rent per square foot is lower, the total rent per tenant can still be higher because the units are bigger. Add boat and RV parking, and a site can keep revenue strong at the property level even with lower rates on a per-square-foot basis.
Lower basis helps, no doubt. But suburban performance still comes down to one thing: who rents the space.
Suburban Tenant Mix, Seasonality, and Boat/RV Demand
The main customer base is pretty straightforward. Homeowners use storage for garage overflow, seasonal items, renovations, downsizing, and estate cleanouts. Contractors and service businesses also rent drive-up units for equipment and inventory.
Boat and RV storage adds another layer of revenue that urban properties usually don’t have. About 8.1 million U.S. households own an RV, and around 11.8 million boats were registered or documented in 2024. RV owners use their vehicles about 25 days per year, and boat owners about 54 days. That leaves those vehicles sitting idle for most of the year, which goes a long way toward explaining off-site storage demand. On top of that, HOA rules and local ordinances often ban long-term driveway or street parking for boats and RVs, sending that demand straight to suburban storage sites.
Vehicle storage demand tends to follow a few local markers:
- Homeownership rates
- Household incomes
- Access to recreation nodes like lakes, coastlines, marinas, and interstate corridors
Many purpose-built facilities sit 5–15 miles outside city limits, often near major highway interchanges and recreation hubs, where convenience and land pricing line up better.
Seasonality is also fairly easy to track. Spring and early summer usually bring occupancy bumps tied to moves and cleanouts. Boat and RV demand climbs during recreation season. Operators that offer annual contracts or discounted winter storage rates can flatten some of those swings.
Oakside on Suburban Cash Flow Durability
"Suburban self-storage and boat/RV assets generate durable cash flow when underwriting reflects local housing formation, seasonality, and actual vehicle-ownership data."
- Nolen Masserman, Managing Director at Oakside
In practice, that means treating vehicle storage as a separate revenue stream with its own occupancy pattern, pricing behavior, and seasonality instead of folding it into one site-wide assumption. When a suburban deal models those pieces separately, the pro forma tends to be easier to underwrite with more precision.
Those differences show up most clearly when you compare rent, parcel size, tenant mix, and move-in drivers side by side.
Urban vs. Suburban: A Direct Comparison Across Key Operating Metrics
Rent, Parcel Size, Tenant Mix, and Move-In Drivers Side by Side
The contrast stands out fast when you line up the numbers.
Urban self-storage usually rents for $22–$35+ per sq. ft. per year, while suburban properties tend to land closer to $12–$17 per sq. ft.. At first glance, urban looks stronger. But rent alone doesn’t tell the whole story.
Build costs are a different beast. Urban infill projects for climate-controlled, vertical storage can run more than $130–$180 per sq. ft. all-in. A single-story suburban drive-up facility is often closer to $45–$65 per sq. ft.. So yes, urban sites can pull in more rent per foot. That does not automatically mean better returns when the cost to build and the basis are that far apart.
Here’s how the two formats compare:
| Metric | Urban Core | Suburban |
|---|---|---|
| Rent per sq. ft. (annual) | $22–$35+ | $12–$17 |
| Occupancy rate | 92–95% | 82–89% |
| Typical unit mix | 5×5 and 5×10 units often make up 30–40% of the mix | More 10×10 and 10×20 units, with smaller units a lower share |
| Typical parcel size | 0.5–2 acres | 5–8+ acres |
| Development format | Multi-story, adaptive reuse | Single-story, ground-up |
| Dominant tenant type | Apartment renters, small businesses | Homeowners, contractors |
| Primary move-in drivers | Relocation, downsizing, renovation | Garage overflow, seasonal storage, vehicle ownership |
Urban properties tend to win on rent density and occupancy. Suburban properties usually win on lower basis, bigger parcels, and more room for vehicle income. That last point matters a lot once boat and RV storage enters the picture.
Where Boat/RV Storage Fits in the Urban-Suburban Comparison
Boat and RV storage is mostly a land and access play. You need space, workable ingress and egress, and zoning that allows it. Urban cores usually don’t check those boxes. Outer-suburban sites often do.
That shifts the edge even more toward suburban and fringe locations.
| Market Type | Boat/RV Revenue Role | Key Factors |
|---|---|---|
| Urban Core | Incidental | Zoning limits, no large parcels, access constraints |
| Inner-Ring Suburban | Secondary | Some outdoor parking possible; demand exists but land is still constrained |
| Outer Suburban / Fringe | Primary | Large parcels, lower land cost, proximity to recreation corridors and highways |
A facility serving a big metro can still tap into vehicle-storage demand. But in most cases, that only works if the site sits on the suburban edge or along commuter and recreation routes. In the urban core itself, boat and RV storage is usually too constrained to model as much more than incidental income.
Using Market Data to Build a Better Storage Portfolio
Key Data Points for Deciding Where to Allocate Capital
Once you get past the operating differences, the next step is simple: decide where the money should go. And that decision should come from trade-area data, not broad “urban vs. suburban” labels.
Start with demographics and match the product to local demand. Renter-heavy urban areas often line up better with conventional storage. By contrast, homeownership-heavy suburban corridors near lakes or campgrounds tend to be a better fit for boat/RV storage.
It also helps to compare per-capita supply with local norms. If a market is holding 92%+ occupancy and inventory sits below the local average, that usually points to under-supply. On the other hand, if occupancy is stuck in the mid-80s, rents are flat, and operators are leaning on concessions, that’s a sign of softness.
Boat/RV assets need their own demand test. For these properties, compare registered boats and RVs with the number of dedicated storage spaces in the trade area. Waiting lists at nearby marinas, HOA rules that block driveway storage, and tight on-street parking can all point to structural under-supply.
Seasonality and lease-term data matter too. Urban self-storage usually runs all year, with demand peaks tied to residential turnover. Suburban boat/RV demand often jumps before boating and camping season, but it can also bring in multi-year tenants. That changes how cash flow should be modeled.
How Oakside Applies Data in Portfolio Planning
This screening process feeds straight into underwriting. Oakside reviews both market and asset data before it recommends where capital should be allocated.
The team looks at rent rolls to find effective rent after concessions, checks the history of rate increases, and separates stabilized occupancy from pro forma projections. Tenant-mix reviews look at the split between residential and commercial users and, when it applies, the share of boat/RV vs. self-storage customers that adds revenue diversification.
"We’re not trying to tell clients that urban is better or suburban is better. We’re trying to show them what the data actually says about a specific asset in a specific market – and what that means for returns over a full hold period." – Cameron Vale, President at Oakside
Regional demand studies also help separate true urban scarcity from suburban vehicle-storage demand.
Conclusion: What Owners and Investors Should Take Away
Put together, these inputs support a pretty clear allocation framework. Urban self-storage often leads on rent intensity and supply constraint. Suburban assets often lead on lower basis, larger parcels, and boat/RV upside.
The portfolios that tend to hold up best are built on refreshed trade-area, housing, supply, occupancy, and rent-roll data, not one-time underwriting.
FAQs
How should I underwrite urban and suburban storage differently?
Underwrite them differently. Urban assets tend to come with higher entitlement risk, higher replacement costs, and rent setups that don’t look the same as what you see in the suburbs.
Suburban assets are more tied to household formation and land availability. That changes how you read demand, future supply, and pricing power.
So the focus should be on:
- Trade area
- Local supply and pipeline
- Economic occupancy instead of physical occupancy
For boat and RV assets, start with the installed vehicle fleet to size demand. Also factor in larger sites and longer entitlement timelines.
When does boat and RV storage meaningfully improve returns?
Boat and RV storage can improve returns in markets with high barriers to entry. That usually means places with tight zoning rules or a need for large 7- to 10-acre sites, both of which make it harder for new competitors to show up.
The best returns tend to come from areas with high boat and RV ownership, especially where HOA or city rules limit parking at home. Pair that demand with lean operations and extra income from wash bays, power hookups, or concierge services, and the math starts to look a lot better.
What local market data matters most before choosing a storage asset type?
Put hyper-local data first. Look at what’s happening within a 3-mile radius, not national averages that can blur the picture.
Pay close attention to NRSF per person to find supply gaps. Then compare physical occupancy with economic occupancy, review local population density and household income, and check the competitive supply pipeline.
A gap of more than 10% between physical and economic occupancy can signal collection problems or heavy concessions. As Nolen Masserman, Managing Director at Oakside, notes, storage demand is highly local.