A storage deal can look 95% full and still miss badly on cash flow. I’d screen this type of deal by checking nine risk areas first: in-place cash flow, submarket demand, new supply, rent lag, exit cap risk, repair needs, tax reset, expense gaps, and weak diligence.
Here’s the short version: NOI, DSCR, and value can shift fast when collections trail occupancy, expenses are too low, or the market can’t hold rents. A $100,000 NOI miss at a 6.0% cap rate can cut value by about $1.67 million. A tax jump, rent cuts, or a small expense miss can also push DSCR below the 1.20x to 1.25x range many lenders want.
If I were reviewing a deal, I’d focus on these checks right away:
- Cash flow today: Compare the T-12, rent roll, bank deposits, and delinquency reports.
- Demand in the trade area: Study the 3- to 5-mile submarket, not just the metro.
- Competing supply: Check permits, planned projects, and discounting by nearby sites.
- Rent quality: Compare in-place rents with current street rates and watch churn risk.
- Exit risk: Stress-test a 50 bps cap-rate move.
- Physical issues: Price in roofs, asphalt, lighting, security, drainage, and doors.
- Taxes: Model reassessment from the purchase price, not the seller’s old tax bill.
- Expenses: Rebuild payroll, management fees, utilities, repairs, insurance, and marketing.
- Diligence depth: Verify income, leases, tax records, zoning, title, and Phase I reports.
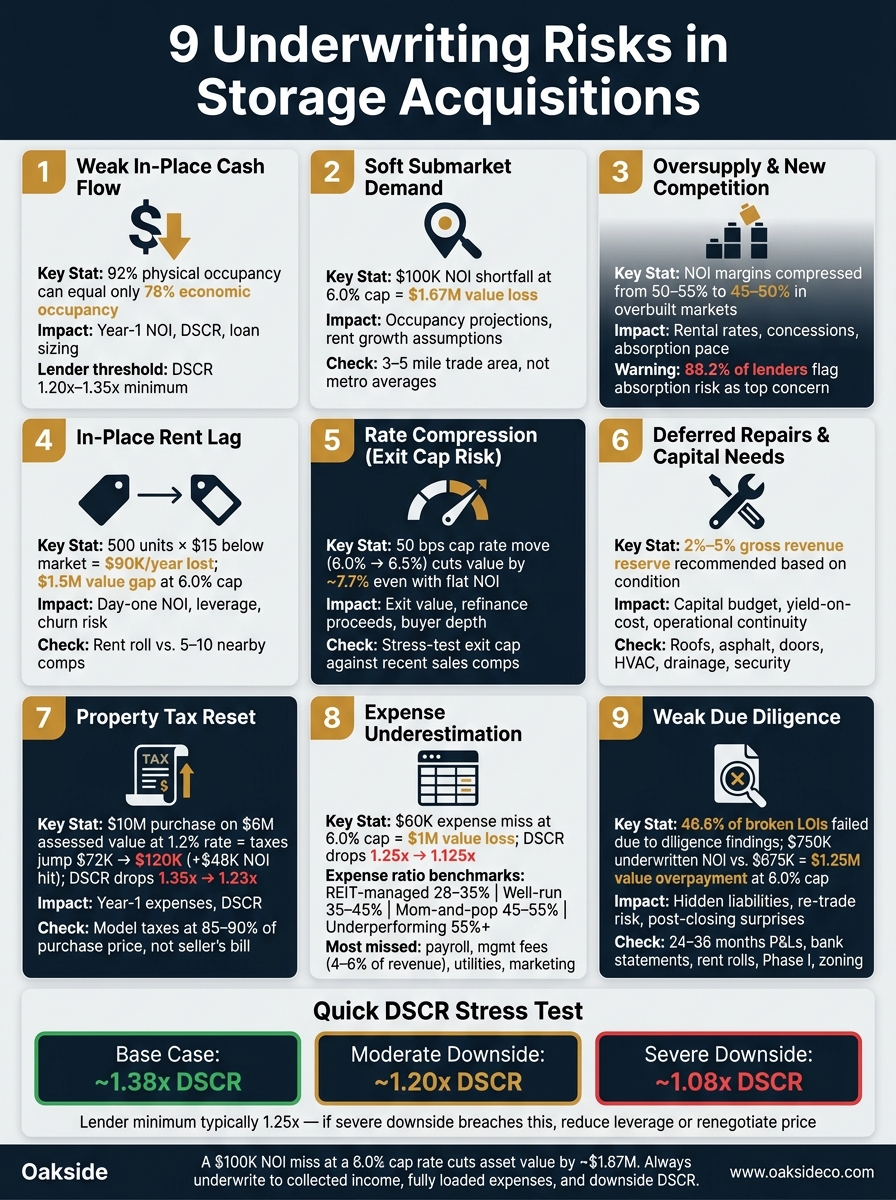
9 Underwriting Risks in Storage Acquisitions: Impact & Verification Checklist
Quick Comparison
| Risk | Main hit to the deal | Fast check |
|---|---|---|
| Weak in-place cash flow | Year-1 NOI, DSCR | T-12, bank deposits, collections |
| Soft submarket demand | Occupancy, rent growth | 3- to 5-mile demand data, comps |
| Oversupply/new competition | Rates, concessions, lease-up | Permits, pipeline, comp calls |
| In-place rent lag | Day-one revenue, churn | Rent roll vs. market rates |
| Rate compression | Exit value, refinance | Sales comps, self-storage cap rate stress test |
| Deferred repairs/capital needs | Near-term cash needs | Site walk, repair history, bids |
| Property tax reset | Year-1 expenses, DSCR | County records, reassessment rules |
| Expense underestimation | NOI, loan sizing | P&Ls, invoices, contracts |
| Weak due diligence | Deal pricing, surprise issues | Full record tie-out |
Bottom line: I wouldn’t trust headline occupancy or a polished pro forma on its own. I’d underwrite to collected income, fully loaded expenses, and downside DSCR before deciding what the asset is worth.
sbb-itb-09b4138
Why Submarket Demand Is the First Thing to Check
Start with the submarket. That screen sets the baseline for every other underwriting assumption.
The main question is straightforward: Is there enough durable, stable demand in this trade area to support occupancy and rent growth over time? Here, durable means demand that can hold up through mild downturns, not just during hot stretches. A submarket tied to one employer, seasonal tourism, or a short-term construction surge may look good on paper, but it’s fragile. And fragile local demand can make it tough to meet the debt-service coverage ratios (DSCR) lenders usually want on stabilized storage deals, which often fall in the 1.20x–1.30x range.
Even markets that look strong can run into trouble when supply grows faster than demand. Seasonal markets make this even trickier. A facility near a U.S. recreational area, for example, might post 95% physical occupancy from June through August, then slip to 75–80% in winter. If you use a flat annual pro forma, you’ll likely overstate income and weaken DSCR during off-peak months. A better approach is to model occupancy by season and make sure the deal still clears minimum DSCR levels at its low point, not just at the top.
That’s why trade-area analysis comes before asset-level underwriting. First, define the trade area, usually a 3–5 mile radius adjusted for highways and natural barriers. Then:
- pull demographic and employment data
- inventory competing square footage
- calculate supply per capita
Only after that should you move to asset-level assumptions like unit mix, revenue management, or marketing spend. If demand clears this screen, the next step is underwriting current cash flow.
1. Weak In-Place Cash Flow
Once a submarket passes your demand screen, the next question gets very direct: what is this property earning today? Weak in-place cash flow is risky because a property can look full on paper while bringing in much less income than it should. At that point, you need to tell the difference between a short-term management problem and a deeper revenue issue.
Physical occupancy can make collections look better than they are when discounts, old lease rates, and bad debt pull economic occupancy down. A property at 92% physical occupancy might be running at only 78% economic occupancy. In self-storage, value comes from income. So when actual NOI is lower, supportable value drops too, and debt coverage gets thinner.
If day-one NOI only barely covers debt service at closing, you don’t have much room for error. A small drop in occupancy or a modest bump in expenses during year one can create trouble fast. Many institutional lenders want a DSCR of 1.20x–1.35x on stabilized storage deals. A property with weak in-place cash flow may fall short unless rent growth is already built into the deal. And if that growth doesn’t show up when the buyer expects it to, the problem gets bigger. That’s when an underwritten gap turns into a real issue: the spread between day-one performance and projected underwriting can widen after closing.
Before you assume that gap will shrink after takeover, make sure the cash flow is there. Reconcile the trailing 12-month (T-12) operating statement against bank deposits, rent rolls, and delinquency reports. As a rule of thumb, delinquency below 3% is often manageable. Above 5% usually points to a pricing or operating problem that should be built into underwriting.
Use these records to separate actual collections from seller pro forma:
- T-12 operating statement
- Bank deposits
- Rent roll
- Delinquency report
If collections are weak, the next step is simple: figure out whether the submarket can support the rent lift needed to fix them.
2. Soft Submarket Demand
The next test is simple: can this submarket keep the cash flow going?
Soft submarket demand hits the full trade area, not just one site. In most cases, that means a 3- to 5-mile radius where occupancy stays under market benchmarks for a long stretch, rent growth is flat or negative, and operators lean on concessions to fill units. The issue isn’t just what the property earns today. It’s whether local demand can support that income when the loan gets harder tomorrow.
This is where deals can go sideways. Local occupancy can look very different from the national picture, so underwriting needs to track the trade area, not the metro headline. Buyers often plug in metro-level assumptions to a submarket that simply can’t carry them. That’s the gap.
When demand is weak, the hit shows up fast in both value and debt coverage. A $100,000 NOI shortfall at a 6.0% cap rate cuts value by about $1.67 million and can drag a 1.25x DSCR down to roughly 1.08x. That’s why sharp underwriters stress-test deals against actual submarket occupancy history instead of leaning on metro averages.
Start with the demand drivers inside the trade area:
- Population growth
- Household formation trends
- Local home sales activity
Those numbers help show whether storage demand has room to hold up.
Then get out in the field and visit competing facilities yourself. You want to see whether the submarket can hold market rents without heavy concessions. If even strong operators are running recurring deep promotions, that’s a warning sign. The submarket is buying occupancy, not demand. This disconnect is a primary driver behind the looming self-storage bubble. If new units can’t be absorbed without discounts, the next place to look is competition and incoming supply.
3. Oversupply and New Competition
When demand is already soft, new supply can turn a manageable gap into a pricing war. That’s the next thing to test. Oversupply shows up when rentable square footage grows faster than local demand, and that pressure is still visible across the country as new construction and inventory growth add capacity in many markets.
Here’s where it gets painful: oversupply doesn’t just hit occupancy. It hits pricing. Operators often have to cut rates, add concessions, or both. As a result, net effective rent drops even if physical occupancy looks steady on paper. In overbuilt submarkets, NOI margins have slipped from about 50%–55% to 45%–50%.
That kind of margin squeeze can do serious damage to value and cap rates. A 10% NOI drop on a $1,000,000 asset at a 6.0% cap rate cuts value by about $1.67 million. And fixed costs don’t magically shrink when rents fall. Taxes, insurance, and core payroll are still there. That helps explain why 88.2% of lenders point to absorption risk during lease-up as a top concern, while 58.8% flag oversupply as a main underwriting issue. If your base-case DSCR is already thin, even a modest rent decline can push it below lender minimums.
To make sure the pressure is real, look at what’s actually being built, not just what’s being marketed. Don’t lean on the seller’s competitive summary alone. Pull municipal building permits and planning commission records yourself. That’s often where you’ll spot projects that haven’t been pushed hard in marketing yet.
A few checks help:
- Review local permits and planning filings for pending or approved projects
- Call competing facilities to confirm what’s under construction or leasing
- Check whether operators are holding price or using discounts to fill space
If multiple facilities are quietly cutting rates while new square footage is still coming online, the market usually isn’t defending price. It’s still trying to absorb demand.
4. In-Place Rent Lag
A deal can still go sideways in a steady submarket if current rents sit below the market. Rent lag is the gap between in-place rents and current market rents. It usually comes from older leases, small increases, and concessions that never fully rolled off. The result is simple: lower day-one NOI and weaker leverage before the business plan even gets moving.
Here’s the math. If 500 occupied units are rented at $15 below market, the property gives up $90,000 per year in revenue. At a 6.0% cap rate, that’s about $1.5 million in lost value. That’s why high occupancy, by itself, doesn’t tell the full story.
A property can look full on paper and still under-earn if the rent roll trails the market. And lenders don’t underwrite to hoped-for upside. They underwrite to current, demonstrable NOI, not pro forma gains. When rent lag shows up, buyers may need to bring more equity to the table or live with lower leverage.
The risk after closing is churn. Many business plans assume 8% to 12% rent bumps at renewal. But tenants who’ve paid the same rate for years don’t always take that well. Some will push back. Some will move out. If churn comes in above the model, short-term NOI can drop below the seller’s trailing numbers before it climbs back. That early dip can put pressure on distributions and lender covenants.
During diligence, go straight to the rent roll and the management system data. Pull:
- tenant start dates
- current rates
- scheduled increases
- discounts
- rate-change history
Then compare that data with 5 to 10 nearby facilities. If rents have barely moved for several years, the lag is probably deeper than the seller’s summary makes it seem. And fixing it may take more time than the underwriting assumes. If the market itself is moving lower, then the issue is no longer rent lag. It becomes rate compression.
5. Rate Compression
Rent lag is one part of the story. The next piece is simpler and, frankly, just as painful at sale: what will the market pay when you exit?
In self-storage underwriting, rate compression is about exit cap rates moving the wrong way. And that matters because property value is basically NOI ÷ cap rate. So even a small move in the exit cap can change sale value in a big way.
Here’s the part that catches people off guard: a 50-basis-point move from a 6.0% cap rate to a 6.5% cap rate cuts value by about 7.7%, even if NOI doesn’t change at all.
That’s not some edge case. Self-storage cap rates tightened from 2020 to 2022, then moved back out in 2024. So if your model assumes today’s exit cap will still be there when you sell, you can end up overstating value. That can also shrink refinance proceeds and sale proceeds.
The fix is pretty straightforward: stress-test the exit cap the same way you test rent growth and occupancy. Look at your exit cap assumption next to recent trades and market survey data. Then run downside cases with a higher exit cap and see how much equity is left after the dust settles.
6. Deferred Repairs and Capital Needs
Once you’ve priced risk, physical condition is the next place storage deals can fall apart.
Deferred repairs are maintenance items the owner pushed off. Capital needs are bigger replacements that come due after closing. In self-storage, both can lead to unplanned cash outlays and drag down day-one performance. A property may look fine in the pro forma or sensitivity analysis, but if maintenance has been cut for years, the building often tells a different story.
The trouble spots are usually easy to recognize: roofs, asphalt, drainage, fencing, lighting, access control, cameras, unit doors, HVAC, fire suppression, and exterior finishes. Before you price the deal, split routine repairs from capital items. That line matters.
Deferred maintenance tends to hurt in three ways:
- It pushes operating expense higher
- It can slow leasing if the site looks neglected
- It creates near-term capex that has to compete with debt service
And here’s where it gets painful: if the seller has delayed work for several years, several issues can hit at the same time. That can mean a larger repair bill right after closing, plus a short-term dip in cash flow. So the onsite walk isn’t just a box to check. It’s a cash-flow test.
Start with the onsite walk. Then review maintenance logs, capex history, and insurance-loss reports from the last three years. Use what you find in the walk and in the records to turn unknown repairs into priced items before closing. After that, confirm the findings with a property condition assessment or contractor bid, with close attention to roofs, asphalt, drainage, fencing, unit doors, lighting, security, and life-safety systems.
If the deficiencies are material, put them straight into underwriting and negotiation. A 2% to 5% reserve on gross revenue is a common backstop, scaled to the property’s condition. You can also cover the gap with a price cut, seller credit, escrow holdback, or seller-funded repairs.
7. Property Tax Reset
Property tax reassessment is one of the biggest post-close expense risks in storage deals. When a sale triggers reassessment, the taxable value often resets close to the purchase price. If the seller owned the property for a long time and carried a low assessed value, the tax jump can be painful.
Take a facility bought for $10,000,000 with a prior assessed value of $6,000,000. At a 1.2% effective tax rate, annual taxes move from about $72,000 to $120,000. That’s a $48,000 NOI reduction, and it hits debt service coverage directly. On a loan with $400,000 in annual debt service, DSCR can fall from 1.35x to about 1.23x. That kind of drop isn’t small, and it all comes down to how the local jurisdiction handles reassessment after a sale.
Rules differ by state, but the underwriting lesson stays the same: never paste the seller’s tax number into your model.
Instead, build taxes from the expected post-sale assessed value. In many cases, that means using the purchase price or a slightly lower percentage, such as 85%–90%. So if the seller’s trailing taxes were $90,000 and your rebuilt estimate comes out to $144,000, that $54,000 gap needs to be in your underwriting before you decide what to pay.
During diligence, verify:
- Current tax bill and assessment notice from county records
- Local reassessment statute
- Whether exemptions or abatements transfer to a new owner or expire at sale
On larger or more complex deals, a property tax consultant can help estimate the new tax burden based on the purchase price and local rules.
8. Expense Underestimation
Right after taxes, the next big underwriting trap is plain old operating expense.
This one hurts in a quiet way. NOI is revenue minus operating expenses, so every expense you miss makes NOI look better than it is. And that flows straight into value. At a 6.0% cap rate, a $60,000 expense shortfall can wipe out $1,000,000 of implied value.
The line items that get missed most often are payroll, management fees, repairs and maintenance, utilities, and marketing. Smaller sellers, especially owner-run operators, often show management and payroll below market. Once the deal closes, those costs usually snap back to normal levels. Third-party management fees often land in the 4% to 6% of revenue range.
Expense ratios also need to fit the property’s size and how it operates. A small facility and a large facility do not run the same way, so they should not carry the same expense ratio.
| Performance Level | Expense Ratio (% of EGI) |
|---|---|
| Best-in-class (REIT-managed) | 28–35% |
| Well-run facility | 35–45% |
| Average / mom-and-pop | 45–55% |
| Underperforming | 55%+ |
That gap gets pretty wide by size. A 70,000+ SF property may run at about 30% to 40% of EGI, while properties under 20,000 SF can run 50% to 65%. If you plug a big-property ratio into a small asset, you’ll overstate NOI.
The debt side gets hit fast too. A $60,000 expense miss can drop DSCR from 1.25x to 1.125x on a deal with $600,000 of NOI and $480,000 of debt service. That’s not a small modeling error. It can lead to distribution limits or make the next refinance a lot harder.
During diligence, pull 24–36 months of detailed P&Ls, utility bills, payroll records, vendor contracts, and management agreements. Then cross-check those numbers against bank statements, not just seller-prepared summaries. If a category looks oddly flat, dig into the invoices, bank activity, and contracts. If the paperwork doesn’t back up the model, you’re no longer dealing with just an expense miss. You’re dealing with weak due diligence. For a complete overview of the acquisition process, see our self storage guide to buying and operations.
9. Weak Due Diligence
Weak due diligence is the risk that lets every other problem sneak through. Most underwriting mistakes can be found before closing, but that only happens if you pull the records and verify them. Self-storage is an operating business, not just a piece of real estate. When diligence is weak, hidden operating issues turn into overpriced deals. In one review of 75 failed transactions, 46.6% of broken LOIs fell apart because of diligence findings – either operational and legal problems (25.3%) or earnings gaps where actual NOI came in below the original assumption (21.3%).
In storage, the gap between reported performance and actual performance usually shows up in the details: unit-level occupancy, rate history, concessions, delinquency, and nonrecurring income. Say a buyer underwrites $750,000 of stabilized NOI using incomplete records, then finds after closing that true NOI is $675,000. At a 6.00% cap rate, that cuts implied value by about $1.25 million. That’s not a small miss. It means the deal was priced wrong from day one.
To catch that before closing, reconcile the records that tell the real story:
- 24–36 months of monthly P&Ls, bank statements, and tax returns, checked against system-generated rent rolls rather than manually typed spreadsheets.
- Move-in, move-out, and delinquency reports. Flag delinquency above 5% of units that are more than 60 days past due, because that points to collection trouble or occupancy numbers that may fall apart after closing.
- Income categorization so recurring storage rent is separated from one-time items like auction proceeds and other nonrecurring revenue.
- Expense verification backed by invoices and contracts, not seller-prepared summaries.
Paper NOI only matters if the records underneath it hold up. If they don’t, diligence hasn’t done its job.
A Simple Framework for Stress-Testing a Storage Deal
Once you’ve flagged the nine risks, the next step is simple: see if the deal still holds up when things go sideways. Seller packages almost always lean on the best-case story. Before you close, test the deal against flat rent growth and higher operating costs.
Reconcile Physical Occupancy and Economic Occupancy
Physical occupancy tells you how many units are filled. Economic occupancy tells you how much rent is actually being collected.
That difference matters more than a lot of buyers think. As noted earlier, a facility can show 95% physical occupancy while collecting rent equal to only about 80% to 82% of gross potential rent at market rates once concessions, delinquent accounts, and legacy tenants paying below street rates are included. To line those numbers up, pull trailing 12-month collections from the property management system and divide actual collected rent by gross potential rent at market rates.
Here’s what that can look like in practice: a 60,000 net rentable square feet (NRSF) facility with 57,000 NRSF occupied might show $68,400 in potential monthly rent at $1.20/NRSF, but only bring in $55,000. That works out to economic occupancy of about 80%. That shortfall should go straight into your underwriting.
If economic occupancy is well below physical occupancy, cut the stabilized value before you start layering in rent growth assumptions.
Compare In-Place Rents to Market Rates
This check tells you whether the rent lag is actual and whether you can turn it into more income.
Start by converting rents to $/NRSF so every unit is measured the same way. Then split the rent roll into two buckets:
- legacy tenants, meaning tenants in place for more than 12 months
- current asking rates
After that, pull comp data from the same submarket and compare both groups against that range. If legacy tenants are paying $0.80/NRSF while market rents are sitting at $1.10–$1.25/NRSF, there may be upside. But it won’t show up overnight, and it comes with churn risk. If your projected rents run past market comps, trim that upside.
If the market doesn’t back up the pro forma, cap the upside and shift to downside cases.
Review Move-In Discounts and Promotional Assumptions
Big promo activity can be a warning sign. Sometimes it means the market just doesn’t support the asking rents.
If 35% to 40% of move-ins during the last six months used a "first month free" or "$1 move-in" offer, headline occupancy is inflated. In that case, model revenue without those promotions. If occupancy falls in a meaningful way, that lower figure is the one you should underwrite.
Promotions belong in the “getting tenants in the door” bucket, not in stabilized revenue.
Run Conservative Debt-Service Scenarios
Now put the whole deal under pressure. Run base, moderate downside, and severe downside DSCR cases using lower occupancy, flat or weaker rents, and higher expenses.
Using a deal with $900,000 NOI and $650,000 in annual debt service, the numbers look like this:
| Scenario | DSCR |
|---|---|
| Base Case | roughly 1.38x |
| Moderate Downside | about 1.20x |
| Severe Downside | around 1.08x |
Lenders often look for a minimum DSCR of about 1.25x. So if your Severe Downside case drops below that line, the message is pretty clear: lower leverage, renegotiate price, or do both. Every risk identified earlier – occupancy quality, rent lag, oversupply, deferred capex, tax resets, and expense gaps – shows up here in debt coverage.
The real test of loan durability isn’t the base case. It’s the worst-case DSCR.
Use these four checks before moving to the risk snapshot table.
Risk Snapshot Table
Use this table during screening and investment committee review. It links each risk to the part of the model it can hit and the records you need to check before you close.
| Risk | What It Affects | What to Verify |
|---|---|---|
| 1. Weak In-Place Cash Flow | Year-1 NOI, DSCR, loan sizing | T-12/T-24 income statements, bank statements, rent roll, collections reports |
| 2. Soft Submarket Demand | Occupancy projections, lease-up assumptions | Population and household growth data, nearby facility occupancy and pricing, market studies |
| 3. Oversupply and New Competition | Effective rental rates, concessions, absorption pace | Permit records, pipeline reports, supply-per-capita study |
| 4. In-Place Rent Lag | Mark-to-market upside and rent growth | Unit-level rent roll vs. street rates, competitor rate surveys, revenue management history |
| 5. Rate Compression | Exit cap, refinance risk, buyer depth | Recent sales comps, cap rate trends, lender spreads |
| 6. Deferred Repairs and Capital Needs | Capital budget, yield-on-cost, operational continuity | Property condition report, roof/HVAC/door inspections, vendor bids, reserve studies |
| 7. Property Tax Reset | Pro forma tax expense, Year-1 DSCR | Assessed value, millage rates, reassessment timing |
| 8. Expense Underestimation | Operating margin, break-even occupancy, loan covenants | Expense ratio, utility bills, payroll, insurance quotes |
| 9. Weak Due Diligence | Unknown liabilities, re-trade risk, post-closing surprises | Lease files, Phase I, zoning, title, financial records vs. physical counts |
The document checklist below is where you pressure-test these assumptions before closing. On paper, a deal can look fine. Once you line up the rent roll, bank statements, inspections, tax records, and market data, the weak spots tend to show up fast.
Key Due Diligence Documents to Review Before Closing
Use these records to check NOI, occupancy, CapEx, taxes, and compliance before closing. The easiest way to handle the review is to sort it into four buckets. That helps you spot missing items fast and keeps the process from turning into a paper chase.
Income and Collections Records
This set of records tests how strong the in-place cash flow actually is. Start by requesting the rent roll and T-12 operating statement, then pull 12–24 months of bank statements. Line up the rent roll, T-12, and bank deposits for the same monthly period. If the numbers don’t tie out, reconcile the gap before you trust the income story.
You’ll also want delinquency and aging reports, lien-sale files, and write-off histories. These records show whether collection issues are under control or just being pushed down the road.
If collections don’t match the rent roll, stop there and fix the cash-flow model before you price the deal.
Occupancy and Pricing Records
This batch tests demand and rent lag. Request 24–36 months of monthly occupancy reports and compare physical occupancy with economic occupancy side by side. That simple comparison tells you a lot. A property can look full on paper while still leaking income through discounts, bad debt, or unpaid balances.
Next, pair those reports with the current rate matrix and compare it to in-place rents from the rent roll. If a meaningful share of tenants are paying below street rates, that can mean upside. It can also mean retention risk if the market won’t support the jump. Don’t underwrite full rent convergence unless the comps back it up.
If occupancy depends on heavy concessions or older units that haven’t been updated, move straight to the property-condition file.
Property Condition and Risk Records
These records test deferred repairs and future capital needs. Request CapEx schedules going back at least 3–5 years, with detail on roofs, pavement, doors, HVAC, drainage, and security systems. When that history is thin or missing, it often points to deferred maintenance.
Then add 3–5 years of insurance loss runs. Repeated claims for break-ins, water intrusion, or slip-and-falls can point to deeper property issues instead of one-off bad luck.
A Phase I Environmental Site Assessment is a must. If it brings up known environmental issues, budget for Phase II testing before you finalize your offer.
After you review the physical side, shift to the files that can change year-one NOI fast: taxes, leases, and zoning.
Legal, Tax, and Compliance Records
These records test property tax reset risk and legal compliance. Pull property tax bills and assessment history so you can model reassessment risk based on your purchase price. If you skip this step, year-one taxes can hit harder than expected.
Review lease files to confirm that lien-sale rights, liability waivers, and rent-increase language are current and consistent across tenants. Small lease differences can turn into big problems when you try to enforce terms.
Check service contracts for auto-renewal clauses, minimum terms, and termination penalties. Pay close attention to agreements for property management, security monitoring, and tech platforms. Those contracts can stick around longer than you want and eat into NOI.
Finally, get a zoning verification letter from the municipality that confirms the current use is expressly permitted. Don’t settle for verbal confirmation. Verify it in writing.
Key Takeaways
Most storage underwriting mistakes come down to three misses: revenue gets pushed too high, expenses and capex get modeled too low, and market or diligence risk gets brushed aside.
Revenue is usually where people get too comfortable. Underwrite to collected income, not street rates or physical occupancy. Street rates can look great on paper, but that number often falls apart once discounts, concessions, and delinquency show up. In many cases, effective rents land 10–15% below street rates. The same goes for lease-up and rent growth. If current submarket data doesn’t support those assumptions, cut them.
Once revenue is grounded in what the property is actually collecting, the next move is to load in taxes, operating costs, and capex before you size debt.
Expenses tend to get missed in the same three spots: insurance, property taxes after reassessment, and deferred capex. Model property taxes based on the post-sale reassessment, not the seller’s tax bill. And don’t gloss over repairs that were postponed. Capex is often understated, especially when the asset looks fine at a glance but has work stacked up beneath the surface.
Diligence misses are often the easiest to wave off when a deal looks cheap. That’s where people talk themselves into trouble. The main warning signs are:
- Soft demand
- New supply in the pipeline
- Inconsistent financial records
The screen is pretty simple: use current market data, plug in fully loaded expense assumptions, and test the deal with conservative occupancy. Then see if it still holds up. That approach leads straight into the Oakside view on how storage deals should be screened in today’s market.
Oakside Co Perspective
These are the exact risks Oakside underwrites before clients place a bid or get to the closing table. Oakside Co works with self-storage and boat/RV buyers and sellers, using data-driven underwriting, diligence, and disposition support.
Oakside’s advisory work centers on the same checks covered here: normalized cash flow, supply pipelines, and post-sale tax resets. In plain English, that means finding weak in-place cash flow, mapping nearby and planned competition, and modeling property tax resets based on post-sale assessed values, not the seller’s current tax bill.
As Cameron Vale, President at Oakside, puts it:
"In today’s storage market, the difference between a solid deal and a problem asset usually shows up in the underwriting. When we combine disciplined submarket analysis with realistic cash-flow stress tests, clients can see very quickly which risks are manageable and which ones are deal-breakers." – Cameron Vale, President at Oakside
That kind of discipline matters even more when cap rates leave less room for mistakes. With cap rates now around 5.8%–6.2%, a bad assumption can hit harder than it did when rates were near 5.0%.
Learn more at oaksideco.com.
FAQs
How do I tell if occupancy is real income?
Compare physical occupancy with economic occupancy. Physical occupancy tells you how many units are rented. Economic occupancy shows the rent that actually comes in after concessions, discounts, bad debt, and delinquency.
When the gap is more than 10%, that often signals collection issues or aggressive discounting. Look at 12 to 24 months of occupancy and delinquency data, review the rent roll for high-demand units, and make sure collections policies are being enforced.
Which risk usually hurts NOI fastest?
Localized oversupply often hits NOI first. When a market gets a fast wave of new inventory, rents can soften, lease-up can drag, and cash flow can come under pressure in a hurry.
NOI can also take an early hit when revenue growth falls behind rising operating costs.
How should I stress-test a storage deal?
Stress-test a storage deal by looking past the headline numbers and modeling both a base case and a downside case. Start with normalized NOI. Strip out one-time items and use grounded assumptions for tax reassessments, management fees, and what’s happening in the local submarket.
Then run sensitivity checks on exit cap rates, rent growth, and lease-up timing. This is where deals often tell on themselves. On paper, a deal can look great. But once you pressure-test the inputs, the picture can change fast.
If the deal only works when everything goes right, that’s a big red flag.