If I want institutional debt for a self-storage deal, I need to prove four things fast: the property’s cash flow is stable, the market is not too crowded, the sponsor can handle the plan, and the loan still works at exit.
In plain terms, lenders usually size self-storage loans off DSCR and debt yield, check whether occupancy and collections are clean, study local supply and street rates, review sponsor liquidity and track record, and then stress-test refinance or sale risk. Common guideposts in the article include 1.30x–1.35x DSCR, 9%–10% debt yield, and about 85%–90% occupancy for a property many lenders may view as stabilized.
If I had to boil the article down, it says this:
- Property cash flow comes first. Lenders care more about collected income than headline occupancy.
- Economic occupancy matters. A site at 92% physical occupancy can still look weak if discounts, bad debt, or delinquencies drag collections down.
- Base rent gets the most credit. Fees, merchandise sales, and seasonal boat/RV income may get cut back in underwriting.
- Market supply can change terms fast. High RSF per capita, new projects, or flat competitor street rates can mean lower leverage.
- Sponsor quality affects pricing and recourse. Experience, net worth, and post-closing liquidity often shape loan structure.
- Exit is part of day-one underwriting. Lenders test whether the deal can refinance if NOI dips or cap rates move out.
A few numbers stand out:
- Self-storage expense ratios often fall around 30%–45% of revenue
- Stabilized NOI margins often land near 55%–70%
- Oversupplied markets may see leverage drop to 55%–60% LTV
- Refinance tests often look for about 60%–65% LTV at maturity
- Exit caps may be underwritten at 25 to 100 basis points above entry caps
Here’s the short version: self-storage often gets solid lender interest, but proceeds depend on clean NOI, a sane supply story, a sponsor with money and experience, and an exit that still works under stress. That is the lens I’d use before I ever send a deal to a credit team.
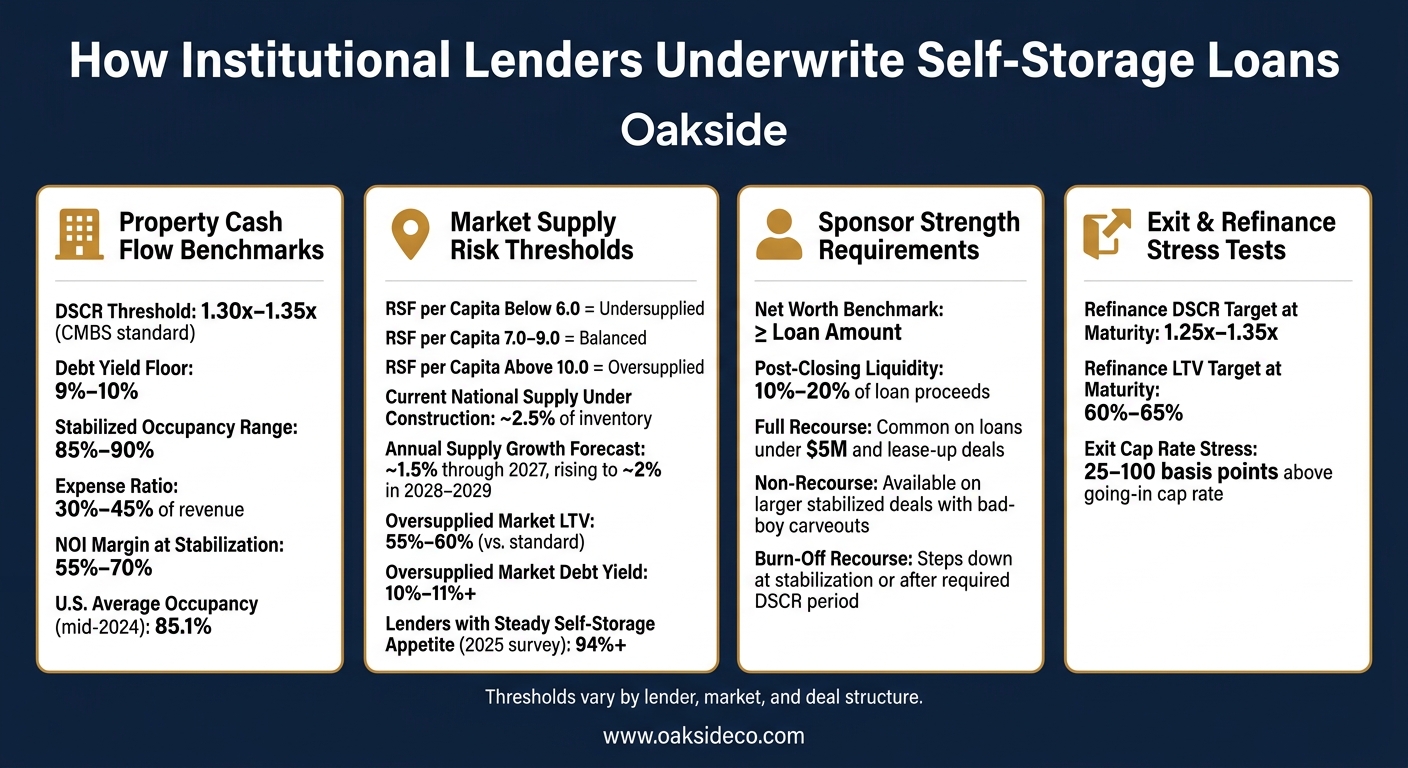
Self-Storage Institutional Lending: Key Underwriting Benchmarks
Property-Level Risk: Occupancy, NOI, and Revenue Quality
Before a lender sizes a loan, they want to know one thing: is the property’s cash flow steady, and can it keep showing up month after month?
That review usually starts with the trailing 12-month (T12) income statement, the current rent roll, and collections history. From there, lenders often compare reported income with bank statements and delinquency data to strip out one-off or nonrecurring items, like insurance proceeds, one-time fees, or short-term concessions. After that cleanup, they underwrite the loan against DSCR and debt yield.
Most lenders size to the lower of those two tests. In CMBS, common thresholds are 1.30x–1.35x DSCR and 9%–10% debt yield, and those floors can move higher in tertiary markets. They also reset expenses to market levels for payroll, repairs, management, insurance, marketing, and utilities. That’s a big deal. If an owner has delayed repairs or run the site with thin staffing, NOI can look better on paper than it does in practice. Industry data shows self-storage expense ratios often land around 30%–45% of revenue, which leaves NOI margins of about 55%–70% at stabilization.
What Occupancy Levels Lenders Consider Stabilized
Lenders don’t stop at occupancy in the simple sense. They look at both physical occupancy and economic occupancy.
Physical occupancy tells you how many units are leased. Economic occupancy shows how much of the possible rent is actually being collected after concessions, discounts, bad debt, and delinquencies. So a property that’s 92% physically occupied but only 84% economically occupied can look weaker than one at 88% physical occupancy with clean collections and limited discounting.
Many institutional lenders view roughly 85%–90% occupancy as the stabilization range for self-storage. That said, this is not a formal rule. It’s a lender overlay, and it shifts based on market strength, product type, and where the asset sits in lease-up. In a tight market with solid absorption, a lender may get comfortable below that range if the rent roll looks clean and demand trends support the story. In a softer or oversupplied submarket, that same lender may want a longer stretch of stable collections before calling the property fully stabilized. As of mid-2024, stabilized U.S. self-storage facilities averaged about 85.1% occupancy, down roughly 2.67 percentage points year over year.
How Lenders Treat Base Rent, Tenant Insurance, Fees, and Boat/RV Income
Some revenue gets full credit. Some gets trimmed. Some barely counts.
Lenders give the most weight to income that is recurring, documented, and tied directly to property operations. Income that feels seasonal, operator-driven, or hard to repeat under new ownership usually gets a haircut. At a stabilized facility, base rent often makes up 78%–88% of total revenue, while tenant insurance can add about $10 to $15 per unit per month when penetration stays steady.
| Revenue Type | Typical Lender Treatment | Underwriting Rationale |
|---|---|---|
| Base rent | Fully underwritten (core income) | Recurring, lease-supported, directly tied to occupancy |
| Tenant insurance commissions | Underwritten if history is stable; may be discounted | Dependent on vendor arrangement and penetration consistency |
| Ancillary fees (admin, move-in, late) | Conservatively underwritten or excluded | Fluctuates with occupancy, delinquency, and operator practices |
| Merchandise sales | Minimal credit | Management-dependent; not core to property performance |
| Boat/RV parking or enclosed storage | Underwritten conservatively | Valid income stream, but may be seasonal or locally concentrated |
Boat/RV parking and enclosed storage can still add to value. But if demand is seasonal or tied to a small tenant base, lenders usually underwrite that income with caution.
How Unit Mix Affects Underwritten Cash Flow
Unit mix matters because not all square footage earns the same way.
Lenders look at the mix of unit types and how each one performs on its own. Climate-controlled units often get a better reception in dense or higher-income submarkets because they can push higher rents and may hold pricing better. Non-climate units can still perform well, but they tend to face more pressure when new supply enters the market or pricing gets more competitive.
Open parking, covered parking, and enclosed boat/RV storage are usually reviewed on their own because demand can be more seasonal and more tied to discretionary spending. Lenders focus on rent per rentable square foot and ask a simple question: does each unit type still support cash flow under cautious renewal and loss-to-lease assumptions? Once that base case is set, the next step is the market’s supply and demand risk.
sbb-itb-09b4138
Market Risk: Supply, Demand, and Competitive Position
Once cash flow is set, lenders look at the market behind that income. A property can perform well today and still get tougher loan terms if it’s in a crowded submarket or one that’s starting to cool off. That often means lower leverage, tougher debt-yield targets, or flat rent-growth assumptions.
Trade-Area Data Lenders Expect to See
Institutional lenders usually begin with a 3- to 5-mile trade area. That range may tighten to 1 to 2 miles in dense urban cores or stretch to 5 to 10 miles in rural markets. In places where a simple radius doesn’t reflect how people move, lenders often prefer drive-time analysis instead of a straight-line map.
The standard market package usually includes:
- Population growth
- Income levels
- Housing mix
- Renter share
Markets with more renters and a heavier multifamily mix often show stronger storage demand. That can lead lenders to use tighter vacancy stress tests. As of 2023, the U.S. had about 43.8 million renter households, up from 43.1 million the year before.
For boat and RV storage, the lens gets narrower. Lenders want to see registered boat and RV counts, distance to lakes and marinas, HOA and city parking limits, and local tourism patterns. In recreation-heavy markets, they want direct proof that boat and RV demand is there.
How Lenders Measure Saturation and New Supply Risk
Lenders often measure saturation by RSF per capita in the trade area. As a rule of thumb, below 6.0 can point to undersupply, 7.0 to 9.0 tends to suggest balance, and above 10.0 can point to oversupply.
They don’t stop with what’s already built. Lenders also review the supply pipeline, including projects under construction, entitled, or recently opened. About 2.5% of existing national inventory is under construction, and annual supply growth is expected to ease to around 1.5% through 2027 before moving closer to 2% in 2028–2029 as construction costs and tighter lending hold back new starts.
When that pipeline looks heavy compared with local demand, lenders usually tighten the screws. They may cut leverage, ask for higher debt yields, and strip out optimistic rent-growth assumptions. Sometimes they’ll underwrite flat nominal rents for the first few years of the loan, even if current market trends still look good.
Supply matters for one main reason: it changes pricing power.
How Street Rates and Feasibility Shape Underwriting
Lenders use street-rate surveys of nearby competitors to put a ceiling on what they think a property can earn. If a property’s in-place rents are well above peer street rates, the lender may underwrite a small roll-down to bring those numbers back in line with the market. And if street rates are flat, it’s hard to make the case for aggressive rent growth.
Another metric that comes up a lot is RevPAF, or revenue per available square foot. It’s calculated as total annual rental revenue divided by total rentable square feet. If a property posts a higher RevPAF than its competitive set, that can point to stronger positioning. Even then, lenders still pressure-test the number by modeling mild rate compression in a downside case.
For development or expansion loans, lenders usually require an independent feasibility study. That study ties together trade-area demographics, RSF per capita, competitor rate surveys, lease-up projections, and DSCR stress tests. Advisory firms such as Oakside Co often pull this into lender-ready dashboards that show how each data point feeds into underwriting inputs.
In oversupplied submarkets, loan-to-value can fall to 55% to 60%, while debt yields can move up to 10% to 11%+. A 2025 lender survey found that more than 94% of lenders reported steady appetite for self-storage loans, but with tighter underwriting, especially around lease-up absorption and oversupply risk.
After market risk, lenders test sponsor strength and deal structure.
Sponsor and Structure Risk: Who Is Borrowing and How the Deal Is Financed
After property and market risk, lenders look hard at the sponsor and the loan structure. A deal can show solid cash flow and still get worse pricing if the borrower doesn’t have the right experience, enough liquidity, or solid reporting habits. At that point, the main question is simple: can this sponsor carry out the business plan?
What Makes a Strong Sponsor in Self-Storage and Boat/RV Deals
In self-storage and boat/RV deals, direct experience matters a lot. Lenders want to see a track record with the same asset type, plus proof that the sponsor has managed occupancy, NOI, and expenses through at least one lease-up or market cycle.
What they focus on depends on the deal. For stabilized assets, they want to see strong revenue management and ancillary-income systems. For construction, conversion, or heavy value-add deals, they want proof of delivery, cost control, and a solid contractor track record.
The management platform matters too, because operations shape cash flow day to day. Lenders review pricing tools, centralized leasing, and standard reporting to see whether the sponsor has real control over the asset.
From there, they size the loan based on the sponsor’s liquidity and guarantee strength.
How Net Worth, Liquidity, and Guarantees Affect Loan Terms
Balance sheet strength affects the whole loan structure. A common benchmark is net worth equal to at least the loan amount, along with post-closing liquidity equal to 10%–20% of loan proceeds.
That shows up in plain deal terms. If the balance sheet is weaker, lenders often respond with:
- Lower leverage
- Larger reserves
- More recourse
Full recourse is more common on smaller loans and lease-up deals, especially when the sponsor is newer to the asset class. Smaller loans, often under $5 million, usually come with stronger personal guarantees. Larger stabilized deals are more likely to qualify for non-recourse structures with standard bad-boy carveouts.
Strong sponsors may also be able to negotiate burn-off recourse that steps down at stabilization or after a required DSCR period. It gives the borrower credit for execution and ties the structure to performance.
Once the lender has a clear view of the borrower’s balance sheet, attention shifts to reporting quality.
Why Clean Reporting Improves Lender Risk Perception
Lenders treat reporting quality as a monitoring and control issue. A standard institutional package usually includes:
- A rent roll by unit type
- A T-12 operating statement
- Monthly occupancy and churn KPIs
- A 24-month capital log
When reporting is messy or late, monitoring risk goes up. Clean data helps move underwriting along and can support lighter covenants. Oakside Co helps sponsors standardize financials and KPIs to institutional formats, check underwriting assumptions against market benchmarks, and prepare lender-ready investment memos.
Those same reports also feed the lender’s refinance test at maturity.
Exit Risk: Refinance Assumptions, Stress Tests, and Key Takeaways
Lenders treat maturity as its own risk. The question is straightforward: if NOI slips or cap rates move out, can the property still refinance or sell without an equity hit or a forced sale? By that stage, lenders have already looked at the property, the market, and the sponsor. Exit risk is where they pressure-test all of it.
How Lenders Model Refinance and Sale Risk at Maturity
The refinance test is pretty simple on paper. Lenders project NOI at maturity, apply a stressed refinance rate, and check whether the asset still supports about 1.25x–1.35x DSCR and roughly 60%–65% LTV. If the deal doesn’t hold up under that test, terms usually get tighter.
For the sale test, lenders take forward NOI and apply a stressed exit cap rate that is often 25–100 basis points higher than the going-in rate. Then they check whether that value still covers the loan balance at payoff. They also look at reserves for taxes, insurance, and capital needs, since those line items affect the exit math too. That’s the same test credit committees care about at maturity, not only at closing.
It doesn’t take a dramatic shift to cause trouble. A small drop in occupancy, flat rent growth, and a higher exit cap can be enough to break the refinance story.
Key Takeaways for Owners Preparing for Institutional Debt
For owners, the message is simple: underwrite the exit with the same care as the entry. Institutional lenders tend to favor conservative exit assumptions because they cut maturity risk. If you walk in with conservative exit inputs, support for market rents, and a clear supply analysis, the deal usually moves through credit committee with less friction and better terms.
Oakside Co helps sponsors build lender-ready models that match the way credit committees stress-test deals, from NOI haircuts to exit cap sensitivity.
FAQs
What counts as economic occupancy?
Economic occupancy is the share of a property’s possible rental income that it actually brings in, not just the share of units that are filled.
That difference matters. A building can look full on paper and still fall short on income if tenants pay late, miss payments, or move in with steep concessions. Because of that, economic occupancy often sits 3%–8% lower than physical occupancy, and in some cases 5%–15 percentage points lower.
Lenders also look at economic occupancy alongside RevPAF to judge whether occupied units are bringing in cash flow that lines up with the market.
How do lenders judge oversupply risk?
Lenders don’t stop at broad market trends. They also dig into what’s happening around the property itself, usually within a 3- to 5-mile trade area.
One metric they watch closely is local net rentable square footage per capita. If that figure is above 10 square feet per person, it can point to a market with too much supply.
They also look at the development pipeline, including issued permits and planned projects that could add more space nearby. On top of that, lenders run downside scenarios with slower lease-ups and higher vacancy to see how the deal holds up if things go sideways.
In general, assets with stabilized occupancy between 82% and 92% tend to get a better reception.
What can make a refinance test fail?
A refinance test can fail when a property misses a lender’s required Debt Service Coverage Ratio (DSCR), which is often 1.20x to 1.35x. And because many lenders now model DSCR on a rolling basis to account for month-to-month revenue swings, a weak stretch in slower months can throw the whole deal off track.
Other common trouble spots include:
- High vacancy
- Declining net operating income
- Major value-drop stress tests
- Incomplete financials
- Deferred maintenance
- Environmental issues found during due diligence
It doesn’t take much for these issues to stack up. A property might look fine at a glance, then run into problems once the lender digs into cash flow, occupancy, condition, and risk.