A self-storage property can be 95% full and still have weak cash flow. That’s the main point. When I look at occupancy, I don’t stop at one number because occupied units and paid rent are not the same thing.
Here’s the short version: I would track seven metrics together to see demand, collections, pricing, churn, and unit-level weak spots. That means looking at physical occupancy, economic occupancy, move-in rate, move-out rate, delinquency-adjusted occupancy, revenue per available square foot, unit turnover rate, and occupancy mix by unit type. For example, a site can show 92% physical occupancy but only 81% economic occupancy, which points to discounts, bad debt, or rents that sit below market.
If I wanted a simple way to judge whether a facility looks ready for sale, I’d focus on this:
- Is economic occupancy close to physical occupancy?
- Are delinquent units low and moving down?
- Are move-ins keeping up with move-outs?
- Is RevPAS flat, down, or moving up?
- Are some unit sizes carrying the whole property?
Quick Comparison
| Metric | What I use it for | What a weak reading can mean |
|---|---|---|
| Physical Occupancy | Check how full the property is | Can hide discounts and unpaid rent |
| Economic Occupancy | Check how much rent is actually collected | Concessions, delinquency, old low rates |
| Move-In Rate | Measure current leasing demand | Soft demand or pricing pushback |
| Move-Out Rate | Measure tenant loss | Retention issues or rent pressure |
| Delinquency-Adjusted Occupancy | Remove non-paying occupied units from the picture | Collections trouble and income risk |
| RevPAS | Measure revenue from all rentable square feet | Weak pricing or too many promotions |
| Unit Turnover Rate | Measure how often units reset | High churn and more leasing cost |
| Occupancy Mix by Unit Type | Spot strong and weak unit categories | Product mismatch or bad rate setting |
Bottom line: I’d use these metrics as a group, not one at a time, because they show whether occupancy is turning into steady income or just making the property look better than it is on paper.
sbb-itb-09b4138
Why Physical Occupancy Alone Can Be Misleading
Physical occupancy is only the starting point. A facility can post 95% physical occupancy and still leave money on the table if those occupied units come with discounts, unpaid balances, or rents that sit below market.
Here’s the issue in plain English: occupied doesn’t always mean earning well. A 100-unit facility can drop from 95% physical occupancy to 83.25% economic occupancy once concessions, delinquency, and below-market rents are stripped out. Same property. Same number of occupied units. Very different cash flow. This discrepancy directly impacts your cap rate and overall property valuation. That gap is exactly what physical occupancy fails to show.
Unit mix makes this even trickier. If a property leans too heavily on unit sizes with too much supply, or if it has to use deep discounts to keep certain unit types full, it may still hit 95% occupancy while revenue per available square foot slips below market benchmarks. In that case, high physical occupancy isn’t a win. It’s a pricing problem wearing a good-looking mask.
That’s why owners look past unit counts and watch metrics tied to cash flow. They also track 12- to 24-month trends instead of leaning on a single snapshot. With month-to-month agreements, one month can reflect a seasonal bump or a short promo run rather than steady performance. The first metric in that group is economic occupancy.
1. Economic Occupancy
Economic occupancy shows how much of a facility’s possible rental income you actually collect. The formula is simple: collected rent ÷ gross potential rent at current street rates × 100. In plain English, it’s one of the clearest ways to check cash flow right after physical occupancy.
This metric is all about pricing discipline. It shows how closely collected rent lines up with asking rent. If a facility has $100,000 in gross potential rent but collects only $80,000, its economic occupancy is 80%. That gap can come from a few places:
- move-in specials
- free-rent concessions
- tenants locked into older, lower rates
- delinquent balances
When that gap gets bigger, the problem usually isn’t demand. For example, if physical occupancy stays at 92% but economic occupancy drops to 81%, that 11-point spread points to pricing or collections trouble, not weak leasing activity.
That matters in a sale. Buyers underwrite the income they expect to collect, not just the amount of leased space. A property with steady economic occupancy over time – and a smaller gap between billed rent and collected rent – reads much better than a site that looks full on paper but leans on heavy concessions or deals with chronic delinquency.
Track this monthly, and pay more attention to the trend than to any single data point. If physical occupancy stays flat while economic occupancy moves up, that usually means tighter concession rules, stronger collections, or more disciplined rate increases. And that can help support value. Pair this metric with move-in and move-out trends to see whether revenue quality is getting better or starting to stall.
2. Move-In Rate
Move-in rate tracks new leases over a set period, usually by week or month. The formula is simple: move-ins ÷ total units × 100. Unlike physical occupancy, this metric looks ahead. It gives you a read on demand that’s forming now, not just demand that already showed up.
That’s why it often tells you more about near-term leasing than a static occupancy figure. Occupancy is a snapshot. Move-in rate shows the flow behind that snapshot.
When a certain unit type leases fast with little marketing spend, owners can test small rent increases. If move-ins stay steady, pricing power is still there. If move-in velocity starts to slow, that’s an early sign of price resistance. At that point, concessions or rate changes may help get leasing flow back on track.
For sale timing, the trend line matters more than any one month. Buyers study leasing pace across 3-, 6-, and 12-month trends. A record of stable or improving move-in rates, along with lower concessions and tighter economic occupancy, gives buyers more confidence in future demand. Put simply: buyers pay for momentum they think will keep going.
It also helps to track move-in rate by unit type when you can. If climate-controlled units are leasing fast while non-climate units are lagging, that split can shape pricing decisions and strengthen the story you tell buyers.
3. Move-Out Rate
Move-out rate measures the share of tenants who leave during a set period. A simple formula is: move-outs ÷ average occupied units × 100. If 20 tenants leave out of 400 occupied units in a month, the move-out rate is 5%. Many operators see a monthly move-out rate of 5% or less as a good range.
This metric tells you how well you’re keeping tenants. Put another way, move-out rate is the retention side of the same leasing story. When you look at it next to move-in rate, you can see whether occupancy is growing in a healthy way or if you’re just filling space that keeps turning over. Tracking it each month – and on a trailing 12-month basis – makes it easier to tell the difference between normal seasonal churn and a deeper retention issue.
High move-outs chip away at cash flow quality. The damage doesn’t stop at lost rent. It also shows up in re-lease downtime, concessions, and marketing costs, even when physical occupancy still looks strong. That’s why a full building doesn’t always mean a stable one.
Pricing plays a big part here too. Large rent increases can push tenants out. One 74,000-lease analysis found that increases above 50% hurt retention, and increases above 100% cut retention by about 16 points. So churn isn’t always random. In many cases, it’s tied straight to pricing choices.
For valuation, buyers care about cash flow that holds up over time, not a facility that’s always scrambling to refill empty units. A property with steady retention across several quarters is easier to underwrite and tends to give buyers more confidence than one with high reported occupancy but uneven churn. That’s one reason owners often wait for move-out trends to settle before a sale, so the trailing numbers tell a cleaner story.
Track move-outs monthly and by unit type. That extra cut matters. If churn is jumping in large units while small units stay steady, that gap can point to a pricing issue or a product-fit problem that a blended occupancy figure would miss.
4. Delinquency-Adjusted Occupancy
Delinquency can make a packed facility look better than it is. Delinquency-adjusted occupancy shows physical occupancy after removing delinquent tenants, so it gives you a cleaner read on income quality. The math is simple: start with physical occupancy, subtract units tied to delinquent tenants or units not producing collectible income, then divide by total rentable units. A facility with 475 occupied units out of 500 total, including 25 units that are 60+ days past due, has a delinquency-adjusted occupancy of 90% – not the 95% physical occupancy would imply.
That difference matters. Physical occupancy counts any occupied unit, even when the tenant is behind and the unit isn’t producing collectible income. And those units usually can’t be re-rented right away while collections, lien, and auction steps play out.
Here’s where the metric gets more useful in practice: two 600-unit properties can both show 95% physical occupancy, but they may not be in the same shape at all. If one has 60 delinquent units concentrated in larger units averaging $140 per month, that’s about $8,400 per month of income at risk. A plain unit count won’t show that distortion.
For asset review, the trend tells you more than a single snapshot. Track 30+, 60+, and 90+ day delinquency together. Above 90% and moving in the right direction can point to sale readiness, while 85% to 90% usually means collections work is still on the table.
For buyers underwriting a deal, this metric is a direct read on income quality. A wide gap between physical occupancy and delinquency-adjusted occupancy tends to draw more scrutiny and may call for higher cap rates to offset collections risk. Closing aged accounts is one way to increase property value before a sale by strengthening NOI and cutting down on buyer pushback.
5. Revenue per Available Square Foot
Revenue per available square foot (RevPAS) shows something physical occupancy can’t: how well a property turns space into revenue.
The math is simple. Divide total rental revenue by total rentable square footage. So if a 60,000 SF facility brings in $75,000 in rental income in a given month, its RevPAS is $1.25 per square foot for that period.
Because RevPAS uses all rentable square footage, both vacancy and discounts drag it down. That’s where pricing discipline becomes visible. A property can look healthy on physical occupancy and still underperform on RevPAS. If RevPAS trails similar properties in the same market, that often points to extended promotions, under-market long-term tenants, or a unit mix tilted toward lower-rent unit types. In plain terms, the building may look full, but the rent roll isn’t pulling its weight.
Used this way, RevPAS works as a whole-asset efficiency metric. It helps owners see whether revenue performance is strong in practice, not just on the surface.
Annual RevPAS benchmarks change by market and asset class. Urban facilities in higher-demand markets can reach $20–$30 per square foot annually, while tertiary markets usually fall in the $10–$14 per square foot range. Put side by side with same-market peers, a property’s RevPAS can quickly show whether performance is on track or falling behind.
Rising RevPAS with stable occupancy usually signals stronger pricing power and better income quality. Flat or declining RevPAS alongside high occupancy should prompt a closer look at concessions and below-market rents. That makes RevPAS a useful screen for telling the difference between occupancy driven by healthy demand and occupancy propped up by price cuts.
6. Unit Turnover Rate
If RevPAS tells you how well a property earns, turnover tells you how often that income stream resets.
Unit turnover rate measures how often occupied units are vacated and then leased again. The formula is simple: move-outs ÷ occupied units at the start of the month × 100. So if a 500-unit facility has 400 occupied units and 40 move-outs in one month, the monthly turnover rate is 10%.
A monthly churn rate of 5% or less is often viewed as healthy. Even then, annual turnover can still land between 65% and 96%, which means some churn is just part of the business.
High turnover isn’t always bad. In fact, it can help if those empty units are re-leased fast at current rental rates. But it starts to hurt when turnover climbs and economic occupancy slips or discounting gets deeper.
On the flip side, very low turnover can hint at missed pricing room. If long-term tenants are paying below-market rates, low move-out activity may mean there’s room to push rents.
It also helps to break turnover out by unit type. That’s often where the story gets clearer:
- Which unit sizes can handle higher pricing
- Which units have the best tenant stickiness
- Where move-outs are putting the most pressure on income
7. Occupancy Mix by Unit Type
Overall occupancy tells you how full a facility is. Occupancy mix by unit type tells you what’s actually pushing that number – and where demand is strongest or weakest.
This metric breaks occupancy down by unit category, including size like 5×5, 5×10, 10×10, 10×20, and 10×30; unit type such as boat/RV, lockers, and commercial units; and access or amenity type like climate-controlled, drive-up access, upper-floor, high-door, and standard and premium units. In plain English, it shows which spaces people want most, not just whether the property looks full on paper. That’s why unit mix is one of the clearest ways to see if occupancy is being carried by the right space.
An uneven mix usually points to a pricing or product problem. If some unit types stay full while others sit under-leased month after month, that often signals rate misalignment, a product-market mismatch, or weak visibility in online listings. Full unit types may support modest rate increases. Weak unit types often need pricing changes, better promotion, or a different leasing plan. The focus shifts from “How full are we?” to Which units are doing the heavy lifting?
From a design and demand angle, 10×10 units tend to draw the broadest demand across many U.S. markets. Mid-size units like 10×15 and 10×20 usually follow close behind. When one unit type keeps lagging, the answer may be a rate adjustment, a targeted promotion, or, in some cases, a reconfiguration of that space.
For sale timing, this mix gives buyers a sharper view of where upside still exists and where management has already done the work. A well-managed mix, with clear records showing how underperforming unit types were handled, signals active management and gives buyers measurable upside to underwrite. Units that are full but rented below market stand out as a direct revenue lever after acquisition. On the flip side, chronic weakness in specific unit types can prompt questions about pricing discipline and local demand. That’s why unit-type occupancy belongs in monthly and quarterly asset reviews.
How Owners Use These Metrics During Asset Review
Owners get the most out of these numbers when they review them together on a set schedule.
Monthly Review: Leasing, Collections, and Rent Trends
A monthly review should line up physical occupancy, economic occupancy, and delinquency-adjusted occupancy side by side. If physical occupancy stays at 92%, but economic occupancy falls to 84% and delinquency-adjusted occupancy drops to 78%, that gap usually points to a collections or concessions issue, not a leasing issue.
Then add move-in rate, move-out rate, and unit turnover rate. These fill in the picture. If move-ins are rising while move-outs stay flat or fall, demand is getting better and net absorption is moving in the right direction. But if turnover jumps from 3% to 8% while physical occupancy barely moves, the property may just be replacing tenants to keep the same occupancy level. That often leads to higher marketing spend and weaker effective rents, even when the top-line occupancy number looks healthy.
RevPAS pulls revenue efficiency into one monthly check. If occupancy is climbing but RevPAS is flat or down, the property is probably relying on discounts or filling more lower-priced unit types. On the other hand, if RevPAS is rising while delinquency-adjusted occupancy stays steady, rate management is doing its job.
That monthly read leads straight into the trailing 12-month view.
Quarterly Review: Trailing 12-Month Performance
The quarterly view helps owners separate actual trend from seasonal noise. Self-storage occupancy often falls 3–7% from summer peaks during January through March, then climbs back in the spring. A trailing 12-month view helps sort out those seasonal swings from actual changes in performance.
On a trailing 12-month basis, owners should compare same-store economic occupancy, RevPAS, and unit turnover rate year over year. If move-outs are rising and physical occupancy is only holding up because of heavier discounting, that’s not just seasonality. That’s a deeper shift. T-12 data helps show whether the business is dealing with a short-term dip or a real trend. When you’re judging sale readiness, the trend line matters more than any single month.
Connecting Occupancy Metrics to NOI
This is where the numbers stop being just operating stats and start affecting value. Economic occupancy shows how much of the space is producing rent at current rates. Delinquency-adjusted occupancy tightens that view to rent that’s actually collectible. Unit turnover rate shows how much leasing work it takes just to keep the current revenue base in place. High physical occupancy supported by concessions and heavy churn leads to less durable NOI, especially if those discounts get pulled back.
Stabilized assets usually target economic occupancy between 88–92%, with delinquency rates below 5% and the gap between physical and economic occupancy kept to about 3–5 percentage points. When those marks start to slip, the hit to NOI is direct and measurable. And buyers will spot it in due diligence whether it’s pointed out early or not.
That same occupancy quality is what buyers build into their offer.
Metric Summary Table: Definitions, Formulas, and What Each Signals
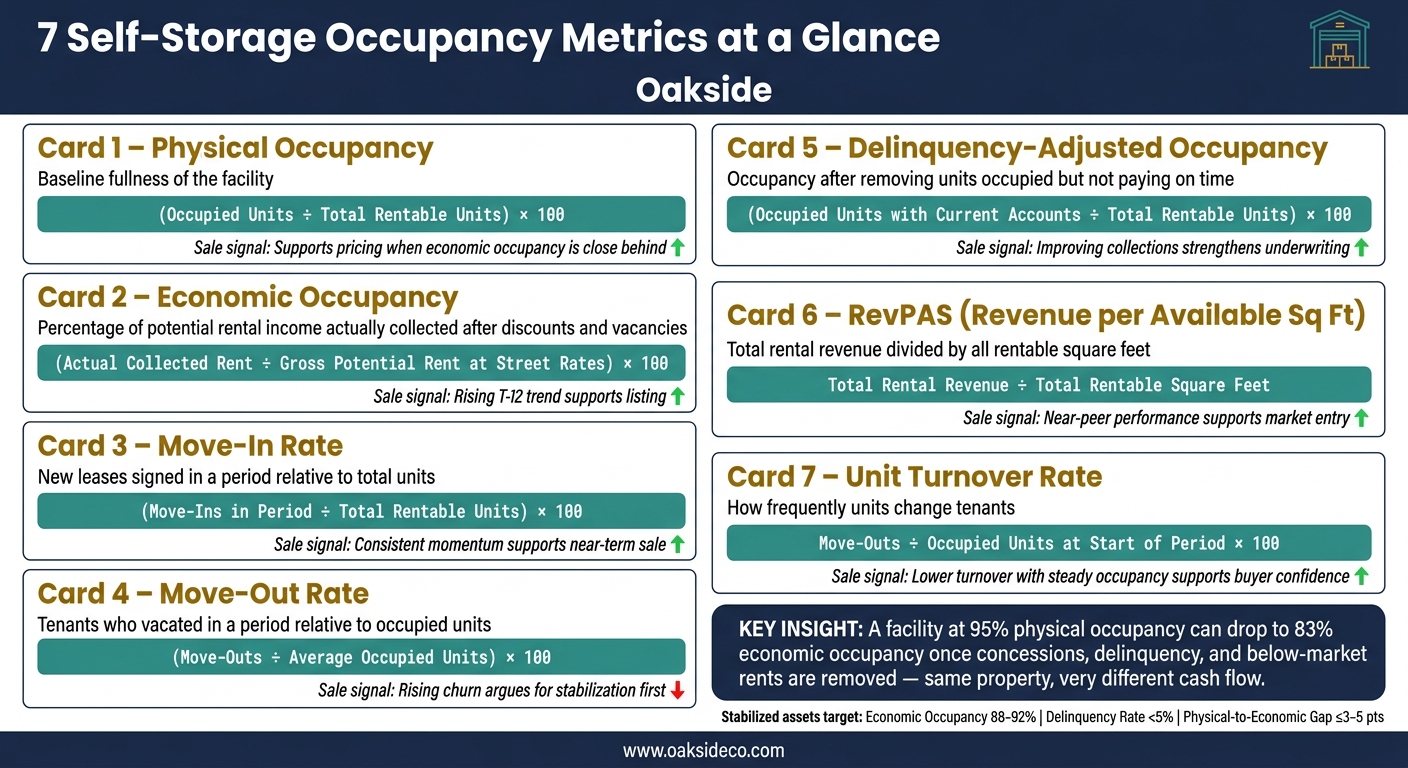
7 Self-Storage Occupancy Metrics: Definitions, Formulas & Signals
These metrics make the most sense when you look at them together. A full property can still underperform if collections are weak, discounts are heavy, or tenant turnover is high. Use this table as a quick reference during monthly reviews or when you’re getting ready to sell.
| Metric | Plain-English Definition | Formula | What It Reveals | Sale Timing Signal |
|---|---|---|---|---|
| Physical Occupancy | Baseline fullness; useful only when compared with revenue-quality metrics | (Occupied Units ÷ Total Rentable Units) × 100 | How full the building is, occupied whether the tenant is current or delinquent | Supports pricing when economic occupancy is close behind. |
| Economic Occupancy | Percentage of potential rental income actually collected, after discounts, concessions, and vacancies | (Actual Collected Rent ÷ Gross Potential Rent at Street Rates) × 100 | How efficiently space is being converted into revenue | Rising T-12 trend supports listing. |
| Move-In Rate | How many new leases were signed in a period relative to total units | (Move-Ins in Period ÷ Total Rentable Units) × 100 | Leasing momentum and marketing effectiveness | Consistent momentum supports near-term sale. |
| Move-Out Rate | How many tenants vacated in a period relative to total units | (Move-Outs ÷ Average Occupied Units) × 100 | Tenant retention and pricing risk | Rising churn argues for stabilization first. |
| Delinquency-Adjusted Occupancy | Occupancy after removing units that are occupied but not paying on time | (Occupied Units with Current Accounts ÷ Total Rentable Units) × 100 | Cash-flow reliability and collections health | Improving collections strengthens underwriting. |
| Revenue per Available Square Foot (RevPAS) | Total rental revenue divided by all rentable square feet | Total Rental Revenue ÷ Total Rentable Square Feet | Pricing power and revenue efficiency across all space | Near-peer performance supports market entry. |
| Unit Turnover Rate | How frequently units change tenants | Move-Outs ÷ Occupied Units at Start of Period × 100 | Tenant behavior, product-market fit, and leasing cost burden | Lower turnover with steady occupancy supports buyer confidence. |
| Occupancy Mix by Unit Type | Occupancy breakdown across unit sizes and categories, such as climate-controlled vs. drive-up | (Occupied Units of That Type ÷ Total Units of That Type) × 100 | Where demand is strongest and where pricing upside exists | Stable mix helps buyers underwrite upside. |
The gap between physical occupancy, economic occupancy, and delinquency-adjusted occupancy tells you how much of your income is actual cash flow versus space that only looks full on paper.
From there, the next step is to watch how those lines move over time, especially when owners line them up against sale timing.
Using Occupancy Trends to Time a Sale
The same occupancy trends owners watch each month and quarter also shape when it makes sense to sell. Buyers don’t base pricing on one good month. They usually underwrite the trailing 12 to 24 months.
That matters a lot.
A property that stays at 90% to 95% physical occupancy with steady collections and low delinquency over several quarters will be viewed very differently from one that hits 95% only after heavy discounting. If those trends hold steady quarter after quarter, buyers tend to underwrite the asset on better terms.
Trends Buyers Want to See
Buyers like to see economic occupancy stay close to physical occupancy over time. A small gap usually means most tenants are paying, and paying close to market rate, without many concessions. When monthly collections stay in the high 90s and chronic delinquency stays low, buyers see that as a sign that collections are steady rather than a short-term cleanup.
Leasing patterns matter too. Predictable seasonal swings are easier for buyers to get comfortable with because they can explain them. But when move-outs beat move-ins across several quarters, that points to softer demand.
A property that holds 92% to 95% occupancy while also increasing effective rents and RevPAS gives buyers a much cleaner upside story. In many cases, buyers underwrite stabilized deals at 88% to 92% occupancy. Once a property sits above that band, higher effective rents can help support a stronger price.
Trends That Can Pressure Value
The flip side is pretty straightforward. One of the clearest patterns that pushes pricing down is high physical occupancy with much lower economic occupancy. If a property shows 95% physical occupancy but only 80% to 85% economic occupancy, buyers will read that as a warning sign. On paper, the property looks full. In practice, that fullness may be held up by discounts, concessions, or tenants who are not paying.
Fixing that gap often means tougher collections or rent increases. And that can lead to lower occupancy.
Chronic delinquency makes things worse. If a meaningful share of occupied units stays 30, 60, or 90+ days past due, buyers will usually model higher bad debt and more admin costs in their underwriting. That cuts into the NOI they are willing to capitalize. And if RevPAS is sliding even while occupancy looks steady, buyers start asking harder questions about both pricing and day-to-day management.
In most cases, owners bring a property to market when occupancy, collections, and RevPAS are stable or moving up – not right after pricing resets or staffing disruptions. That’s usually the window they use to market the asset.
When Outside Advisory Support Makes Sense
When occupancy metrics stop lining up, outside help can make the picture a lot clearer. Most owners can track occupancy in-house. But turning those numbers into sale timing and pricing calls takes specialized judgment.
This matters most when the data points in different directions. A common case is pre-sale planning, especially when a sale is 6 to 24 months out and the owner needs to confirm valuation, NOI, and buyer underwriting. It also helps when physical occupancy looks strong, but economic occupancy, delinquency-adjusted occupancy, or RevPAS is lagging. That kind of gap can signal an asset that’s not pulling its weight.
For multi-asset owners, an advisor can also help sort out which properties to hold, refinance, or sell based on T-12 performance. Sometimes the numbers look fine at a glance, but a deeper review shows where the drag is coming from.
This kind of support can also help during refinancing, recapitalization, or turnaround work, when ownership needs deal-level analysis of occupancy data and deal risk. Oakside Co specializes in self-storage and boat & RV assets and provides data-driven strategy, transaction management, and investor network access. That support turns occupancy data into a disposition plan.
Conclusion
Physical occupancy is just the starting point. The seven metrics covered here give owners a much clearer view of cash flow quality, leasing stability, and property value. Put together, they show whether occupancy is creating steady cash flow or simply hiding trouble spots.
That matters in underwriting. Buyers price NOI, not headline occupancy. So when economic occupancy is strong, delinquency stays low, and RevPAS keeps moving up, pricing tends to look better too.
Track these metrics every month, and review trailing 12-month performance each quarter. When the numbers show steady strength across all seven measures, the property is in a better spot for a sale. For owners thinking about a disposition, Oakside Co can benchmark performance and help shape the sale plan.
FAQs
Why isn’t physical occupancy enough?
Physical occupancy only tells you how many units are leased. That sounds useful, but it can paint the wrong picture. A property can look full on paper and still lag when it comes to income because of concessions, free-month deals, or tenants who aren’t paying on time.
Economic occupancy gives you a much better read on the property’s financial health because it looks at revenue that was actually collected. As Nolen Masserman, Managing Director at Oakside, notes, buyers and lenders use it to evaluate true cash flow, collections, and risk.
What’s a healthy gap between physical and economic occupancy?
Typically 3% to 8%. Economic occupancy runs lower when concessions, free rent, or delinquent payments cut into collected revenue.
For underwriting and sale timing, a small spread usually means collections and discounting are under control. A larger gap, often over 10%, can point to collection problems or too many concessions. That can push buyers to price in weaker cap-rate and return expectations.
Which occupancy metrics matter most before a sale?
Before a sale, buyers pay more attention to economic occupancy than physical occupancy. Why? Because it shows the money that’s actually being collected after concessions, bad debt, and delinquency are factored in.
That matters a lot more than a unit simply being occupied on paper.
If the gap between physical occupancy and economic occupancy is more than 10%, buyers may see a problem. It can point to weak collections or discounting that props up occupancy but hurts income. And that can drag down valuation.
Buyers also dig into RevPAF, break-even occupancy, and 24 months of occupancy history. The goal is simple: verify performance trends over time instead of relying on one snapshot.