
I start a boat and RV feasibility study with one question: Can local demand support the site’s rents and costs? Before committing money, I check paid storage demand within a 10–20-minute drive, confirm usable capacity and zoning, and test cash flow against slower leasing and new competition.
Here’s what I check:
- Demand: How many owners need off-site storage - and will pay for it?
- Site fit: Which vehicle sizes and storage formats fit after allowing for aisles, turning space, drainage, and setbacks?
- Approvals and access: Can the project get its permits, and can large rigs reach it year-round?
- Seasonality: What does a 12-month forecast show about leased spaces, payments, and costs?
- Competition and rents: What do comparable spaces cost after discounts, and what new supply could arrive?
- Investment limits: Do occupancy, rent, debt coverage, and land cost meet preset targets?
My rule: <u>vehicle ownership is not paid storage demand</u>. I use dated local records and low, base, and high cases to reach a go/no-go decision - not just a stall count.
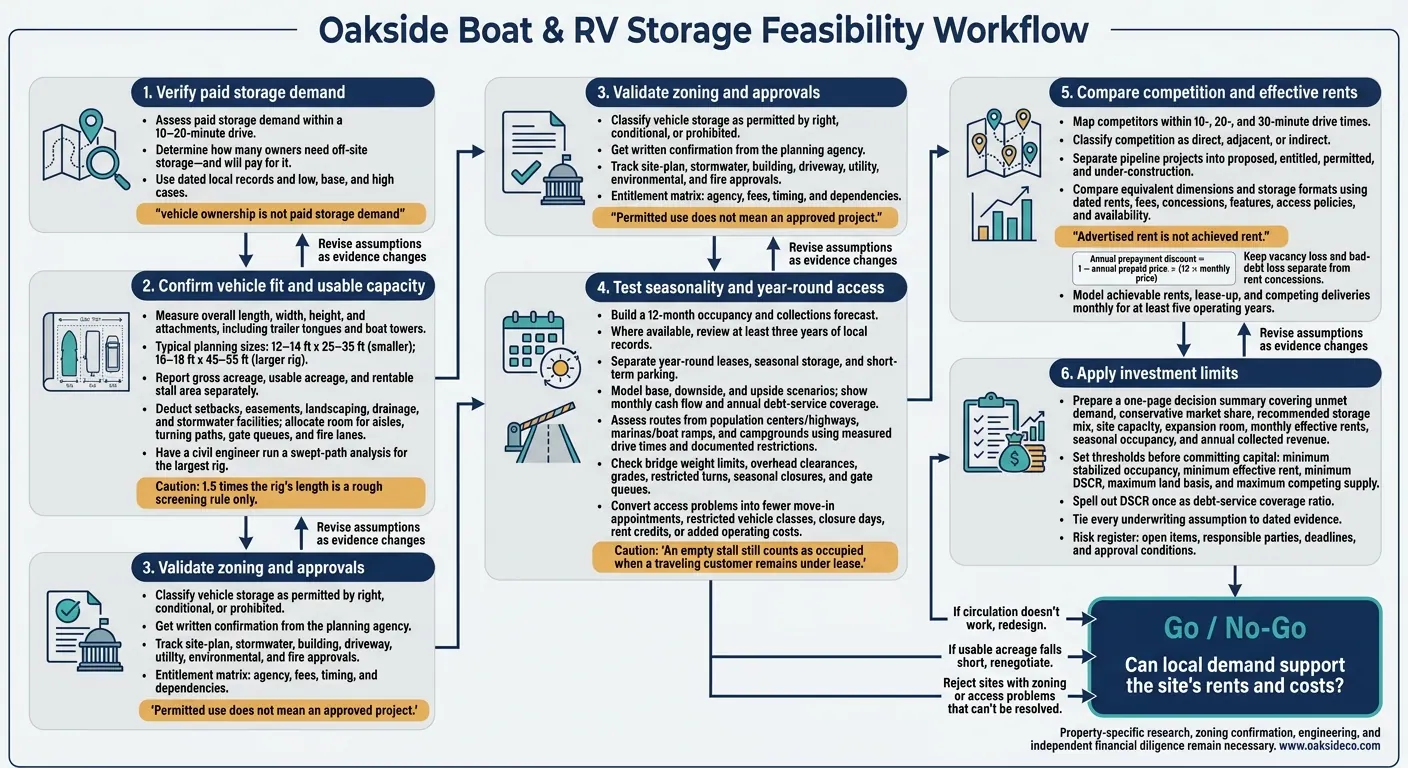
Boat & RV Feasibility Study: From Demand to Go/No-Go
Demand matters only if the site can fit the vehicles customers need to store.
Compare Space Sizes and Storage Formats
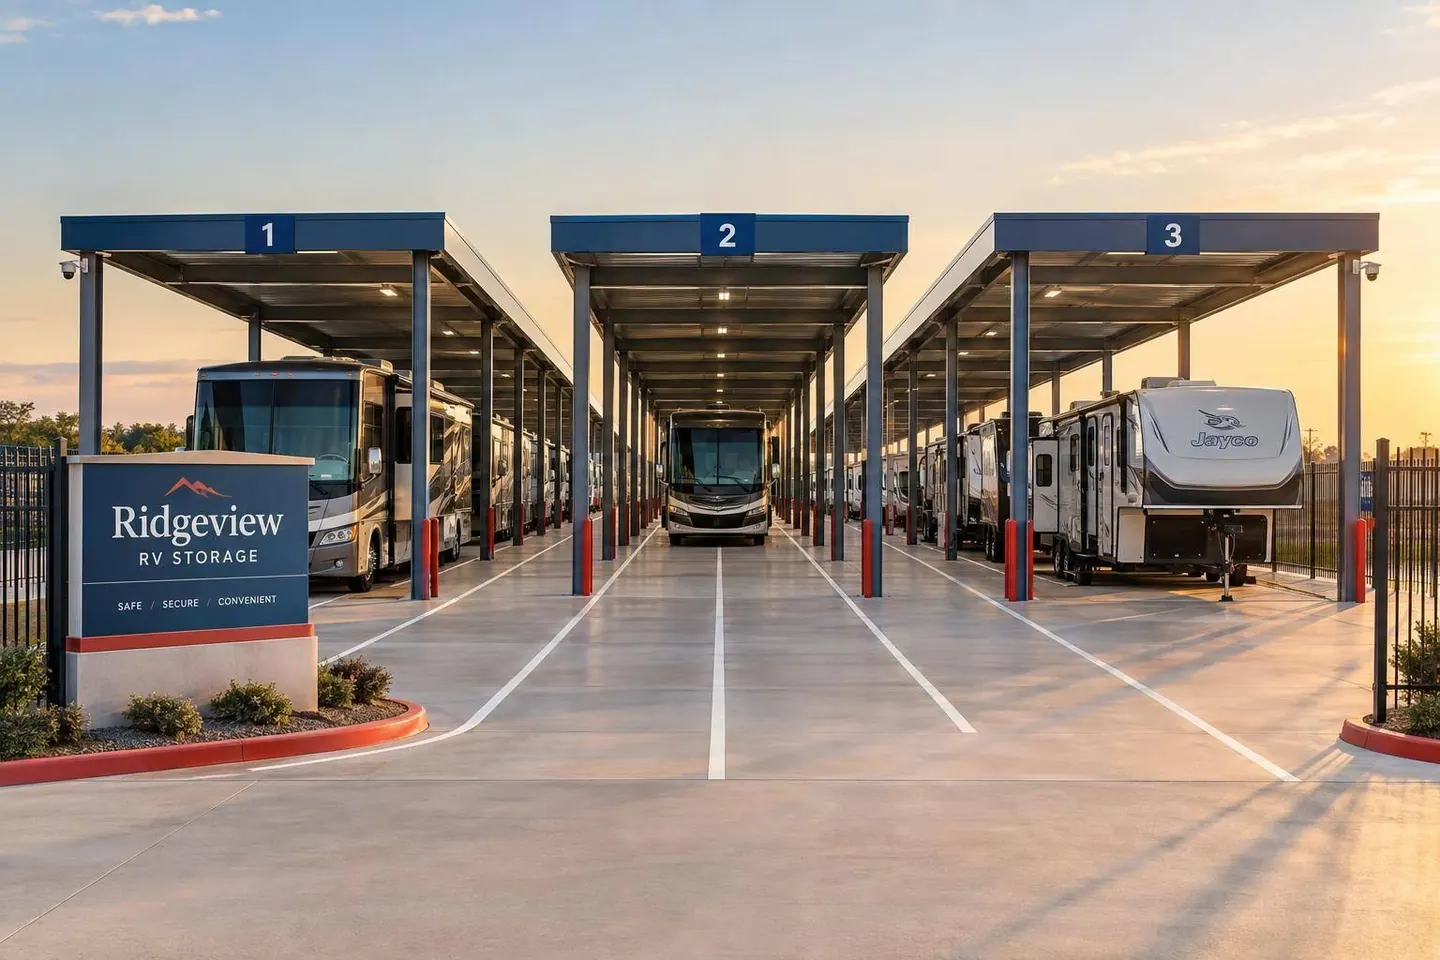
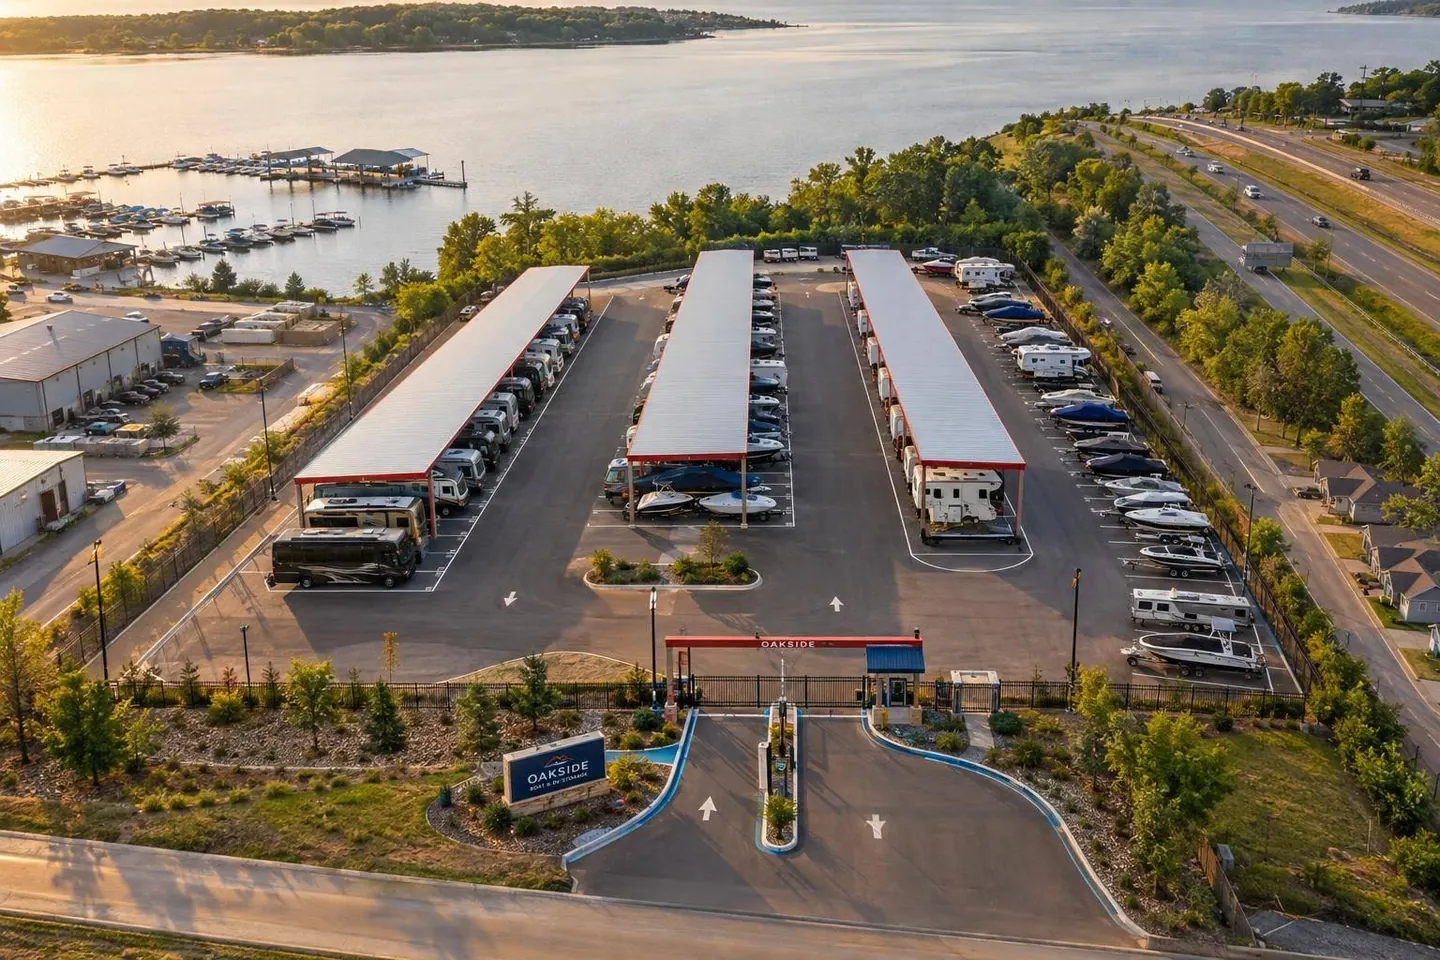
Use the vehicle mix from the demand study to choose storage formats and the number of stalls. Measure overall length, width, height, and attachments, including trailer tongues and boat towers. Typical planning sizes range from 12–14 feet wide by 25–35 feet deep for smaller boats and trailers to 16–18 feet wide by 45–55 feet deep for larger rigs. Size spaces for local vehicles rather than using one standard stall size. Check clearances at canopy columns and door openings, too.
These construction benchmarks are planning estimates, not bids. Confirm what each estimate covers and how square footage is measured before comparing formats.
| Factor | Open-air | Covered canopy | Enclosed drive-up |
|---|---|---|---|
| Construction benchmark | About $10–$15 per square foot. | About $20–$50 per square foot. | About $50–$65 per square foot; some estimates reach $60–$100 or more. |
| Land efficiency | Works for parking, but stall yield depends on circulation and stormwater needs. | Columns and setbacks limit layout options. | Building footprints and access areas can reduce the share of gross area available to rent. |
| Maintenance and security | Surface, drainage, fencing, gates, lighting, and cameras. | Open-lot needs plus roof and structural upkeep; a canopy does not replace security controls. | Doors, building envelope, utilities, and fire systems; physical separation. |
| Permits | Zoning, site-plan, stormwater, access, and fire review. | Adds structural and building-code review; classification varies locally. | More extensive building, fire, electrical, and utility approvals. |
Calculate Usable Acreage and Vehicle Turning Space
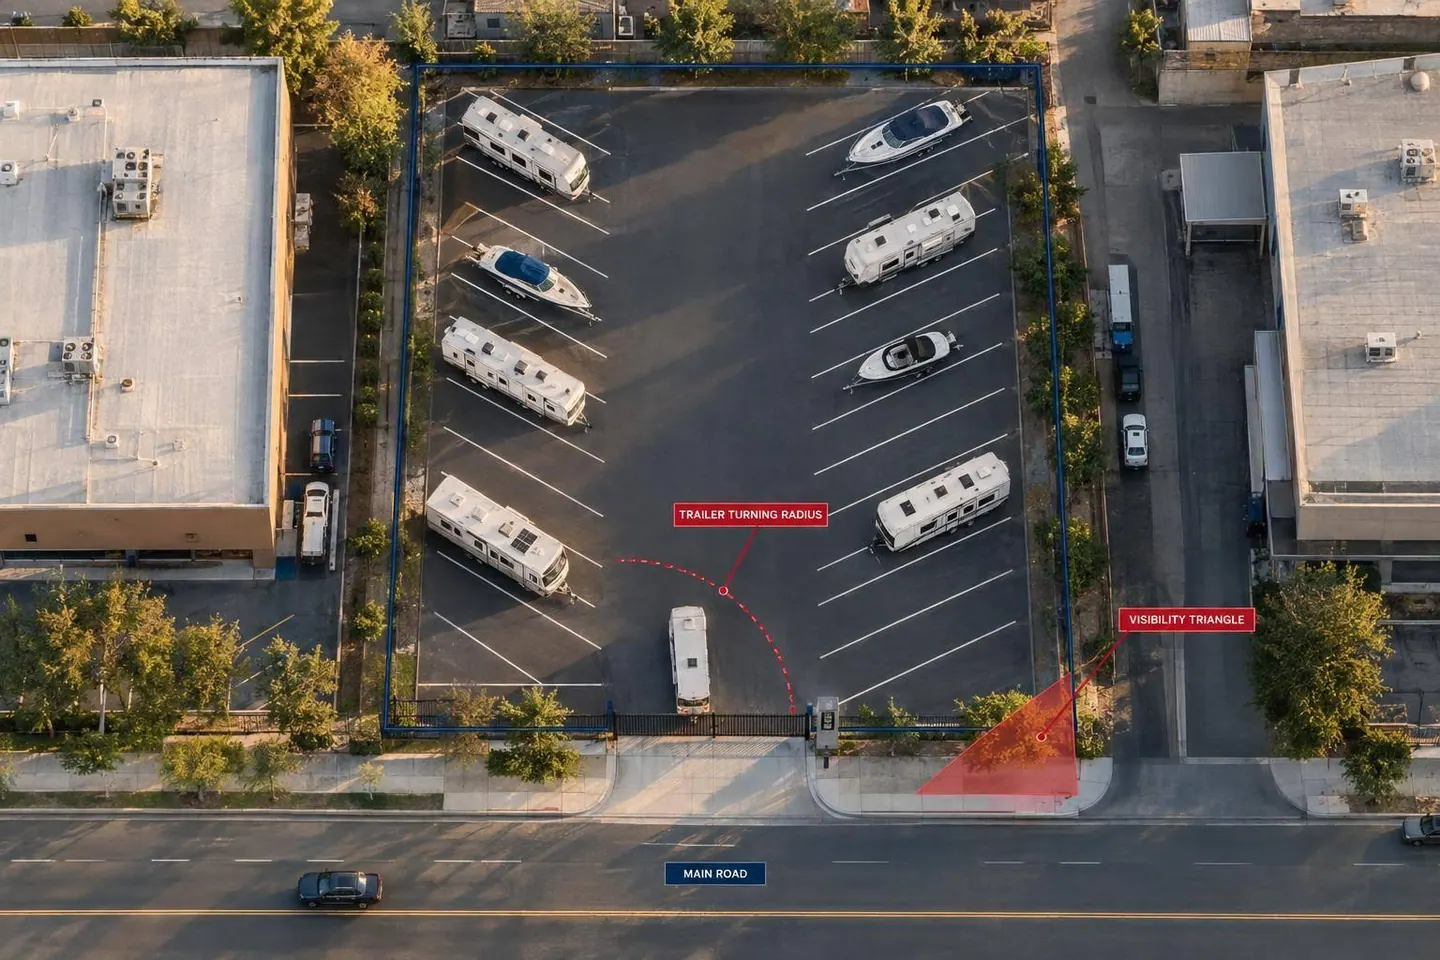
Report gross acreage, usable acreage, and rentable stall area separately. Deduct setbacks, easements, landscaping, drainage, and stormwater facilities. Then divide usable land among stalls, aisles, turning paths, gate queues, and fire lanes. Have a civil engineer run a swept-path analysis for the largest rig. Treat 1.5 times the rig’s length as a rough screening rule only.
Reserve space for washing, dumping, charging, service, or staging only when demand, utilities, and regulations support those uses. Wash areas need approved wastewater disposal. Dump stations may need sanitary connections and health approvals. Underwrite these features separately - don’t count their footprint as ordinary rentable storage.
Check Zoning and Permit Requirements
Even a site with enough room can fail if vehicle storage isn’t allowed. Confirm whether the use is permitted by right, conditional, or prohibited. Check minimum lot area, frontage, setbacks, coverage limits, canopy rules, screening, lighting, and fire access.
Map floodplains, wetlands, coastal overlays, and easements before counting affected land as usable. Also confirm whether repairs, fueling, washing, dumping, or overnight stays are allowed. Get written confirmation from the planning agency.
Permitted use does not mean an approved project. Track required site-plan, stormwater, building, driveway, utility, environmental, and fire approvals in an entitlement matrix. Include each agency, fees, timing, and dependencies. Get preliminary agency comments before locking in the stall count, and account for approval delays in the development schedule.
Once the site is legally and physically viable, test whether access and seasonality can support occupancy.
Once the site fits your needs, check whether demand will hold through both peak and off-season months.
Forecast Monthly Occupancy and Collections
Use the market study’s demand range to build a 12-month occupancy and collections forecast. Where available, review at least three years of local records. Compare monthly inquiries, reservations, move-ins, move-outs, cancellations, and winterization schedules with boating activity, campground calendars, and weather history.
Separate year-round leases, seasonal storage, and short-term parking. An empty stall still counts as occupied when a traveling customer remains under lease. For each month, model occupied spaces, average rent, ancillary fees, concessions, and collection losses separately. Track when payments arrive - not just when revenue is billed. Gate activity tells you about visits, not retention or collections.
Build three scenarios: a base case with normal local conditions; a downside case with slower lease-up, more move-outs, and weather-related closures; and an upside case with stronger retention and a longer recreation season. Include snow removal, repairs, insurance costs, gate downtime, and rent credits where applicable. Show monthly cash flow and annual debt-service coverage rather than relying only on average annual occupancy.
Next, check whether the largest vehicles can reach the property year-round.
Check Access Roads and Entrances
Map routes from population centers, highways, lakes, ramps, marinas, and campgrounds. Verify road width, pavement, bridge weight limits, grades, overhead clearances, and restricted turns with transportation and public-works agencies. Base each route assessment on measured drive times and documented restrictions, not map estimates.
| Route to compare | Drive-time check | Large-vehicle constraints | Seasonal risks | Operating limits |
|---|---|---|---|---|
| Population center or highway to property | Measure the legal towing route, including detours | Bridge ratings, clearances, grades, narrow lanes | Snow, ice, flooding, construction closures | Posted vehicle restrictions and nighttime limits |
| Marina or boat ramp to property | Check travel during launch and retrieval periods | Trailer turns, railroad crossings, pavement condition | High water and peak-season congestion | Arrival windows and gate queues |
| Campground to property | Check holiday and weekend travel times | Motorhome and fifth-wheel routing, intersection geometry | Storm closures and evacuation traffic | Campground traffic and emergency detours |
Confirm that the entire tow combination can leave the road before stopping at the gate. Check queue capacity, gate opening time, emergency overrides, lighting, and nighttime access rules without repeating the site-layout review. Test access in adverse weather, and document alternate routes and access limits.
Turn each access problem into an underwriting assumption: fewer move-in appointments, restricted vehicle classes, closure days, rent credits, or added operating costs. Don’t underwrite full market rent for spaces customers can’t reliably reach.
After checking demand, site conditions, zoning, and access, compare nearby competitors and projects in the pipeline.
Inventory Existing Facilities and Planned Projects
Map storage options within 10-, 20-, and 30-minute drive times. Include dedicated boat and RV properties, self-storage vehicle spaces, marina dry storage, campground storage, and legally operated commercial yards. Classify each as direct, adjacent, or indirect competition based on vehicle fit, storage format, and customer access.
For each facility, record its name, address, survey date, drive time, stall dimensions, format, asking rent, availability, and access hours. Also document security, pavement, lighting, utilities, pull-through access, and distance to launch points. Gather this information from facility websites, calls, online listings, planning records, field visits, and dated photographs. Empty stalls and operator claims do not prove occupancy.
Check planning applications, zoning approvals, and building permits for incoming supply. Separate proposed, entitled, permitted, and under-construction projects. Record stall counts, usable acreage, product mix, expected opening dates, and unresolved conditions. Confirm each project’s status with the public agency, and give nearly completed projects more weight than announced concepts.
Compare Rental Rates, Fees, and Features
Build a dated rate matrix around comparable dimensions and formats, rather than a single market average. For every surveyed space, record annual prepayment discounts, administrative fees, refundable deposits, recurring service charges, insurance requirements, access policies, and dated availability. Deposits are liabilities, not revenue.
Use matched comparisons wherever possible to measure premiums for protection, pavement, pull-through spaces, aisle width, security, power, and launch access.
| Storage format | Indicative monthly range | Dimensions to verify | Features to compare |
|---|---|---|---|
| Open-air | $75–$150 | Stall width × length in feet | Surface, lighting, security, turning space |
| Covered canopy | $125–$250 | Stall width × length and roof clearance | Roof protection, pavement, aisle width |
| Enclosed drive-up | $150–$400 | Interior width × depth and door clearance | Weather protection, privacy, power |
| Premium enclosed | $300–$500+ | Interior dimensions and door clearance | Climate control and included services |
Use these ranges as context only.
Estimate Effective Rents and New-Supply Risk
Convert asking rents into effective rents before testing lease-up. Advertised rent is not achieved rent. Subtract free months, introductory offers, and recurring discounts from contract rent, and track waived fees separately.
Calculate the annual prepayment discount as 1 − annual prepaid price ÷ (12 × monthly price). Keep vacancy loss and bad-debt loss separate from rent concessions. Verify whether quotes apply to new tenants, existing tenants, or renewals. Document seasonal pricing and renewal increases, too.
Use the competitor set and pipeline to test whether target rents hold when concessions and new supply put pressure on pricing. Model achievable rents, lease-up, and competing deliveries monthly for at least five operating years. Calculate annual rental revenue by adding each month’s occupied spaces multiplied by effective rent, then deduct collection losses separately.
In the downside case, bring pipeline projects with well-supported delivery forecasts online before stabilization. Test slower absorption, larger concessions, and delayed rent growth. Maintain a dated inventory map, rate matrix, pipeline schedule, and effective-rent model.
Summarize Demand, Site Needs, and Downside Limits
Create a one-page decision summary with estimated unmet demand, a conservative market share, and the recommended mix of uncovered, covered, enclosed, and premium spaces. Include site capacity, room for expansion, monthly effective rents by space type, seasonal occupancy, and annual collected revenue. End the summary with a clear go/no-go recommendation, then use it to decide whether the site belongs in your pipeline.
Set hard thresholds before committing capital: minimum stabilized occupancy, minimum effective rent, minimum DSCR, maximum land basis, and maximum competing supply. If circulation doesn’t work, redesign. If usable acreage falls short, renegotiate. Reject sites with zoning or access problems that can’t be resolved.
Use Market Findings in Underwriting and Transactions
With the summary in place, pressure-test the deal structure and closing assumptions. Tie every underwriting assumption to dated evidence.
For acquisitions, check the seller’s rent roll and reported collections against leases, bank deposits, and actual space counts. For repositioning, separate capacity gains from cosmetic improvements, then quantify the costs and expected returns of each. Give buyers and lenders a risk register that identifies open items, responsible parties, deadlines, and approval conditions.
Oakside Co can help turn feasibility findings into underwriting, transaction management, and disposition decisions. Advisory support does not replace property-specific research, zoning confirmation, engineering, or independent financial diligence - and does not guarantee feasibility.
How can I verify paid storage demand before opening?
Focus on hyper-local data, not national averages. Look at existing boat and RV ownership - not annual sales - and check nearby facilities’ occupancy, actual rents, and how fast they fill available spaces.
Review active building permits and planned developments within a 3-mile radius. Check zoning rules, HOA parking restrictions, and access to nearby lakes or RV routes. Track web inquiries, calls, and reservation requests to gauge current demand and whether the market can fill new spaces.
How do I choose the most profitable storage mix?
Track occupancy and revenue by unit type - open-air, canopy-covered, and fully enclosed - instead of relying on overall occupancy alone. Use RevPAF (Revenue Per Available Square Foot) to compare performance across unit types.
Consider gradual rate increases when occupancy consistently exceeds 90%. When it drops below 85%, consider short-term promotions.
Review 24 to 36 months of data to spot seasonal patterns. Use those findings, along with local demographics and recreational demand, to guide your mix of unit types.
What occupancy do I need to break even?
Break-even occupancy depends on your operating costs, debt service, and projected revenue. There’s no single percentage that works for every property. Lenders typically look for 82%–92% stabilized occupancy. For new projects, they often model 85%–90% occupancy to check whether the property can cover its debt payments.
Focus on economic occupancy - the rent actually collected - rather than physical occupancy alone. A property may have plenty of occupied units but still face late or unpaid rent, steep discounts, or problems with pricing and collections.