

I’d price RV-storage add-on income by what the owner keeps - not what tenants pay. Start with 24–36 months of monthly records, subtract service costs, and check whether the income can transfer to a buyer.
As of October 4, 2026, the supplied sources do not establish an audited national RV ancillary-revenue benchmark. The cited 8%–15% range comes from self-storage, so I wouldn’t use it as an RV valuation input.
Here’s what I check:
- Revenue mix: Fees, power, insurance commissions, wash services, propane, and retail - not base rent or refundable deposits.
- Property and service limits: Open-air, covered, enclosed, and full-service sites have different staffing, equipment, and utility needs.
- Owner-retained income: Separate third-party receipts from commissions, then deduct labor, inventory, utilities, and other direct costs.
- Records and transfer terms: Match billing, deposits, and ledger entries; check seasonality and contracts as part of your exit planning before counting income a buyer can maintain.
My rule: <u>verify the receipts, match the costs, and confirm what transfers</u>. Keep past results separate from hoped-for price or enrollment gains.
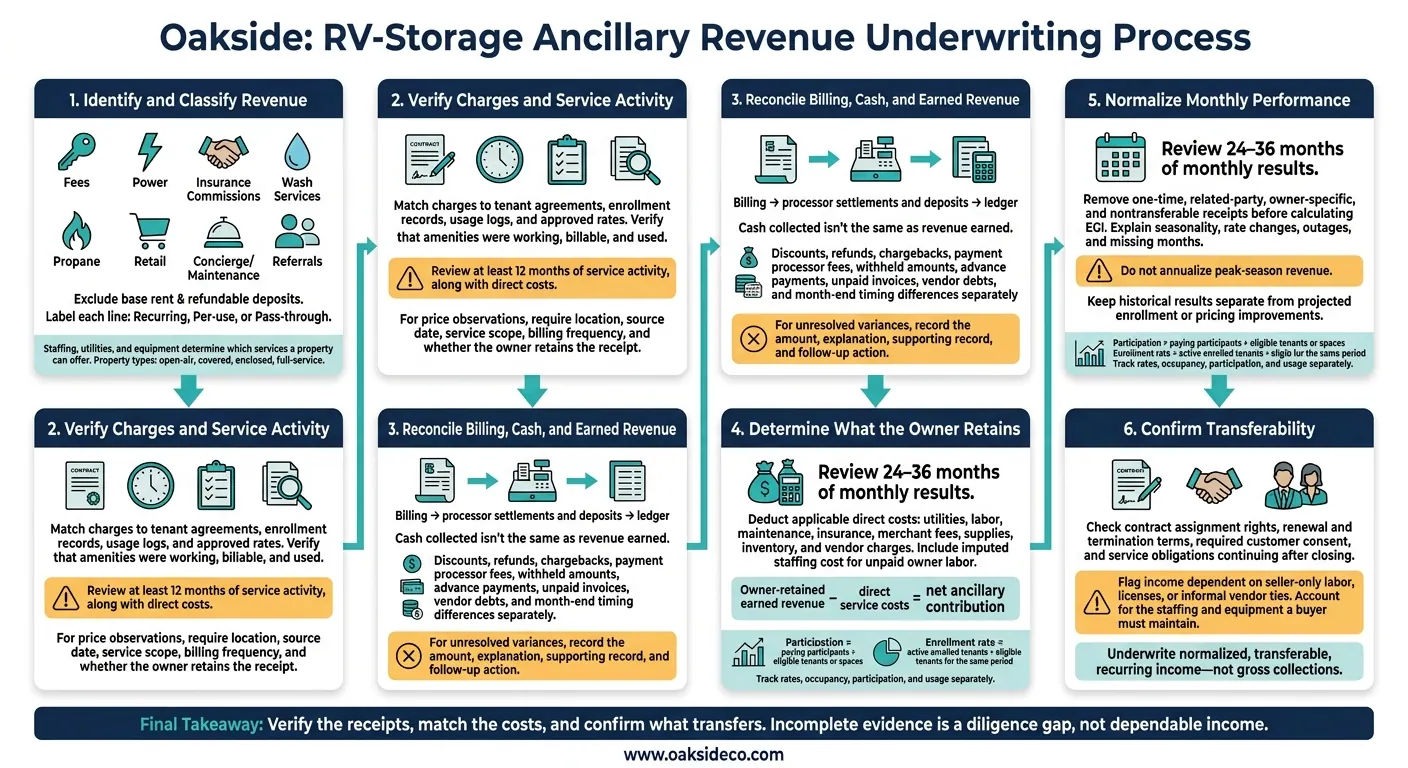
RV Storage Ancillary Revenue: From Receipts to Transferable Income
Open-Air, Covered, Enclosed, and Full-Service Storage
The supplied materials do not measure revenue shares by RV-storage subtype. The table below shows common ancillary revenue lines, not a fixed service mix for each subtype. Staffing, utilities, and equipment determine which services a property can offer. Property type affects whether that income is recurring, seasonal, or pass-through.
For underwriting, label each line as recurring, per-use, or pass-through before comparing subtypes.
| Property type | Common ancillary lines | Infrastructure and operating needs | Billing frequency | Verification documents |
|---|---|---|---|---|
| Open-air | Administrative fees, protection plans, power where equipped | Billing system, protection-plan agreement, electrical capacity and hookups | Move-in, monthly, or per use | Tenant agreements, enrollment reports, eligible-tenant counts, invoices, remittances, utility bills, commission or revenue-share agreements |
| Covered | Power, battery maintenance, access fees | Hookups, metering or allocation procedures, access controls | Monthly or per service | Hookup inventory, meter readings or allocation schedules, billing reports, service tickets |
| Enclosed | Power, battery checks, concierge where staffing allows | Electrical capacity, trained staff, scheduling, key controls, insurance | Monthly package or per service | Work orders, payroll or subcontractor invoices, customer receipts, service agreements |
| Full-service | Wash, dump-station access, propane, valet, pre-trip preparation | Water and wastewater systems, approved propane equipment, qualified handling, vehicle-movement controls | Per visit, sale, or package | Permits, maintenance logs, inventory records, sales reports, movement logs, scheduling logs |
An advertised amenity isn't enough to support underwriting. Verify that it was working, billable, and used in the past. For power, confirm 30-amp or 50-amp hookups and available capacity. For valet, check staffing, insurance, and vehicle-movement records. These details help separate steady recurring income from seasonal add-on revenue.
Fee Frequency, Service Costs, and Owner Receipts
After identifying the service line, separate owner revenue from pass-through receipts and money owed to third parties.
| Service line | Billing frequency | Costs and operating needs | Seasonality and underwriting treatment |
|---|---|---|---|
| Insurance or protection plans | Usually monthly | Program fees, claims or risk allocation, enrollment administration, and possible commissions | Often recurring; verify eligible tenants, enrollment, cancellations, and the owner-retained amount |
| Power and battery services | Monthly, daily, or per use | Electricity, repairs, metering, and equipment replacement | May increase before and after travel seasons; deduct utilities and maintenance |
| Wash and dump stations | Per visit or bundled | Water, wastewater, supplies, equipment, labor, and environmental maintenance | Often seasonal; use transaction history rather than annualizing peak months |
| Concierge and maintenance | Per service or monthly package | Labor, insurance, vehicle movement, supplies, and subcontractors | Demand may cluster around departures, returns, and peak travel periods |
| Administrative and late fees | Move-in or event-driven | Billing, collections, access-device costs, and bad debt | Don't treat late and lien fees as proof of strong customer demand |
| Retail and propane | Per sale | Inventory, shrinkage, merchant fees, and vendor costs | Seasonal and inventory-sensitive; separate gross sales from owner margin |
| Referrals | Per referral or commission event | Marketing, coordination, and possible revenue-sharing costs | Verify contractual rights and whether receipts belong to the owner or a third party |
Not every tenant charge counts as owner revenue. For third-party programs, count only commissions or retained program fees. Exclude premiums and vendor receipts that belong to third parties. Reconcile customer charges with vendor statements and deposits. Review at least 12 months of service activity, along with direct costs, before underwriting recurring income.
Source-Verified Charges and Enrollment Rates
The supplied materials don't identify a source name, exact date, or service scope for the quoted prices. Without those details, the prices don't support reliable comparisons across properties. Before using a price observation, require the location, source date, service scope, billing frequency, and whether the owner retains the receipt.
Define enrollment rate as active enrolled tenants divided by eligible tenants for the same period. If those counts or periods don't match, don't present the rate as a benchmark.
Apply these checks before matching charges to deposits and the ledger.
Once you’ve identified the revenue lines, check whether billing records, cash receipts, and ledger entries support them.
Accounting Errors That Skew Revenue
A single “other income” account can blur when payments arrived, what services cost, and how much margin the owner retained. Mixing rent with utility charges, missing enrollment records, unreconciled utility bills, and undocumented vendor agreements all weaken the audit trail. These are reporting risks - not findings about how often they occur in the market.
When a property acts as an agent, recording customer payments as revenue rather than retained commissions can overstate revenue. Confirm gross vs. net treatment under ASC 606 with the property’s accountant. Untracked refunds and payment processor fees can skew totals, too. Keep peak-season receipts, setup charges, and delinquency fees separate from steady monthly income.
Match Billing, Deposits, and Ledger Entries
Trace charges to enrollment records, usage or service logs, and approved rates. Match payments to processor settlements and deposits, then check ledger classification and gross vs. net treatment. Record discounts, refunds, chargebacks, payment processor fees, and withheld amounts separately. Investigate monthly changes that enrollment or service activity doesn’t explain.
Cash collected isn’t the same as revenue earned. Separate collections, refunds, and settlement timing from earned revenue. Track advance payments, unpaid invoices, and amounts owed to vendors separately. Document month-end timing differences rather than adjusting revenue to force a match. For every unresolved variance, record the amount, explanation, supporting record, and follow-up action.
Records Needed for Each Revenue Line
Keep a source file for each material revenue line. Trace each charge from billing through collection and related costs so you can verify the amount earned and the margin retained. Clean records also support defensible pricing and faster due diligence.
| Revenue line | Billing evidence | Collection evidence | Cost or contract support |
|---|---|---|---|
| Power and utility charges | Power schedules, effective dates, tenant bills, meter readings, allocation worksheets | Tenant payments, settlements, deposits, credits | Utility bills, usage records, reimbursement terms |
| Protection or service plans | Enrollment authorizations, active enrollment reports, start and cancellation dates | Payments, remittance statements, refund records | Plan agreements, provider terms, commission schedules |
| Wash, dump, and pump-out services | Dated usage logs, posted rates, discounts, access records | Receipts, point-of-sale settlements, deposits | Labor invoices, water and sewer bills, disposal and maintenance costs |
| Concierge and valet | Customer service logs, invoices, fee schedules | Customer payments, vendor settlements, deposits | Service contracts, vendor or referral agreements, commission schedules |
| Referrals | Referral logs, earned-fee calculations | Commission statements, remittances, deposits | Referral contracts, payment triggers, revenue-sharing terms |
| Administrative and delinquency fees | Approved fee policies, tenant terms, dated ledger charges | Receipts, deposits, waivers, reversals | Access-device costs, collection expenses, fee approvals |
| Retail sales | Pricing policies, units sold, sales receipts | Register totals, processor settlements, deposits | Vendor invoices, inventory counts, cost-of-goods records |
Once revenue and expenses are reconciled, turn the results into a pricing view a buyer can review and use.
Normalize Revenue and Service Expenses
Review 24–36 months of monthly results. Before calculating EGI, remove one-time, related-party, owner-specific, and nontransferable receipts. Deduct the direct costs of producing each revenue line: utilities, labor, maintenance, insurance, merchant fees, supplies, and third-party vendor charges. Include an imputed staffing cost for unpaid owner labor. Base pricing and disposition work on normalized, transferable, recurring income.
Use consistent metrics for pricing and underwriting. Participation = paying participants ÷ eligible tenants or spaces. Calculate revenue per occupied space using occupied spaces, and revenue per participant using participants. Measure utilization against available capacity over a fixed period. Track rate changes, occupancy, participation, and usage separately so a price increase doesn’t look like stronger demand.
Use these normalized figures to build the monthly schedule.
Build a Monthly Revenue Schedule
Create a monthly workbook with a separate row for each fee line. It should show the revenue a buyer can take over and operate. Include eligible tenants or spaces, paying participants, participation or utilization, average charges, billings, collections, refunds, chargebacks, taxes, third-party deductions, net deposits, and direct costs.
Link only agreements that affect assignment, transfer, or pricing. Explain rate changes, seasonality, outages, and missing months. Reconcile the schedule to the general ledger, bank deposits, and financial statements, and document timing differences. Keep historical results separate from projected enrollment or pricing improvements.
For each material revenue line, document contract assignment rights, renewal and termination terms, required customer consent, and service obligations that continue after closing. Flag receipts that depend on seller-only labor, licenses, or informal vendor ties.
Underwrite only the contribution a buyer can reasonably maintain, accounting for required staffing and equipment support. Don’t annualize peak-season revenue or capitalize gross collections without matching expenses.
Oakside Co’s Role in Sale Preparation
For disposition work, the schedule should also support diligence and document review.
Oakside Co supports revenue reconciliation, normalization, and disposition documentation for RV assets. Confirm scope and deliverables directly.
After reconciliation, value ancillary revenue based on what transfers with the asset. Across RV storage subtypes, value comes from verified, transferable income. The revenue mix depends on the subtype and what the owner can verify and retain. Separate recurring charges, usage-based services, one-time fees, and commissions by their costs, staying power, and owner-retained receipts.
Use an 8%–12% share of gross revenue only as a screening range - not as a valuation input. Compare benchmarks only when their denominators match.
Base pricing on reconciled records and net ancillary contribution, not gross receipts. A lower ancillary share can generate more net income than a higher share weighed down by expenses. Incomplete evidence is a diligence gap, not dependable income.
Which RV storage add-ons offer the best net margins?
Tenant insurance and automated charges, such as late fees, generate high-margin, recurring income with little overhead.
Power hookups, dump stations, and wash bays are the main physical amenities that bring in extra revenue. Together, they account for 8% to 12% of gross income. Monthly premiums range from $25 to $40 for power and $15 to $25 for dump station access. These amenities also help keep tenants.
How does ancillary income affect my property's sale value?
Ancillary income adds to your property’s net operating income (NOI), a main driver of its sale value. Buyers use a capitalization rate to translate NOI into value. At a 7% cap rate, an extra $15,960 in annual ancillary profit can increase your property’s value by about $228,000.
Clear records of that income also show institutional buyers that the property is professionally managed and runs efficiently. That can lower their perceived risk and help support your valuation during due diligence.
How do buyers treat add-on income with incomplete records?
Buyers see incomplete records for add-on income as a business risk - and that can mean lower valuations or price negotiations. Institutional buyers need verified, detailed financial histories to confirm net operating income.
When records are missing or income is lumped together without a breakdown, buyers have a harder time checking revenue. They may discount income projections or use more conservative assumptions.