

A full boat and RV storage property isn’t proof of a good investment. I start with at least 12 months of records to check whether occupied spaces produce collected rent, steady income, and enough cash to cover repairs.
Here are the 10 KPIs I review, and what each helps you check:
- Physical occupancy: How much rentable inventory has active contracts?
- Economic occupancy: How much potential rent is actually collected?
- In-place rent and revenue per space: Are tenants paying rates supported by the local market?
- Revenue per available square foot: How much rental income does the property produce across occupied and vacant space?
- Effective gross income: What recurring income remains after vacancy, discounts, and unpaid rent?
- Net operating income (NOI): What remains after recurring property expenses?
- Operating expense ratio: How much of that income goes toward running the property?
- Revenue growth and rent-roll trends: Are rents, collections, and tenant retention holding up?
- Going-in capitalization rate: How does NOI compare with the purchase price?
- Deferred maintenance, capital costs, and expansion capacity: What will repairs and added spaces cost - and can the expansion be built?
My rule: <u>keep actual results separate from projections</u>. Match reporting periods, reconcile the rent roll with financial records, and price needed repairs. These KPIs help you screen a deal, but local comparisons and due diligence determine whether the numbers support the price.
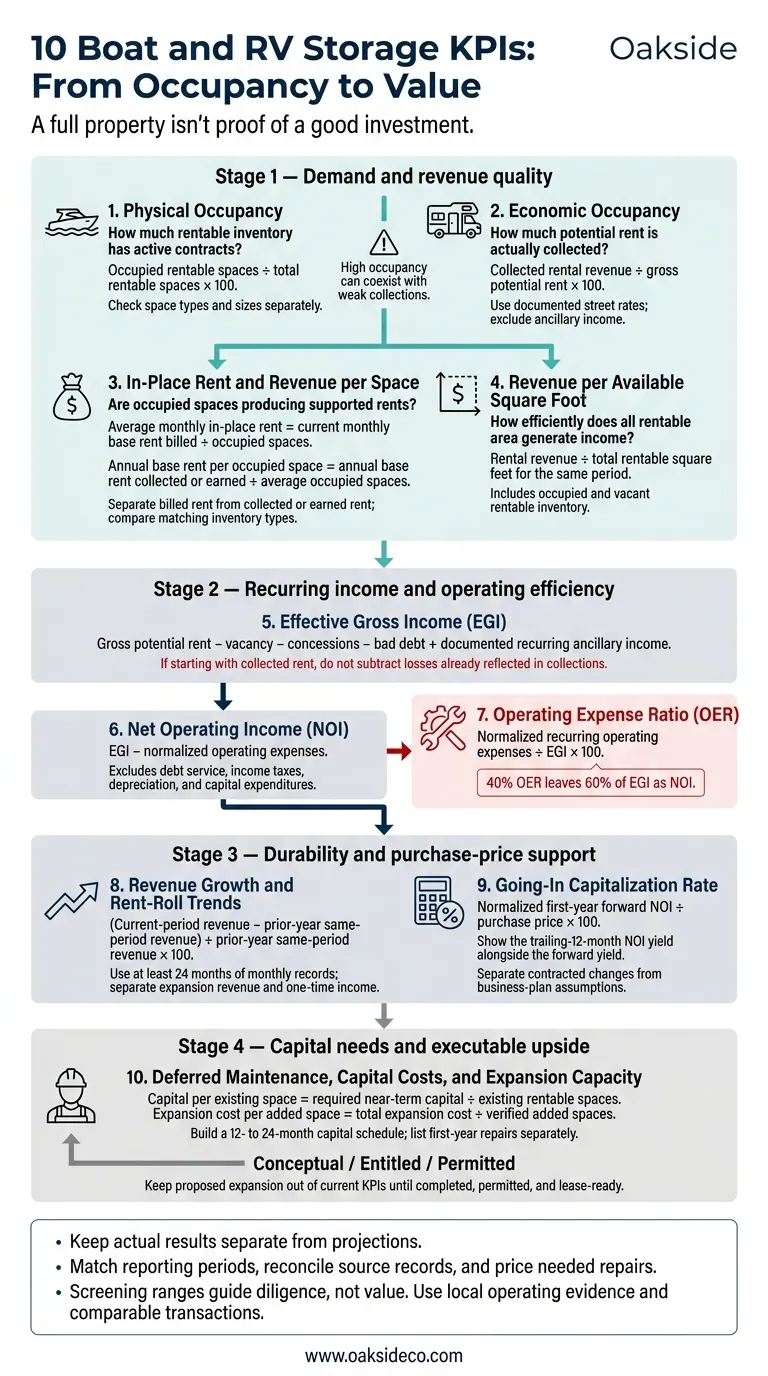
10 Boat and RV Storage KPIs: From Occupancy to Value
Use this table as a buyer’s checklist. Then use the notes below to interpret the numbers.
| KPI | Definition | Buyer Follow-Up Signal | Seller Documentation |
|---|---|---|---|
| 1. Physical Occupancy | Occupied rentable spaces or square feet divided by total rentable spaces or square feet. | Vacancy or occupancy below the local stabilized target; check each space type. | Rent roll, inventory schedule, monthly occupancy by type and size. |
| 2. Economic Occupancy | Collected rental revenue divided by gross potential rent at street rates; accounts for discounts, concessions, delinquency, and bad debt. | A gap from physical occupancy that needs explanation. A 3–8-percentage-point gap is a directional underwriting reference - not an acceptable-loss allowance. | Collections ledger, street-rate schedule, concessions, delinquency, and write-offs. |
| 3. In-Place Rent and Revenue per Space | Contract rent by type and size; collected rental revenue divided by occupied spaces for the same period. | Below-market contracts without a supported rent-increase plan; falling collections per occupied space. | Leases, rent roll, achieved rates, discount and rate-increase reports. |
| 4. Revenue per Available Square Foot | Rental revenue divided by total rentable square feet, including vacant rentable inventory. | Falling revenue per square foot despite stable occupancy; no fixed dollar threshold applies. | Revenue ledger, measured inventory, site plan, product-type breakdown. |
| 5. Effective Gross Income | Rental income after vacancy, concessions, and bad debt, plus applicable ancillary income. | Flat or falling recurring income; unexplained swings or large one-time fees. | Monthly income statements and rental-to-total-income reconciliation. |
| 6. Net Operating Income | EGI minus recurring operating expenses; excludes debt service, income taxes, depreciation, and capital expenditures. | Falling NOI, expenses growing faster than revenue, or missing recurring costs. | Monthly financials, invoices, tax and insurance bills, normalization schedule. |
| 7. Operating Expense Ratio | Recurring operating expenses divided by EGI. | 35%–45% is only a broad reference for stabilized self-storage. Review unusually high or low results. | Expense ledger, payroll, management costs, maintenance records. |
| 8. Revenue Growth and Rent-Roll Trends | Period-over-period revenue change, alongside rent, leased-space, move-in, and move-out trends. | Negative growth, a sudden spike before listing, or growth driven by nonrecurring income. | Historical rent rolls, monthly revenue, renewal and tenant-movement reports. |
| 9. Going-In Capitalization Rate | Trailing or normalized NOI divided by purchase price or implied value; specify the NOI period. | No fixed range applies; check yields that depend on projected rent increases or unverified savings. | NOI calculation, price assumption, adjustments, clearly labeled projections. |
| 10. Deferred Maintenance, Capital Costs, and Expansion Capacity | Near-term capital needs and feasible additional inventory, including costs and delivery timing. | Repairs without cost estimates, unresolved code issues, or expansion without zoning, drainage, access, and utility support. | Condition report, bids, capital history, survey, permits, civil concept plan. |
Insert property-specific results and trend data for each KPI.
Definitions are just the starting point. The reporting basis and normalization rules determine whether you can compare the numbers. They also help buyers separate high occupancy from lasting revenue, NOI, and capital needs.
- Report consistently. Date each KPI and compare results over the same reporting period. Screening ranges depend on the market, inventory mix, seasonality, construction format, and business model; they aren't fixed valuation standards. Review uncovered, covered, and enclosed spaces separately. Buyers need market-specific evidence, not a national occupancy cutoff. State whether revenue uses cash-basis or accrual-basis accounting, and stick to that basis. Document street rates for economic occupancy. For revenue per available square foot, use only rentable inventory and specify the reporting period.
- Normalize transparently. Put reported and normalized financials side by side. Explain adjustments for unpaid owner labor, missing management costs, or unusually low maintenance spending. Reconcile reported income to normalized EGI and NOI before asking a buyer to rely on the valuation.
Buyers need a fixed measurement frame before they compare occupancy, revenue, and NOI. Use three reporting views: monthly operating data covering occupancy, move-ins, move-outs, collections, concessions, delinquency, and offline spaces; trailing 12-month actuals to show seasonality; and a separate 12-month forecast.
Label the T12 October 1, 2025–September 30, 2026, the rent roll as of September 30, 2026, and the forecast October 1, 2026–September 30, 2027. If September’s books aren’t closed, mark the figures as preliminary. Keep forecast rent increases, lease-up, expenses, and capital work separate from actual results.
Build an inventory schedule for uncovered, covered/canopy, enclosed, and premium/climate-controlled storage. For each type, record dimensions, physical and rentable counts, occupied counts, occupied and rentable square feet, in-place rent, asking rent, revenue, collections, and amenities such as power or concierge service.
Define occupied spaces as active contracts, and explain how you count delinquent, complimentary, and reserved accounts. Report occupancy by both space count and square feet. Otherwise, smaller occupied spaces can hide large vacant stalls and overstate physical occupancy. Exclude drive aisles, offices, setbacks, retention areas, and other nonrentable land, then reconcile those exclusions to the site plan.
Report offline spaces separately. Include the reason each space is offline, its removal date, expected return date, and restoration cost. Show occupancy against both total rentable inventory and currently available inventory, with each denominator clearly labeled.
Keep proposed expansion out of current KPIs until it’s completed, permitted, and lease-ready. Put it in a separate forecast showing delivery timing, capital cost, lease-up, and added inventory.
Use U.S. dollars, dimensions in feet, rental areas in square feet, and parcel area in acres. Label rents as $/space/month or $/square foot/month. Preserve dated rent rolls, site plans, and monthly source files.
Calculation
Physical occupancy = occupied rentable spaces ÷ total rentable spaces × 100. Stick with one primary method. Report square feet only when differences in space size could skew occupancy based on space counts.
Why Buyers Review It
Physical occupancy gives buyers a first read on demand - not value. Vacancy offers upside only when there’s a sound plan to lease the empty spaces. Review collections, concessions, and delinquency separately.
Follow-Up Ranges and Warning Signs
A stabilized rate below 85%–90% calls for review. Below 80% is a stronger warning sign unless the property is newly opened or in active lease-up. The trend matters more than a single low month.
Check each inventory type separately. Strong occupancy in open-air spaces can hide weak demand for covered or enclosed spaces. Buyers will also want records that back up the trend.
Seller Records and Pre-Market Explanation
Document seasonal swings, monthly move-ins, move-outs, cancellations, and transfers. Include how long it took to fill added spaces, and reconcile the results with dated rent rolls.
For weak occupancy, identify the cause, count the affected spaces, and document corrective work and the results that followed. Don’t simply label vacancy as upside. Support strong occupancy with rent trends, retention, and wait-list records. Don’t underwrite peak-season occupancy as a year-round rate.
High physical occupancy matters only when it turns into collected revenue. If occupancy is strong but revenue lags, the next test is whether those occupied spaces are actually paying.
Physical occupancy tells you how many spaces are filled. Economic occupancy tells you how much of that demand becomes collected rent.
Calculation
Economic occupancy = collected rental revenue ÷ gross potential rent × 100. Use a disclosed market-rate benchmark, usually current street rates, and leave out ancillary income.
Why Buyers Review It
Buyers use this KPI to check revenue quality, debt support, and whether NOI can hold up over time.
Follow-Up Ranges and Warning Signs
Economic occupancy that falls more than roughly 5 percentage points below physical occupancy needs an explanation. Break down the gap by space mix, concessions, delinquency, write-offs, and legacy rents.
Seller Records and Pre-Market Explanation
Provide 12 months of reconciliations that tie tenant collections to rent rolls, bank deposits, and financial statements. Include A/R aging, delinquency reports, concessions, move-in and move-out reports, write-offs, and rate-change records.
If results are weak, quantify what's driving them and separate temporary issues from structural ones. If results are strong, back them up with T12 collections, low delinquency, limited concessions, and clean reconciliations to statements and deposits.
Once collections reconcile, the next test is how much revenue remains as NOI after expenses.
After checking collection quality, buyers look at pricing power for occupied spaces.
Calculation
Average monthly in-place rent = current monthly base rent billed ÷ occupied spaces.
Annual base rent per occupied space = annual base rent collected or earned ÷ average occupied spaces.
Report both metrics by inventory type. Exclude electricity, admin fees, and other ancillary income.
Why Buyers Review It
These metrics show pricing power across occupied inventory. In-place rent looks backward; street rent is the asking price. Break out results by inventory type so premium enclosed bays don't hide weak rents for uncovered spaces. Buyers want to know whether occupied spaces support value - not just occupancy. This scrutiny is a standard part of self-storage exit planning to ensure the facility is positioned for maximum value.
Follow-Up Ranges and Warning Signs
Use verified local pricing for spaces with matching dimensions and features. For an initial screen, uncovered outdoor spaces often rent for $75–$150 per month, covered spaces for $125–$250, and enclosed spaces for $150–$450 or more.
Flag large discounts, unexplained price gaps between similar spaces, and recent rent increases without evidence that tenants stayed. Record survey dates, availability, fees, and product differences. An advertised rate alone doesn't prove that higher rents are achievable.
Seller Records and Pre-Market Explanation
Provide unit-level dimensions, base rents, move-in dates, discounts, and rate histories. Include monthly revenue, occupancy, and rate history by inventory type. Pair rent increases with subsequent renewals, move-outs, and delinquency.
Explain weak pricing by showing which inventory types rent below market and whether discounts are contractual, promotional, legacy, or discretionary. If product limitations explain the gap, say so plainly. Support strong pricing with achieved rents and stable retention, and keep current performance separate from any rent-growth case.
Calculation
After reviewing rent and collection quality, buyers check how much revenue each rentable square foot produces.
RevPAF = rental revenue ÷ total rentable square feet for the same period. Include both occupied and vacant rentable areas. Exclude offices, drive aisles, nonrentable common areas, and unfinished or nonleasable space. Use a consistent reporting period, such as monthly or trailing 12-month data. State whether revenue includes only base storage rent or also ancillary income.
Why Buyers Review It
RevPAF shows how efficiently rentable area generates rental income. Unlike revenue per occupied space, it accounts for vacancy. Review uncovered, covered, and enclosed inventory separately, then compare RevPAF with revenue per occupied square foot. This helps flag vacancy, inventory mix, or denominator issues before comparing results with local market performance.
Follow-Up Ranges and Warning Signs
As an initial screen, RevPAF about 10% to 15% below comparable local facilities warrants a closer look when product mix and service levels are similar. Review several months of falling RevPAF despite steady occupancy, especially if discounts, collections, occupied-space mix, or rentable area changed. Unverified dimensions or an incorrect denominator can skew the results.
Seller Records and Pre-Market Explanation
Back up the number with matching space counts and clear area schedules. Match each space identifier and dimension across the site plan, rent roll, and inventory schedule. Reconcile occupied and vacant areas, document additions or removals, and tie monthly rental revenue to financial records. Report ancillary income separately, including electrical hookups, administrative fees, and late fees.
Explain weak results with documented causes and timing, such as newly completed inventory still leasing up. Back up strong results with consistent area schedules and recurring rental revenue - not a shrinking denominator or one-time fees. Keep actual RevPAF separate from projected stabilized RevPAF.
Calculation
EGI = gross potential rent − vacancy − concessions − bad debt + documented recurring ancillary income only. Use the same reporting period and a single basis for losses. If you start with collected rent, don’t subtract losses already accounted for in collections.
Why Buyers Review It
After reviewing revenue per square foot, buyers check how much income remains after vacancy, concessions, and bad debt. EGI shows how much rent reaches the income line. Buyers also confirm that recurring ancillary income comes from established programs with documented collections - not planned amenities. A clear EGI calculation provides the starting point for NOI.
Follow-Up Ranges and Warning Signs
Treat published self-storage loss ranges as a broad screening tool only. Boat and RV deals need property-specific support. Investigate losses that rise for several consecutive months, unstable ancillary income, or EGI growth that isn’t backed by rent increases, occupancy gains, or better collections.
Seller Records and Pre-Market Explanation
Provide 24 to 36 months of monthly financial records and a trailing 12-month EGI reconciliation. Use the same T12 period and inventory breakdown as the prior KPIs.
Show potential rent, vacancy, concessions, bad debt, collected rent, and each ancillary category separately. Back up the path from potential rent to recurring income with rent rolls, concession logs, aging reports, write-offs, and bank deposits. Keep one-time receipts, such as insurance proceeds or equipment sales, separate from recurring EGI.
For weak results, explain the dollar impact and document the cause. For strong results, provide evidence of stable collections and recurring ancillary income. For power or wash services, show users, pricing, usage, receipts, and direct costs. Keep projected EGI separate from historical EGI. Buyers then deduct recurring operating expenses to calculate NOI.
Calculation
After calculating EGI, buyers subtract normalized operating expenses to measure recurring profitability.
NOI = EGI − normalized operating expenses. Include only recurring property-level income and operating costs. Exclude debt service, income taxes, depreciation, and capital expenditures, and keep capital items in a separate budget. Expenses should reflect normal operations - not temporary savings or inflated costs.
Why Buyers Review It
Buyers use NOI to assess lasting earnings and test property value: stabilized NOI ÷ cap rate. NOI measures property-level cash flow before debt payments and financing effects. It does not show cash available after capital spending. Buyers then check whether the reported expenses hold up.
Follow-Up Ranges and Warning Signs
There’s no universal NOI-margin range for boat and RV storage. Compare properties in the same market with similar asset configurations.
Watch for declining T12 NOI, unexplained margin spikes, missing taxes or insurance, and expenses that fall while occupancy rises. Projections based on unbuilt spaces or unsupported rent increases also need scrutiny. High margins may hide deferred maintenance or omitted management costs. Sellers need records to back up every adjustment.
Seller Records and Pre-Market Explanation
Group records by function:
- Income support: T12 operating statement, current rent roll, at least three years of historical financials, and bank/deposit records.
- Expense support: General ledger (GL), tax bills, insurance, utilities, payroll, vendor invoices, and management agreement.
- Normalization support: One bridge showing reported, adjusted, and normalized NOI, with a reason and supporting document for each adjustment.
For self-managed properties, include a market-rate management fee. Update outdated expense assumptions, and remove one-time costs only when records support the change.
Explain weak NOI in dollars, separating temporary costs from lasting changes. Back strong NOI with implemented rent increases, current expense contracts, and completed capital work. Keep projected growth separate from historical results.
Calculation
Operating expense ratio (OER) = annual operating expenses normalized for recurring, property-level costs ÷ effective gross income (EGI) × 100. Both figures must cover the same reporting period. Use EGI - not potential gross rent.
Itemize taxes, insurance, payroll and benefits, utilities, repairs, marketing, software and payment processing, management, and recurring professional services.
After reviewing NOI, buyers use OER to check how efficiently the property produces that income.
Why Buyers Review It
OER shows how much of EGI goes toward operations. A 40% ratio leaves 60% of EGI as NOI. Compare properties with similar inventory types and service levels: open lots cost less to run than staffed, enclosed facilities with lighting and security.
Follow-Up Ranges and Warning Signs
Use 35%–45% as a screening band, not a pass-fail rule. A low ratio can reflect self-management, unpaid labor, deferred upkeep, or outdated insurance pricing. A high ratio can reflect stronger service, stormwater work, security, or low occupancy.
Check post-closing tax and insurance resets before assuming the ratio will hold.
Seller Records and Pre-Market Explanation
Buyers will compare the reported ratio with a normalized version. Provide three years of expense detail plus current-year-to-date results, and tie each category to bills, contracts, payroll, and maintenance records.
Show reported and normalized OER side by side. Separate management fees, tax resets, and one-time repairs so buyers can see each adjustment. Explain the changes in dollars and percentage points, backed by current insurance pricing and a post-closing tax estimate.
Keep routine gate servicing, pavement patching, and drainage maintenance in operating expenses. Show full-lot resurfacing, major drainage reconstruction, and new covered parking separately as capital projects. Do not reclassify recurring repairs as capital spending to improve the ratio.
Back a strong ratio with documented cost controls. Explain a weak ratio by separating one-time costs from recurring expenses.
Calculation
Year-over-year same-store revenue growth rate = (current-period revenue − prior-year same-period revenue) ÷ prior-year same-period revenue × 100.
Use at least 24 months of monthly records to compare the same spaces across matching periods. Separate expansion revenue, one-time fees, and unusual reimbursements so they don’t inflate the growth rate.
Why Buyers Review It
After checking revenue quality and NOI, buyers look at rent growth, occupancy changes, collections, and retention to see whether growth will last or follows seasonal patterns.
Show monthly in-place rents and achieved move-in rents, along with move-ins, move-outs, renewals, and delinquency by space type. Long tenant tenure supports value only when rates and retention hold up over time. Review legacy rents separately from tenant loyalty.
Follow-Up Ranges and Warning Signs
Year-over-year revenue below 0% for two or more comparable quarters - or growth below roughly 1% while expenses climb - calls for a closer look. Falling renewal rates and growth concentrated in one or two months also need review. Local boating and RV travel cycles can explain recurring peaks and dips.
Track move-outs within 30–60 days after rent increases. Compare those tenants with similar tenants whose rents stayed the same, matching by season and space type. Then check whether higher replacement rents offset vacancies and concessions. Keep billed rent, collected rent, and balances overdue by more than 30–60 days separate.
Seller Records and Pre-Market Explanation
Provide rent-roll exports, general-ledger revenue, move-in and move-out logs, renewal records, rate-change histories, and delinquency aging. Reconcile these records and break down revenue changes in dollars by pricing, occupancy, collections, and new inventory. Use the records to support assumptions about recurring growth in the valuation.
For weak periods, document what you changed and the results that followed. For strong periods, show gains across multiple months - not just one seasonal surge - so buyers can distinguish recurring growth from a short-term spike.
Calculation
Once NOI is normalized, buyers use the cap rate to translate that income into property value.
Going-in cap rate = normalized first-year forward NOI ÷ purchase price × 100. Show the trailing-12-month NOI yield alongside it.
Why Buyers Review It
The going-in cap rate measures the property’s first-year unlevered yield before financing effects. It’s not cash-on-cash return or IRR. Comparing trailing and forward yields shows how much the purchase price rests on current income versus expected improvements.
Follow-Up Ranges and Warning Signs
There’s no national 2026 cap-rate benchmark for boat and RV storage. Compare only verified local sales with similar space types, condition, occupancy, access, and sale dates.
Use the same NOI basis for the subject property and comparable sales. A large gap between trailing and forward yields needs line-item support from signed leases, documented operating changes, and local rent evidence.
Seller Records and Pre-Market Explanation
Provide a trailing-to-forward NOI adjustment schedule backed by operating statements, executed leases, tax records, insurance quotes, and service contracts. Separate contracted changes from business-plan assumptions.
Explain weak trailing performance and when improvements are expected. If the forward yield is strong, provide evidence that the income can hold up over time.
Include NOI and price sensitivities. Keep capital needs out of NOI and disclose them in a dedicated capital schedule. Review deferred maintenance and expansion costs separately in KPI 10.
After reviewing cap rate, buyers assess how much capital the property still needs to protect current income or generate new income.
Calculation
Cap rate shows value. This KPI shows how much capital it takes to protect or grow that value.
Build a 12- to 24-month capital schedule, with first-year repairs listed separately. Report total capital dollars and calculate:
Capital per existing space = required near-term capital ÷ existing rentable spaces.
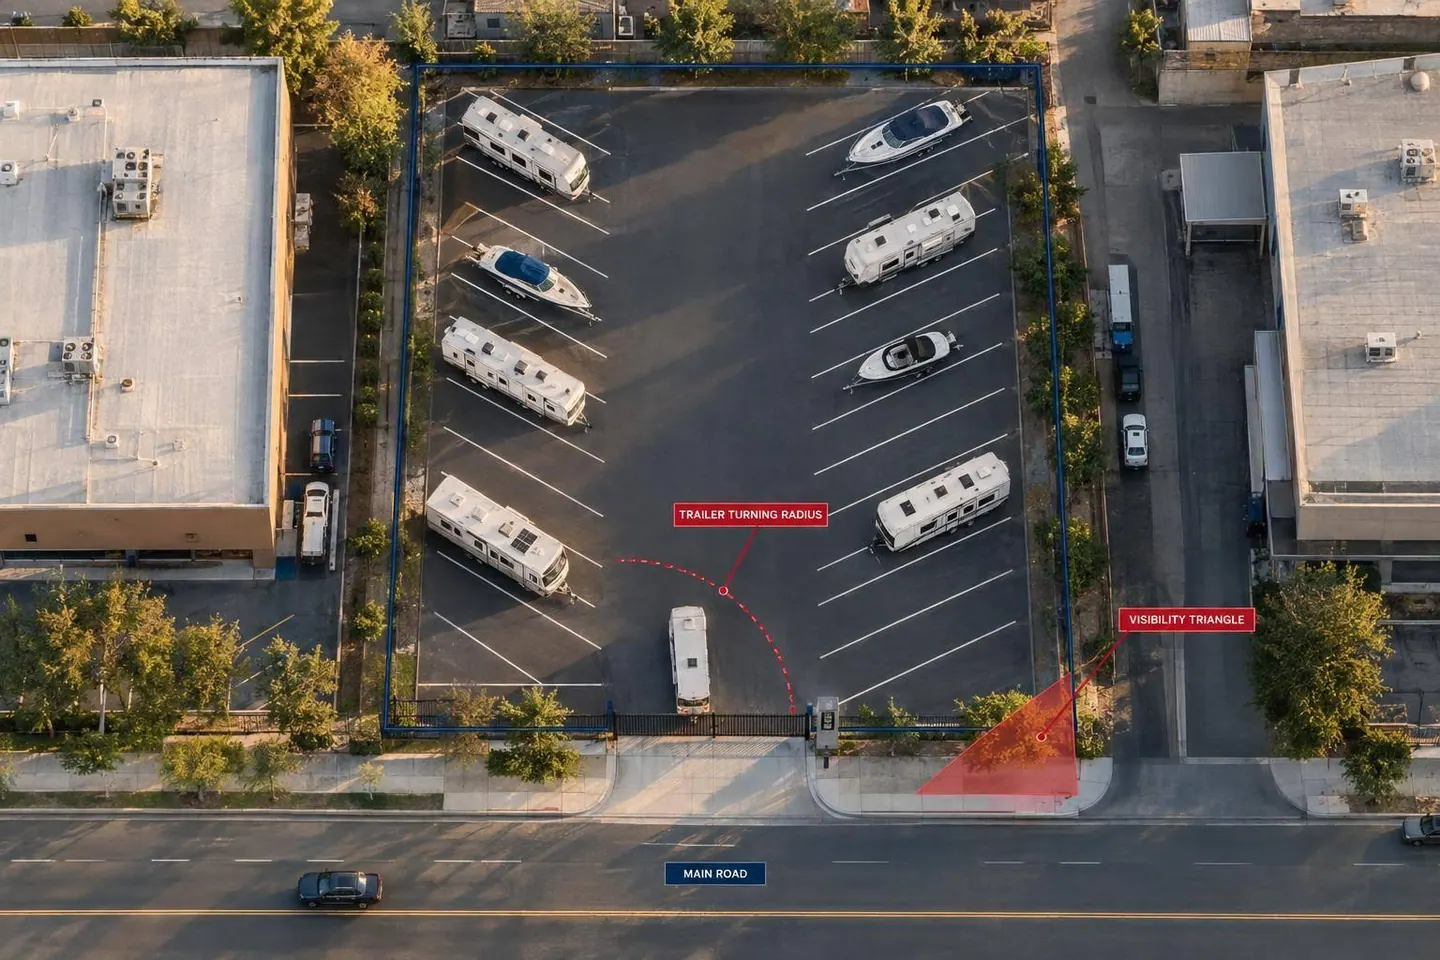
Count only verified additional spaces, broken out by product type. Support that count with a current survey or site plan, compliant dimensions and aisle layout, turning radii, access, utilities, and a documented zoning and permitting path.
Expansion cost per added space = total expansion cost ÷ verified added spaces.
Include hard costs, engineering, permits, fees, carry costs, and contingency.
Why Buyers Review It
This KPI separates cash flow quality from hidden reinvestment needs. A Property Condition Assessment (PCA) helps buyers identify immediate repairs, remaining useful life, and future replacements.
Addressing deferred maintenance can protect existing income. Expansion, however, only works when incremental NOI justifies the all-in development cost and lease-up risk.
Follow-Up Ranges and Warning Signs
There is no universal acceptable capital cost per space. Unpriced work, standing water, extensive pavement cracking, roof leaks, and failing gates all need follow-up.
For known items costing more than $10,000, obtain at least two contractor bids dated within six months. Separate cosmetic sealcoating from structural pavement repairs. Heavy vehicle loads make that distinction important.
Seller Records and Pre-Market Explanation
Provide condition reports, contractor estimates, a three- to five-year capital-improvement history, invoices, and warranties. Price the work needed for pavement, roofs, drainage, fencing, lighting, security, utilities, and permit-related upgrades.
For unresolved work, disclose the scope, timing, access restrictions, and whether the estimate covers the full cost of completion.
Label expansion as conceptual, entitled, or permitted. These stages are not interchangeable. Back up expansion plans with zoning approvals, utility confirmations, and permit records.
Buyers should count added spaces as executable upside only when they are verified, permitted, and underwritten against incremental NOI. That underwriting should use base-case and conservative cost models, rent evidence, and a realistic lease-up schedule.
Present KPI combinations, not isolated metrics. The table below connects each pairing to the questions buyers ask when underwriting a property. High occupancy can coexist with weak collections. A strong NOI margin can also hide costs buyers will need to cover. Use these pairings to test what headline numbers leave out, then back each claim with records buyers can check quickly.
| KPI Combination | Potential Strength | Buyer Concern | Supporting Evidence |
|---|---|---|---|
| High physical occupancy, lagging collections | Demand is proven. | Discounts, legacy rents, concessions, or delinquency reduce collected revenue. | Space-level rent roll, accounts-receivable aging, concession logs, and monthly physical-to-economic occupancy reconciliation. |
| Below-market rents with retention after increases | Past retention supports a measured rent-reset plan. | Further increases may cause move-outs; comparisons must match space type and amenities. | Rent comparisons, increase notices, renewal records, and affected tenants’ retention and collection results. |
| High NOI margin with missing management cost or deferred capital | The property may run with low operating costs. | Missing management cost or deferred capital can overstate cash flow buyers can maintain. | T12 statements, expense invoices, management assumptions, reported-to-normalized NOI bridge, and capital schedule. |
| Strong NOI with deferred maintenance | Current operations generate cash flow. | Near-term repairs could consume cash or disrupt access and leasing. | A current property-condition report, photographs, bids, warranties, maintenance logs, and repair costs, urgency, and timing. |
| Permitted vs. conceptual expansion | Approved capacity offers upside. | Conceptual space may fail engineering or approval review. | Approval status, permit conditions and expiration dates, approved plans, and phased cost and delivery schedule. |
If self-management explains the missing management line, say so - don’t call it efficiency. Start underwriting with a management allowance of 5%–6% of revenue, plus payroll. Support that adjustment with the normalized NOI bridge, and keep capital items in a separate schedule.
For revenue improvements, report retention only among tenants who received increases, not across the whole facility. Include notice dates, increase amounts, subsequent move-outs, and collections. Model 25%, 50%, and 100% implementation of planned increases, each with matching retention assumptions. Label every gain as projected.
Apply this approach to every material strength and weakness in the buyer package, showing how performance, pricing power, and capital needs affect one another. For each material weakness, state the condition, financial effect, cause, evidence, corrective action, and timing.
Identify repairs with cost estimates and name who will fund them. Set realistic milestones for collections, rent resets, and expansion instead of giving one completion date. Present unresolved issues alongside strengths so buyers can underwrite both price and closing terms.
After the KPI screen, buyers need a data room where they can check each number without digging through files. Create a one-page KPI index that links every summary number to its source. For all 10 KPIs, include the definition, formula, period, source, preparer, and reconciliation note. Label each figure as actual, annualized, normalized, or projected. Date the files and use version control.
Provide 24–36 months of monthly operating data, a trailing-12-month statement, and year-over-year comparisons to support occupancy, collections, and NOI trends. Where applicable, separate uncovered, covered, enclosed, powered, and other product types. Show monthly available and occupied spaces, physical occupancy, billed and collected rent, concessions, bad debt, ancillary income, operating expenses, and NOI. Monthly reports show seasonality, lease-up, and recent softening more clearly than an annual average. Log any inventory or software changes that affect comparisons.
Connect occupancy to revenue with a reconciled rent roll. For each space, list dimensions, product type, tenant record, rent, discounts, deposits, move-in date, delinquency, and agreement status. Reconcile those records to agreements, payment history, deposits, and the ledger. Maintain a variance log with the amount, cause, affected period, and corrective treatment. Explain prepayments and settlement delays rather than forcing exact monthly matches.
For valuation, include the normalized NOI bridge, evidence for every adjustment, and market-rent support. Keep market-rent upside out of historical NOI. Show it in a separate sensitivity schedule. Add a dated local rent survey with comparable facilities, distance, product type, dimensions, coverage, power, security, amenities, advertised and effective rents, and concessions. Report effective rent only when verified.
Attach the property-condition and capital files that support KPI 10’s deferred maintenance and expansion analysis. Include the assessment or inspection report, site plans, photographs, repair logs, warranties, permits, insurance-claim history, invoices, and a five-year capital-needs schedule. Separate completed capital work from unfunded needs.
Keep expansion in its own file. List existing and proposed rentable spaces, survey or site-plan references, zoning and conditional-use status, required approvals, utility and stormwater constraints, hard and soft costs, and construction timing. Include stabilized occupancy and rent assumptions, incremental revenue, operating expenses, NOI, and return on cost.
Buyers read the 10 KPIs as one operating story. Physical occupancy must turn into collections. Pricing and expenses must support NOI, while the going-in cap rate connects NOI to price. Capital needs show how much more buyers must invest after closing. Before taking the property to market, make sure buyers can verify those results.
Before listing, reconcile the rent roll, occupancy reports, bank deposits, general ledger, and T12 financials. Show strengths through monthly trends - not just one strong month. For each weakness, spell out the dollar impact, timing, and how you’ll address it. For major capital items, complete the work, secure firm bids, or account for the cost through an escrow, credit, or discount.
Screening ranges guide diligence, not value. Boat and RV storage has no standard national occupancy or cap-rate benchmark. Buyers should use local operating records and comparable transactions to assess the full operating story, rather than treating any single metric as a pass-fail test.
Which KPI problems should make me walk away?
Consider walking away or pausing due diligence if physical occupancy exceeds economic occupancy by more than 10%, collections are inconsistent, or profit and loss statements, tax returns, and bank records don’t match.
Also watch for undocumented manual processes, dependence on personal relationships, unresolved roofing, drainage, or security system maintenance, records you can’t verify, and occupancy inflated by heavy discounts. These risks may outweigh potential returns.
How do I estimate cash flow after debt and repairs?
Calculate net operating income (NOI) by subtracting operating expenses from effective gross income. Then subtract annual debt service to estimate pre-tax cash flow. Be sure to account for routine maintenance and capital expenditures.
Buyers often cut their offers by twice the estimated cost of deferred repairs to allow for uncertainty. Consider spreading larger projects over 12–24 months. Keep profit and loss (P&L) statements and capital improvement records well documented to back up your estimates.
How should weak KPIs affect my offer price?
Weak KPIs point to operating risks that can support a lower offer. Gaps in economic occupancy, high delinquency rates, or uneven revenue typically prompt buyers to use the higher end of the market cap rate range to account for that added risk.
When performance falls below stabilized thresholds - such as economic occupancy of 88% or higher - expect buyers to negotiate a lower price to reflect the work needed to stabilize the asset.