Storage deals in 2026 are priced off current income, tighter loans, and buyer type – not 2022 peak pricing. If I had to sum it up in one line: top-tier self-storage in major metros still gets low-5% cap rates, while secondary, tertiary, value-add, and boat/RV deals need much higher yields to trade.
Here’s the short version:
- Self-storage cap rates often land around 5.0% to 7.5%+
- Institutional buyers usually focus on Class A, primary-market, scaled deals
- Private buyers usually want more yield and spend more time on smaller, secondary, tertiary, and value-add assets
- Boat and RV storage often trades 50 to 150 basis points above self-storage
- Debt costs in the mid-5% to 6% range are keeping bids in check
- Loan leverage is often around 55% to 65% LTV
- DSCR tests around 1.25x to 1.35x+ are limiting what buyers can pay
- National asking rents were about $16.47/SF in July 2026, down 1.6% year over year
In other words: buyers are paying for stable cash flow, clean numbers, and market depth. If a deal depends too much on future rent growth, loose loan terms, or a thin buyer pool, price usually drops.
Quick comparison
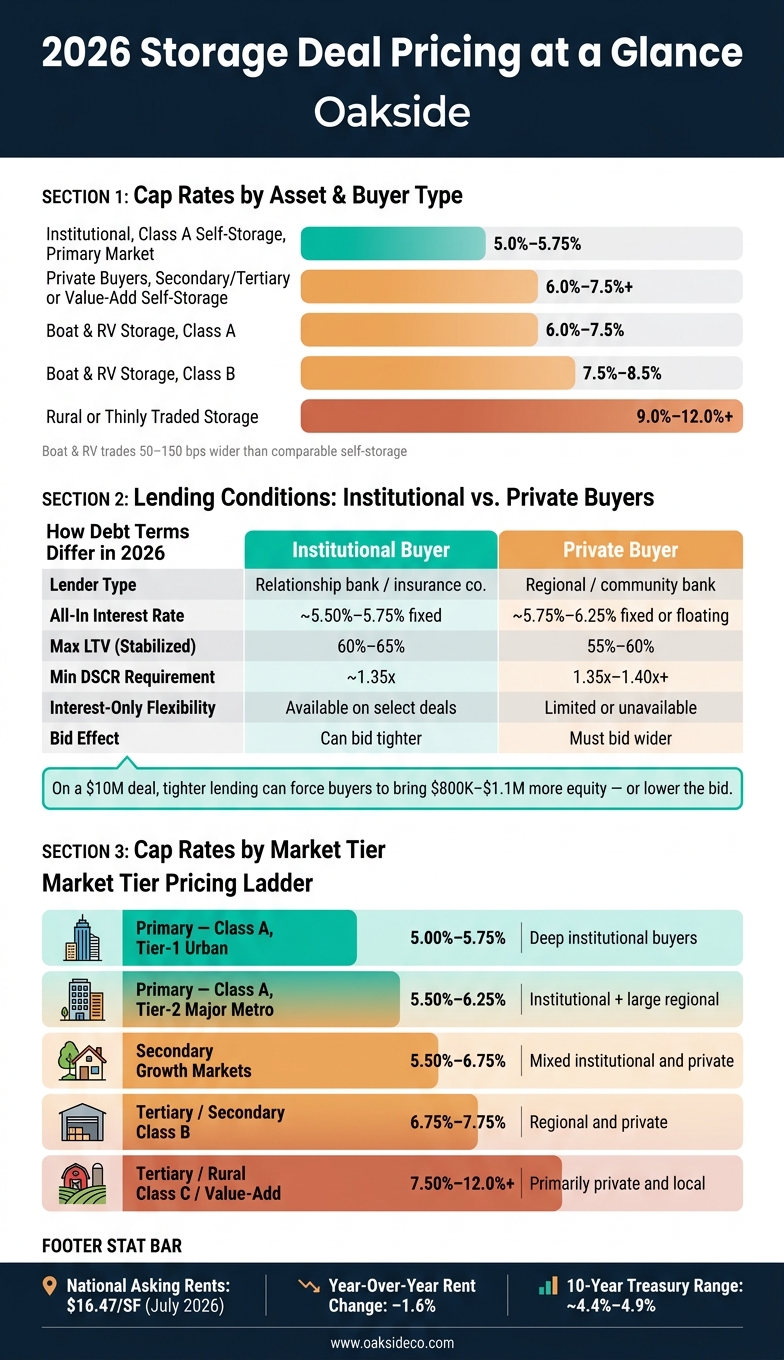
| Buyer/Asset Type | Typical Cap Rate | What drives pricing |
|---|---|---|
| Institutional, Class A self-storage, primary market | 5.0%–5.75% | Scale, low risk, portfolio fit, cleaner financing |
| Private buyers, secondary/tertiary or value-add self-storage | 6.0%–7.5%+ | Higher yield targets, more leasing and execution risk |
| Boat & RV, Class A | 6.0%–7.5% | Smaller buyer pool, less sales depth |
| Boat & RV, Class B | 7.5%–8.5% | More market risk, more lender caution |
| Rural or thinly traded storage deals | 9.0%–12.0%+ | Fewer buyers, lower leverage, harder exits |
If I’m looking at 2026 pricing, I’d keep one idea front and center: the deal is worth what today’s NOI and today’s loan terms can support.
2026 Storage Deal Pricing: Cap Rates by Buyer Type & Market Tier
Cap Rate Trends: Institutional vs. Private Buyer Pricing
How Cap Rates Have Shifted in 2026
Cap rates have reset and are now mostly stable, with roughly 25 bps of near-term movement expected.
The main driver is debt. Higher borrowing costs are pushing bids lower, and with the 10-year Treasury sitting in roughly the 4.4%–4.9% range, buyers are underwriting to higher debt costs. That has widened the gap between top-tier assets and weaker properties.
You can see that reset most clearly in two places: how lenders are sizing loans and how buyers are underwriting exits.
How Institutional Buyers Are Pricing Class A and Portfolio Deals
Institutional capital is paying for durability, scale, and lower execution risk.
In 2026, Class A self-storage in primary markets typically trades at 5.0%–5.75%. That pricing is tied less to immediate cash-on-cash returns and more to long-term NOI growth, refinancing flexibility, and portfolio risk control.
These buyers can accept cap rates below borrowing costs at closing, especially if they expect operations and debt markets to improve during the hold period. That’s why portfolio deals and professionally managed assets often trade at the tighter end of the range. Scale matters. Lower execution risk matters too.
How Private Buyers Are Pricing Secondary, Tertiary, and Value-Add Assets
Private buyers are underwriting more risk, but they also want more upside.
With tighter bank lending, required yields are higher, so most private buyers target cap rates in the 6.0%–7.5%+ range, depending on the asset and market. That wider pricing usually reflects a simple trade-off: more leasing risk, more operating work, and more room to grow NOI over time.
Institutional buyers tend to pay for stability. Private buyers tend to pay for the chance to improve the asset. This often involves specific strategies to increase property value through operational improvements and modernization.
Where Boat and RV Storage Prices Relative to Self-Storage
Boat and RV storage trades wider than traditional self-storage, usually by 50 to 150 basis points, depending on cover type, location, and operating history.
Stabilized Class A boat and RV facilities typically trade in the 6.0%–7.5% range, while Class B assets often move into the 7.5%–8.5% range. The reason is pretty straightforward: there are fewer buyers and less trading depth than in conventional self-storage.
In the same capital-market frame, boat and RV storage is the wider-yield version of the same pricing logic driving self-storage.
In 2026, institutional buyers price stabilized Class A self-storage the tightest, private buyers pay more for secondary and value-add assets, and boat and RV storage usually trades 50 to 150 bps wider. Across all three, debt terms are still the first thing shaping how far bids can go.
sbb-itb-09b4138
How 2026 Lending Conditions Are Affecting Purchase Prices
Higher debt costs are pushing leverage down and, with it, purchase prices. Base rates are still high, and lender spreads have moved out, so all-in borrowing costs for stabilized self-storage loans now land in the mid-5% to 6% range for strong sponsors. Smaller private buyers often pay more. Compared with 2022, that jump in debt costs means buyers can’t borrow as much, so they can’t bid as aggressively.
How Tighter Underwriting Is Pulling Bids Down
Lenders are also being stricter on deal sizing. Maximum LTV is now more often 60% to 65% for institutional-grade properties and below 60% for smaller or riskier deals. Minimum DSCR targets have tightened too, usually landing between 1.25x and 1.35x on underwritten NOI, and even higher for lease-up or transitional assets.
That shift matters more than it might seem at first glance. On deals with shaky in-place income or clear lease-up risk, lenders are often sizing loans off current NOI, not the seller’s forward story. In plain English: they care more about what the property earns today than what it might earn later. That can leave proceeds 15% to 25% below seller pro forma.
On a $10,000,000 deal, that can force a buyer to bring $800,000 to $1,100,000 more equity to the table – or lower the bid.
Why Institutional and Private Debt Costs Move Differently
Institutional buyers have more financing options. They can tap relationship banks, insurance companies, debt funds, and structured facilities. That gives them more room to manage rate pressure than most private buyers.
Insurance company loans for top-tier sponsors are pricing in the high-5% to low-6% range, while private buyers are more exposed to current bank quotes and wider spreads. So even when two buyers look at the same asset, their cost of capital may be very different. And that difference flows straight into pricing.
What Lenders Are Favoring in 2026
Lenders are leaning toward assets with clean numbers and steady demand. The deals getting the best terms usually have the same traits:
- Stabilized occupancy
- Clean trailing-12 operating statements
- Experienced operators
- Locations in markets with durable demand
CMBS executions in 2026 are also asking for debt yields of 9% to 10% and minimum DSCR of 1.30x to 1.35x. On aggressively priced deals, those tests can be more limiting than LTV alone.
A practical 2026 comparison looks like this:
| Debt Factor | Institutional Buyer | Private Buyer |
|---|---|---|
| Typical lender type | Relationship bank or insurance company | Regional/community bank |
| All-in interest rate | ~5.50%–5.75% fixed | ~5.75%–6.25% fixed or floating |
| Max LTV (stabilized) | 60%–65% | 55%–60% |
| Min DSCR requirement | ~1.35x | 1.35x–1.40x+ |
| Interest-only flexibility | Available on select deals | Limited or unavailable |
| Bid effect | Can bid tighter | Must bid wider |
These lending screens are helping stretch the pricing gap between primary markets and everything below them.
Pricing by Market Type Across U.S. Storage Deals
With debt still tight, market tier matters almost as much as asset quality. Primary metros still pull in institutional capital, while tertiary markets need wider yields to get deals done.
Primary Markets: Tighter Cap Rates and Stricter Asset Standards
Primary metros are still institutional territory. In major metros like New York, Los Angeles, Dallas, and Atlanta, stabilized Class A self-storage usually trades at 5.0%–5.75%. Supply-constrained urban infill portfolios can price below 5.0%.
Climate-controlled Class A product also tends to trade 25–75 basis points tighter than similar drive-up assets in the same market. That gap makes sense. Buyers will often pay up for product that feels easier to operate and easier to defend.
But this isn’t the 2021–2022 rush anymore. Institutional buyers are using more conservative rent growth assumptions and looking closely at in-place income. They’re not betting on another demand spike. If an asset has weak competitive positioning or clear management gaps, buyers mark it down even in liquid markets.
Secondary Growth Markets: The Middle of the 2026 Pricing Range
This is where institutional and private capital meet in the middle. Markets like Phoenix, Tampa, Charlotte, Nashville, and Kansas City tend to price in the middle of the 2026 range because demand growth is being offset by new supply and concessions.
Population growth and household formation still help demand. At the same time, active construction pipelines and lower barriers to new supply in parts of these metros add real supply risk. That’s why two deals in the same metro can trade very differently.
A stabilized facility in a submarket with limited new competition may come close to primary-market pricing. A property in a corridor with several new deliveries and heavy promotional discounting will usually trade at a wider cap rate and a lower price per square foot. In plain English: the submarket matters more than the metro label. And as buyer pools get thinner and lenders pull back, that pricing spread gets even wider.
Tertiary and Rural Markets: Higher Yields and Fewer Buyers
These deals are mostly private-buyer territory. Tertiary markets trade wider, usually at 7.5%–10.0%+, while rural deals often reach 9.0%–12.0%+ because both lenders and buyers are thinner.
The buyer pool is limited, and performance often leans heavily on one owner-operator’s local relationships. Institutional buyers regularly discount that risk. If too much of the story depends on one person knowing the market inside and out, the deal gets harder to scale and harder to exit.
Boat and RV storage near lakes, coasts, and national parks still gets attention from buyers. Demand is there. But seasonal revenue and thinner lender appetite keep cap rates wider.
How Supply and Rent Trends Are Separating Submarkets
New deliveries, concession activity, and barriers to entry are creating bigger valuation gaps even inside the same metro. In dense submarkets with high barriers to entry, a lack of new product helps keep cap rates tighter. In corridors where entitlements are permissive and several projects are under construction, buyers widen cap rates even if the metro still carries a "core" label.
Rent trends add another layer. Facilities where in-place rents are holding without heavy discounting are seen as more stable and priced that way. Where operators are leaning on free-month promotions or aggressive concessions to keep occupancy up, underwriters treat current street rates as less durable and push required yields higher.
These differences show up most clearly in cap rates, buyer depth, and lender selectivity.
| Market Tier | Typical Cap Rate Range | Typical buyer pool | Main pricing pressures |
|---|---|---|---|
| Primary (Class A, Tier-1 urban) | 5.00%–5.75% | Deep institutional | Conservative rent growth underwriting, strict asset standards |
| Primary (Class A, Tier-2 major metro) | 5.50%–6.25% | Institutional + large regional | Supply pipeline scrutiny, management quality |
| Secondary growth markets | 5.50%–6.75% | Mixed institutional and private | New deliveries, concession activity, submarket fundamentals |
| Tertiary / secondary (Class B) | 6.75%–7.75% | Regional and private | Thinner buyer pool, financing constraints |
| Tertiary / rural (Class C / value-add) | 7.50%–10.0%+ | Primarily private and local | Operator dependence, limited exit liquidity, lender pullback |
What 2026 Pricing Means for Owners Thinking About Selling
How to Match Your Asset to the Right Buyer Pool
Properly positioning your facility is a core part of a comprehensive exit strategy.
With cap rates and debt still setting the price, the seller’s job is simple: market the asset to the buyer pool that can actually close.
In 2026, that means matching the deal to the group that can finance it. A stabilized, well-occupied facility in a primary or secondary market is a fit for institutional capital. A value-add property in a tertiary market is usually a better fit for private buyers underwriting upside, not just current income.
And for boat and RV assets, use boat and RV comps – not self-storage comps. That makes the valuation package just as important as the asking price.
To support a cleaner valuation, sellers should provide:
- A normalized T-12
- A rent roll
- Occupancy history
- Submarket comps
Oakside‘s View on Pricing Discipline in 2026
That discipline matters most when sellers want to avoid retrades.
"The deals that close cleanly are the ones where the seller’s pricing reflects cap rates, debt terms, and submarket conditions – not what a similar asset might have fetched in 2022. Buyers are underwriting from the yield out, and lenders are shaping how far bids can realistically go. Sellers who understand that dynamic early avoid retrades and failed financing."
- Nolen Masserman, Managing Director at Oakside
Key Takeaways for 2026 Storage Sellers and Buyers
For sellers and buyers, the message is straightforward:
- Stabilized institutional-quality self-storage in major metros is trading at about 5.0%–5.5% cap rates, while secondary and tertiary assets often trade at 7.0%–8.0%+ yields. That’s a clear reset from prior lows, and sellers who overvalue their assets by sticking to peak-cycle pricing are likely to hit friction.
- Debt is still the clearest limit on bid levels. When lenders require 1.25x–1.35x DSCR and reduce leverage, buyers can’t stretch to match old price-per-square-foot marks, no matter how much interest exists.
- With national asking rents at $16.47/SF as of July 2026, down 1.6% year over year, property-level performance isn’t giving buyers much help against tighter financing.
- Sellers with the best shot at solid outcomes are the ones who price to today’s underwriting reality, line up the asset with the right buyer pool, and back up the story with data that stands up to review.
FAQs
Why are cap rates higher in 2026?
Cap rates are higher in 2026 for one main reason: the zero-interest-rate era is over, and the 10-year Treasury is still a headwind. With borrowing costs up, buyers want a bigger spread to hit their return targets.
Since 2021, cap rates have expanded by about 75 to 150 basis points, though the exact move depends on risk. Older assets, properties in tertiary markets, and lease-up deals need higher yields to get deals done. Meanwhile, stabilized, institutional-quality properties in major metros still trade at tighter pricing.
How do loan terms affect what buyers can pay?
Loan terms have a direct effect on a buyer’s required return and the maximum price they can afford to pay.
Here’s the simple version: when debt gets more expensive, the deal has less room to work.
Higher borrowing costs, tighter DSCR limits, and stricter underwriting all cut into the amount of cash flow a property can support. And when that happens, buyers usually have to lower their offers to make the numbers pencil out.
That often leads to higher cap rates and lower pricing, especially for properties with weaker risk profiles or more exposure to rate swings. On the other hand, buyers with more cash or lower leverage can often pay closer to stabilized cash-yield targets because they’re less boxed in by lender terms.
What makes one storage market price better than another?
One storage market tends to price higher when local conditions point to a lower implied exit cap rate on stabilized, repeatable NOI.
In 2026, buyers usually start with market tier and asset class. Then they fine-tune pricing based on occupancy quality, revenue mix, operating efficiency, and lease-up risk. Markets with tight supply and higher barriers to entry often support steadier cash flow. By contrast, heavy lease-up risk, weak collections, and forecast uncertainty tend to push pricing apart.