

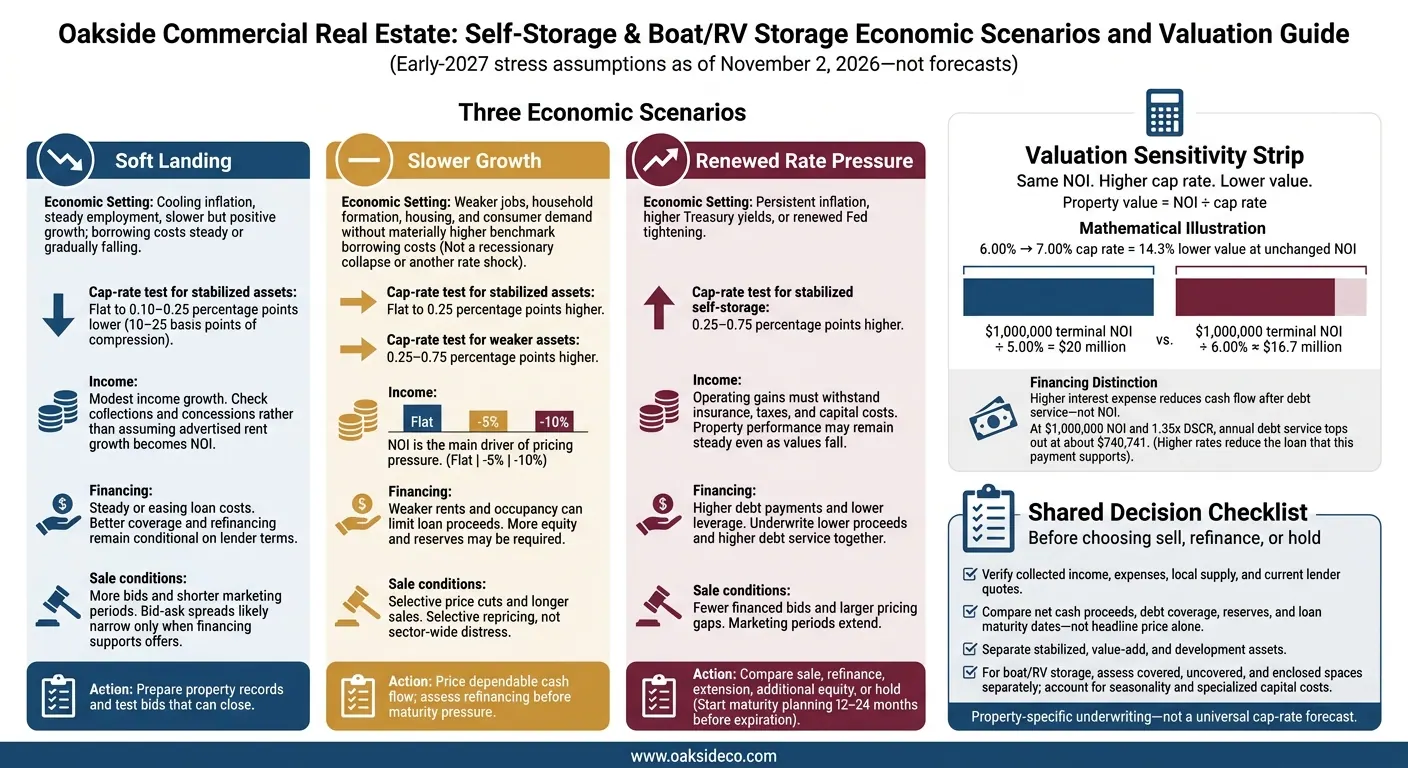
I’d test three scenarios before setting a storage property’s price - not bet on one rate forecast. At unchanged net operating income (NOI), a cap rate moving from 6% to 7% cuts value by 14.3%. Lower borrowing costs alone won’t guarantee a higher sale price.
As of November 2, 2026, I’d use these early-2027 stress assumptions, not forecasts:
Quick Comparison
| Scenario | Cap-rate test | Income and financing | Sale conditions |
|---|---|---|---|
| Soft landing | Flat to 0.10–0.25 percentage points lower for stabilized assets | Modest income growth; steady or easing loan costs | More bids and shorter marketing periods |
| Slower growth | Flat to 0.25 points higher for stabilized assets; 0.25–0.75 points higher for weaker assets | Weaker rents and occupancy can limit loan proceeds | Selective price cuts and longer sales |
| Renewed rate pressure | 0.25–0.75 points higher for stabilized self-storage | Higher debt payments and lower leverage | Fewer financed bids and larger pricing gaps |
My starting point: <u>verify collected income, expenses, local supply, and current lender quotes</u>. Then I’d adjust for self-storage versus boat/RV storage, seasonal demand, and whether the property is stabilized, needs work, or is still being developed.
For each case, I’d compare selling, refinancing, or holding using net cash proceeds, debt coverage, reserves, and loan maturity dates - not the headline price alone.
2026 Storage Cap Rates: Three Economic Stress Scenarios
A soft landing means cooling inflation, steady employment, slower but positive growth, and borrowing costs that hold steady or gradually fall. CBO’s 2026 projections offer reference points: 2.7% PCE inflation, 4.6% unemployment, and a 3.4% federal funds rate in the fourth quarter. These conditions set the pricing test for stabilized assets.
Cap Rates and Values
For stabilized, well-located assets, stress test flat cap rates to 10–25 basis points of compression to assess pricing and liquidity. Steady occupancy, limited new supply, and good property condition support tighter pricing.
Properties still leasing up need separate allowances for carrying costs and execution risk. A lower exit cap rate shouldn’t replace achievable NOI.
Property Performance
Underwrite modest revenue growth, with lasting NOI supporting exit pricing. When comparing self-storage and boat/RV storage returns, check whether rents and collections improve without heavier concessions. For boat/RV storage, document renewal rates, seasonal utilization, and demand for covered or enclosed spaces.
Favor current income over aggressive rent increases, and keep insurance and property tax pressures in the model. Even with operating gains, the debt market’s cost of capital still matters.
Financing Availability
Stable or lower rates could improve coverage and refinancing options. But CBO’s projected 4.1% 10-year Treasury yield for 2026 still points to expensive long-term debt.
Compare current fixed- and floating-rate quotes based on net proceeds, amortization, reserves, covenants, and prepayment costs - not just the interest rate.
Transaction Liquidity
Predictable financing can narrow bid-ask gaps, especially for assets with clean operating records and realistic pricing. Before marketing, assemble rent rolls, capital-expenditure history, supply analysis, and current financing indications.
Track contingencies, retrades, and offers to test whether deals can close at the implied cap rate. The next case tests what happens when growth weakens and pricing discipline tightens.
Slower growth means weaker gains in jobs, household formation, housing, and consumer demand, without materially higher Treasury yields or benchmark borrowing costs. This is a stress scenario - not a recessionary collapse or another rate shock.
Cap Rates and Values
Model cap rates from flat to 25 basis points higher for stabilized assets and 25–75 basis points higher for weaker assets, where slower NOI growth and higher capital needs weigh on value. Cap-rate pressure comes from weaker income expectations and liquidity, not slower growth alone. NOI is the main driver of pricing pressure in this scenario.
Property Performance
For self-storage, test slower leasing, deeper move-in discounts, and the gap between advertised and in-place rents. Advertised rent growth was just 0.3% year over year in August 2025, showing how fast pricing power can fade when supply stays elevated.
For boat/RV storage, test a shift from covered to uncovered spaces, slower absorption of newly delivered supply, and renewal and delinquency trends by format. In both sectors, weaker leasing and slower absorption limit NOI growth, reduce buyer confidence, and put pressure on exit pricing.
Financing Availability
Test flat NOI, a 5% decline, and a 10% decline. Larger loan spreads still matter, but weaker income is the bigger constraint on debt-service coverage and loan proceeds. Lease-up assets may need more equity, larger reserves, or recourse, especially when seasonal income makes repayment capacity harder to underwrite.
Transaction Liquidity
Expect selective repricing, not sector-wide distress. Well-located assets may still attract multiple bids. Properties with weak occupancy or unfinished capital improvements may take longer to sell and need pricing concessions.
Before choosing a sale date, compare deferred maintenance costs with the discount needed to increase self-storage property value before sale. For near-term maturities, assess refinancing or recapitalization before timing pressure limits your options. If slower growth also brings higher funding costs, both NOI and financing will add to cap-rate pressure.
Higher rates increase required returns and borrowing costs, which can push values down even when property performance is steady. Persistent inflation, higher Treasury yields, or renewed Fed tightening could keep that pressure in place for several quarters. Exit pricing and financing costs are the main stress points.
Cap Rates and Values
Use 25–75 basis points of cap-rate expansion to stress-test stabilized self-storage - not as a market forecast. Apply tougher exit assumptions to lease-up, expansion, and capital-intensive assets.
At unchanged NOI, a 6.00% cap rate rising to 7.00% cuts value 14.3%.
Then assess which property features can best withstand that pressure.
Property Performance
Test whether achievable rents can cover increases in insurance and property taxes. For boat/RV storage, also account for paving, stormwater, utilities, security, and entitlement costs. Insurance, taxes, and specialty improvements eat into the NOI cushion available to absorb higher required yields.
Boat/RV assets may warrant a larger cap-rate spread because specialized improvements and a smaller buyer pool limit liquidity. Phase or defer development and expansion when projected income cannot cover higher financing and carrying costs.
Financing Availability
Underwrite lower loan proceeds and higher debt service together. Compare fixed-rate debt with interest-rate caps based on all-in cost, and hold cash reserves for longer lease-up periods.
Start maturity planning 12–24 months before expiration. Compare refinancing, extensions, additional equity, and a sale. These constraints affect how much leverage buyers can support and how far buyer and seller pricing expectations may drift apart.
Transaction Liquidity
Expect fewer bids and larger pricing gaps. Sellers can separate the price for current cash flow from an earnout tied to lease-up performance. Buyers should verify financing before committing to a price.
When a deal includes attractive existing debt, confirm assumption terms and lender approval before factoring financing savings into the price.
The same economic scenario affects stabilized, value-add, and development assets in different ways.
Start with collected revenue, not advertised rents. For self-storage, compare street rates with in-place and achieved rents to identify revenue gaps. Then track occupancy, concessions, delinquency, bad debt, turnover, and revenue per available unit by unit type. For boat/RV storage, measure demand by space size and layout: uncovered, covered, enclosed, and pull-through.
Separate climate-controlled self-storage units from drive-up units. Check whether revenue-management gains hold up after move-outs and higher utility, maintenance, and management costs. Map approved, proposed, and under-construction supply within the property’s practical drive-time area.
For boat/RV storage, track monthly occupancy, renewals, cancellations, and waitlists. Assess affordability by comparing monthly storage costs with vehicle value, household income, and ownership expenses such as financing and insurance. Check whether security, access hours, turning space, and proximity to recreation support achieved rent premiums. Underwrite expansion only after clearing zoning, stormwater, utility, permitting, and insurance requirements.
Use the matrix as directional underwriting guidance. Cap-rate changes refer to pricing for comparable assets. Development rows refer to the required yield on total cost.
| Property type and stage | Soft landing | Slower growth | Renewed rate pressure | Underwriting, financing, and buyer pool |
|---|---|---|---|---|
| Self-storage: stabilized | Cap rate stable or modestly firmer if NOI improves | Flat to higher, depending on local supply | Higher cap rate and lower leverage | Stress street-to-in-place rent spreads, concessions, occupancy, taxes, insurance, and near-term capital needs; broad buyer pool. |
| Self-storage: value-add | Moderate value creation if lease-up and revenue-management assumptions hold up | Longer execution period and larger concession reserve | Higher required return and greater discount to pro forma NOI | Underwrite downtime, renovation costs, lease-up, management fees, and exit liquidity; specialized buyers. |
| Self-storage: development | Require a demonstrated development-yield spread over the exit cap rate | Increase contingency, lease-up period, and minimum yield | Increase required yield and reduce leverage | Verify zoning, construction costs, absorption, taxes, utilities, and takeout financing; narrow buyer pool. |
| Boat/RV: stabilized | Stable occupancy where location, security, and barriers to entry are strong | Test seasonal vacancy, discretionary demand, and rent sensitivity | Higher cap rates and more conservative financing | Segment covered and uncovered spaces, model seasonality and insurance, and verify lender terms; specialized buyers. |
| Boat/RV: value-add | Upside from covered spaces, security, access, and ancillary services | Delay expansion and moderate rent premiums | Require stronger cash yield and larger reserves | Verify demand by space type, permitting, maintenance, and expansion feasibility; specialized buyers. |
| Boat/RV: development | Require strong preleasing evidence or durable local demand | Extend absorption and reduce rent assumptions | Increase required development yield and exit-cap-rate spread | Stress zoning, stormwater, utility, security, construction, and seasonal lease-up risk; narrow buyer pool. |
A stabilized asset has normalized occupancy, rents it can maintain, recurring expenses, and limited near-term capital spending. A value-add asset needs a documented path from current NOI to NOI after renovation or revenue-management changes. That path must account for downtime, concessions, lease-up costs, repairs, taxes, insurance, and carry.
For development, stabilized NOI divided by total cost is the development yield - not the exit cap rate. The spread between the development yield and exit cap rate must cover construction, lease-up, financing, and market risk.
Rate support depends on location, barriers to entry, and capital intensity - not the sector label. Compare visibility, ingress and egress, zoning, taxes, utilities, maintenance, physical condition, and near-term capital needs when assessing buyer pricing, leverage, and required yield. Scarce boat/RV zoning may protect income, but specialized improvements and thin liquidity can erase that premium.
National averages don’t price these differences. Support property-level pricing with rent rolls, monthly operating records, local supply surveys, contractor estimates, insurance quotes, and lender terms. These differences shape the financing and transaction trade-offs that follow.
Scenario differences matter only if buyers can finance their offers. Liquidity improves only when bids and financing improve together. Treat these outcomes as conditional - not as forecasts.
| Scenario | Buyer behavior | Financing | Transaction volume | Marketing periods | Bid-ask spreads | Advantages | Disadvantages | Owner/buyer actions |
|---|---|---|---|---|---|---|---|---|
| Soft landing | More bids for dependable cash flow | Stable or easing rates | Likely increases | Likely shorten | Likely narrow | More qualified bids and greater closing certainty | Sellers may price in cap-rate compression before financing improves | Sellers: test bids that can close. Buyers: don't assume rate cuts are guaranteed. |
| Slower growth | Fewer bids; more risk of price renegotiation | Lower NOI growth reduces proceeds; more reserves and equity required | Flat or lower | Longer | Broader | Buyers can negotiate around proven in-place cash flow | Price renegotiations can delay closing | Sellers: verify collections and expenses before launch. Buyers: protect downside coverage and capital reserves. |
| Renewed rate pressure | Fewer financed bids | Lower leverage and higher debt-service requirements | Likely falls sharply | Extended | Broader | Well-capitalized buyers gain negotiating room | Equity gaps and refinancing risk | Compare a lower cash price, seller financing or structured pricing, refinancing, or holding. |
Next, check whether the capital stack supports the bid. Higher interest expense reduces cash flow after debt service - not NOI.
At $1,000,000 of NOI and a 1.35x DSCR, annual debt service tops out at about $740,741. Higher rates reduce the loan that payment supports, increasing required equity unless the price falls. Separately, a 5.00% exit cap rate values $1,000,000 of terminal NOI at $20 million; a 6.00% exit cap values it at approximately $16.7 million.
Stress-test debt costs and exit cap rates separately.
Match the capital stack to the asset’s risk. Stabilized, institutional-quality properties generally attract a deeper equity pool, lower return hurdles, and longer holds. Qualifying stabilized assets may support roughly 60%–75% LTV, but loan proceeds still depend on DSCR, amortization, recourse, and reserves. Properties with execution risk need lower leverage, more equity and reserves, and higher levered and unlevered return targets. Compare loan covenants, not just interest rates.
Compare net cash received, not headline price. Seller proceeds equal the sale price minus debt payoff, prepayment charges, and selling costs. Financing gaps can also reduce the buyer’s offer.
A seller note may preserve the stated price, but it delays cash receipts and adds collection risk. Earnouts need precise performance definitions. Preferred equity adds return obligations and control considerations.
Holding works best when cash flow is durable and fixed-rate debt stays within the owner’s ability to pay. Refinancing helps only if proceeds cover the existing balance and costs without exhausting reserves. Get lender feedback before marketing the property or reaching loan maturity.
Turn the scenario analysis into a pricing and sale plan. Set a pricing range and a sale trigger for each scenario instead of relying on one cap-rate forecast.
For a soft landing, get ready to move faster: organize property data, address deferred maintenance, and test sale or recapitalization options. For slower growth, base pricing on dependable cash flow and normalized NOI. If rate pressure returns, test higher exit cap rates, higher borrowing costs, lower proceeds, refinancing delays, and added equity needs before choosing to sell, refinance, or hold.
Check each plan against normalized NOI, lender quotes, and exit assumptions. Reconcile 12 to 24 months of operating history with the forward budget. Test exit cap rates 0.50 to 1.00 percentage points higher, then calculate how much debt the property can support, refinancing proceeds, and required equity. These are stress assumptions, not forecasts.
Keep asset differences clear. When applying the scenario matrix to boat/RV storage, assess covered, uncovered, and enclosed spaces separately and account for seasonality. Check whether self-storage assumptions fit these assets.
Use property-specific underwriting - not a universal 2026 cap rate forecast - to guide the decision. Oakside Co supports scenario-based valuation and disposition planning for self-storage and boat/RV assets.
How do I choose a starting cap rate for my storage property?
Start with today’s stabilized cap-rate benchmark for your asset and market, then adjust for risk.
For self-storage, use roughly 5.0%–5.75% for Class A properties in primary markets, 6.0%–6.75% for Class B in secondary markets, or 7.25%–7.5%+ for Class C in tertiary markets. Lease-up and value-add properties often run higher, at around 7.5%–9.0%+.
For boat/RV properties, expect about 5.5%–6.25% for Class A or 7.5%–8.5%+ for Class B/C.
Before choosing your starting cap rate, verify normalized net operating income (NOI). Assess income stability separately from your cap-rate assumptions.
Which indicators should trigger a change in my sale plan?
High physical occupancy doesn’t always mean strong collections. Revisit your sale plan if collections lag, concessions grow, rate changes are uneven, or street rents keep falling.
Build projections using 24–36 months of occupancy trends, historical rents, and hyper-local data, rather than seasonal peaks. Watch debt markets, too: buyers prioritize stable income, debt yields of 8%–10%, and debt service coverage ratios of 1.35x–1.50x or higher.
How much cash should I reserve for a delayed sale?
Model opening delays of 3, 6, and 12 months to estimate the reserves needed for a longer lease-up period and off-season demand swings. Factor in lower-than-projected economic occupancy and greater pressure from debt service. Current market conditions favor steady, long-term cash flow over peak-season occupancy.
Use 24 to 36 months of data for valuation and financial planning. This helps separate recurring seasonal patterns from actual declines in performance.