Solar can cut a self-storage facility’s power bill by 60% to 97%, trim payback to about 3 to 7 years, and add property value by lifting NOI. That’s the core takeaway.
If I were sizing up this type of project, I’d focus on five things first:
- Power use: climate-controlled sites tend to use more electricity
- Solar offset: many projects cover 70% to nearly 100% of annual use
- Annual savings: documented examples show savings like $28,800 to $32,306 in year one
- Payback: often 3.5 to 7 years, with some high-rate markets closer to 3 to 4 years
- Value effect: at a 6.0% cap rate, $25,000 in yearly savings can add about $416,700 in property value
Here’s the simple version: if a facility has a steady daytime load, enough roof space, and plans to hold the asset for several years, solar can lower utility costs and improve sale or refinance math. Tax items like the 30% federal credit and 5-year MACRS depreciation can also lower net project cost, though the owner’s tax setup matters.
A few points drive the whole case:
- Self-storage works well for solar when roofs are open and loads are steady
- Climate control is often the main source of electric use
- Utility savings flow straight into NOI if other costs stay flat
- Buyers and lenders usually want proof, not just estimates
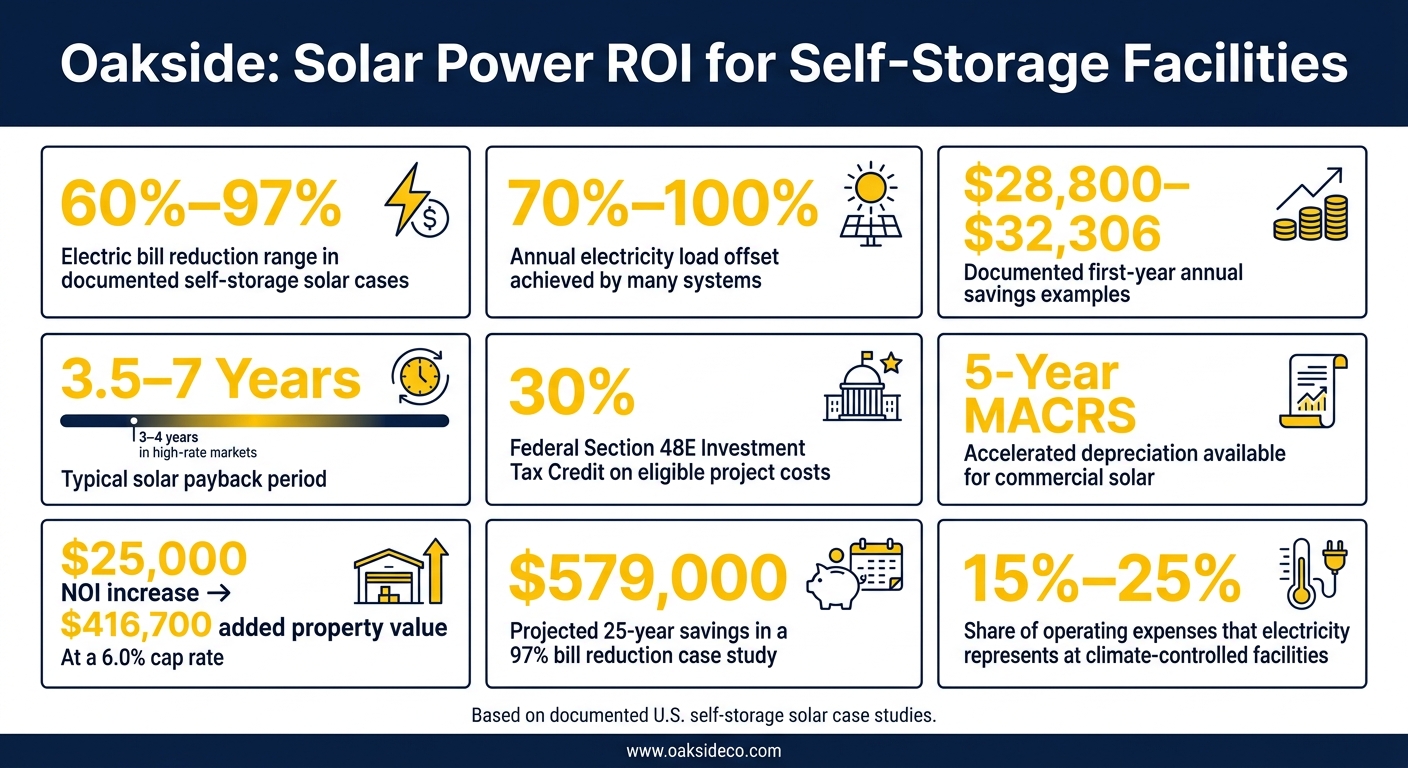
Solar Power ROI for Self-Storage Facilities: Key Numbers at a Glance
Quick Comparison
| What matters | What the article shows |
|---|---|
| Electric bill reduction | 60% to 97% in documented self-storage cases |
| Annual load offset | 70% to nearly 100% in many projects |
| Sample yearly savings | $28,800 and $32,306 in cited examples |
| Payback range | 3.5 to 7 years; sometimes 3 to 4 years |
| Sensitivity analysis | $25,000 added NOI ≈ $416,700 at a 6.0% cap rate |
| Best-fit asset type | Climate-controlled sites with solid roof area and long hold periods |
| Tax items mentioned | 30% Section 48E credit, 5-year MACRS, bonus depreciation |
If you own or underwrite self-storage, as part of your self-storage operations, I’d read this case study as a cash-flow story first and a power story second.
sbb-itb-09b4138
Facility Baseline: Property Profile and Pre-Solar Energy Costs
Facility Characteristics and Energy Load Drivers
This case study looks at a stabilized, professionally managed U.S. self-storage property with both standard drive-up units and climate-controlled space. The biggest source of electricity use was climate control. Lighting, ventilation, security systems, gate operators, and office space added to that load.
That mix set the property’s pre-solar utility baseline.
Baseline Utility Use and Annual Spend
Before solar, the owner tracked 12 months of utility bills to map baseline usage and seasonal swings. Summer cooling pushed bills to their highest point. The bill also included fixed utility fees and demand charges.
For climate-controlled facilities, electricity can account for 15% to 25% of operating expenses. So when utility costs drop, NOI can improve in a meaningful way.
| Baseline Metric | Observation |
|---|---|
| Annual electricity consumption | Tracked over a 12-month pre-solar period |
| Annual utility spend | A major operating expense driven mainly by usage charges |
| Average monthly spend | Higher during the summer cooling season |
| Peak summer monthly spend | Highest in July and August |
Roof age, shading, and structural capacity also shaped how much solar-ready roof area the property had. Those roof and load limits set up the system design covered in the next section.
Solar Installation: System Design, Costs, and Execution
System Size, Layout, and Equipment
Roof and service constraints pointed the project toward a rooftop array. That setup fit the available roof space and helped avoid disruption for tenants. The team sized the array to match the building’s annual electricity use instead of packing in as many panels as possible.
That matters for a simple reason: more panels don’t always mean a better project. By sizing the system around annual load, the project stayed within utility interconnection limits and kept production closer to what the property could use on-site or receive credit for under its utility setup.
The main equipment package included PV modules, inverters, racking, metering equipment, and a cloud-based monitoring platform. That monitoring piece does a lot of the day-to-day heavy lifting. It lets the owner track production, uptime, and system performance, and it can flag underperformance or inverter faults early before they turn into bigger problems.
That design choice also affected both project cost and which incentives applied.
Project Costs and Available Incentives
It’s smart to leave room in the budget for engineering, permitting, interconnection, and contingency. Utility review can shift both cost and timing, so this isn’t the place to cut things too close.
The federal Clean Electricity Investment Tax Credit (Section 48E) can cover 30% of eligible costs for qualifying commercial solar projects placed in service by December 31, 2027. Commercial solar may also qualify for 5-year MACRS depreciation and bonus depreciation, which can lower after-tax cost. Ownership structure plays a big role here because tax benefits go to the entity with tax appetite. So before locking in financing, operators should confirm eligibility with their tax advisor.
| Cost & Incentive Item | Detail |
|---|---|
| Federal ITC (Section 48E) | 30% credit on eligible costs |
| Depreciation treatment | 5-year MACRS property |
| Bonus depreciation | 100% in year one for eligible energy property |
Those project economics tie straight into the savings and property value outcomes covered in the next section.
Measured Results: Utility Savings, NOI Growth, and Value Impact
Energy Savings and Payback Period
Once installation costs and incentives are accounted for, the main question becomes simple: how much does the system save each year, and how long does it take to pay for itself?
Self-storage case studies show 60% to 97% lower electric bills, with many systems covering 70% to nearly 100% of annual power use. That tends to be strongest at climate-controlled sites, where daytime demand stays steady.
With incentives in play, solar payback for self-storage often falls between 3.5 and 7 years. In high-cost markets, that window can tighten to 3 to 4 years.
Here are a few documented examples:
| Documented Example | Annual Savings / Electricity Bill Reduction | Payback |
|---|---|---|
| 72% offset case | $28,800/year saved; 72% of annual consumption offset | 5.6 years |
| 97% reduction case | 97% electric bill reduction; $579,000 projected 25-year savings | Not stated |
| 99.71% offset case | 99.71% annual energy offset; $32,306 first-year savings | Not stated |
NOI Improvement and Property Value Increase
Utility savings flow straight into NOI, assuming other expenses stay flat. In plain English, if a property cuts $25,000 from its annual power bill, NOI goes up by that same $25,000. For stabilized self-storage assets, annual savings in the $17,000 to $35,000 range can make a clear difference right away.
One documented example shows how that math plays out. A 97% bill reduction led to about $579,000 in projected 25-year savings and a $480,000 increase in property value at a 4% cap rate.
Cap rates for stabilized self-storage assets in the U.S. often land around 5.0% to 6.8%, depending on the market and asset class. So even a modest bump in NOI can go a long way. At a 6.0% cap rate, a $25,000 NOI increase adds about $416,700 in property value.
And there’s another piece to this: when utility rates climb, each kWh the system offsets becomes worth more. That effect tends to be strongest on sites with steady power demand and enough roof space to support a larger system.
Takeaways for Owners and Investors
When Solar Makes the Most Sense for an Asset
Once you run the savings and payback numbers, the next step is simple: figure out which assets are set up to turn those numbers into actual returns.
Solar tends to work best when three things line up: high on-site power use, strong utility rates, and a long enough hold period.
Climate-controlled facilities often use more of the power a solar system produces on-site. That matters because using your own solar power tends to improve the return. Markets with higher electricity rates also tend to see shorter payback periods and better NOI growth. And hold period is a big part of the picture. Owners planning to keep an asset for 7 to 15 years usually have enough time to collect recurring utility savings and reflect that in the sale price later on.
For boat and RV assets, covered parking can help too. Canopy space isn’t just dead area overhead. It can become a power-producing part of the property.
Solar is usually the best fit for roofs that have:
- At least 15 years of life left
- Enough structural capacity
- Low shading
- A layout that supports panel placement
How Oakside Co Can Assess Solar’s Effect on Value
For underwriting, the main issue isn’t whether solar cuts costs. It’s how much of those savings will stick during the hold period.
Oakside can look at that by modeling annual savings, tax benefits, and exit value across different power-price and cap-rate scenarios. In practice, that means applying both going-in and exit cap rates to the added NOI and factoring in how the 30% Investment Tax Credit changes after-tax returns. MACRS accelerated depreciation can also improve the economics.
For a sale or refinance, projected savings alone won’t do the job. Buyers and lenders want proof. That means Oakside should package clear support materials for dispositions, including production data, warranties, interconnection terms, and O&M responsibilities, so buyers can underwrite the NOI lift without wasting time.
FAQs
How do I know if my facility is a good fit for solar?
A facility is often a strong fit for solar when it has a large roof, steady power use, and heavy common-area loads. Put simply, the more usable roof space and the more predictable the electricity demand, the better the case can look. Those factors can help cut energy bills and support property value.
As Nolen Masserman, Managing Director at Oakside, notes, owners should also weigh the site layout, energy needs, upfront capital costs, and whether project milestones line up with key federal deadlines and incentives such as the Section 48E credit.
What can reduce actual savings from a solar project?
The biggest threat to projected savings is simple: missing the rules on compliance and paperwork. If certified payroll records, apprenticeship logs, or equipment sourcing certifications are incomplete or missing, the investment tax credit can drop from 30% to 6%.
As Nolen Masserman, Managing Director at Oakside, notes, precise cost allocation and full IRS compliance are needed to reach the project’s modeled financial impact.
What documents do buyers and lenders want to see?
Buyers and lenders usually ask for records that show a facility’s financial health and physical condition.
That often includes:
- Three years of profit and loss statements, tax returns, balance sheets, and debt schedules
- Current and 24-month rent rolls, unit mix summaries, delinquency and accounts receivable aging reports, and lien sale logs
- Phase I ESA, certificates of occupancy, ADA audits, zoning verification, property condition assessments, vendor contracts, and 12 months of utility bills