If I were preparing a climate-control storage property for sale or refinance, I’d focus on three numbers first: collected revenue per occupied unit, fee income share, and the rent premium over non-climate units. Those metrics show what the property is actually earning, not what it could earn on paper.
Here’s the short version: I’d separate rent from fees, reconcile the rent roll to the P&L and T-12, remove one-time items, and compare results by subtype. The article’s benchmark ranges point to $120 to $220 per occupied unit per month, 4% to 10% ancillary revenue, 86% to 95% occupancy, and a 15% to 50% climate-control rent premium, depending on the asset type.
What I’d watch right away:
- Use collected revenue, not billed revenue or street rates
- Track physical and economic occupancy together
- Split fee income by type: admin, late, tenant protection, and retail
- Normalize promos, bad debt, and one-time income
- Show climate-control results by subtype, not just one blended property average
A few figures stand out:
- Climate-controlled space averaged $1.66 per square foot vs. $1.31 for non-climate space
- Climate-control units often get a 20% to 40% per-square-foot premium
- Tenant protection plans often land around 5% to 8% of total revenue
- If economic occupancy is below 85%, buyers often underwrite lease-up instead of in-place income
Quick Comparison
| Asset Type | Revenue per Occupied Unit | Occupancy | Ancillary Revenue | Rent Premium vs. Non-Climate |
|---|---|---|---|---|
| Interior multi-story | $150–$220/month | 90%–95% | 7%–10% | 30%–50% |
| Single-story climate-control | $120–$180/month | 88%–93% | 4%–7% | 20%–35% |
| Mixed facility (climate slice) | $130–$190/month | 86%–92% | 5%–8% | 15%–30% |
That’s the core of the article: clean the revenue using pricing strategies, test the fee mix, adjust for one-time noise, and present climate-control income in the same format buyers use to underwrite.
sbb-itb-09b4138
Key climate-control revenue benchmarks to track
Track three metrics: revenue per occupied climate-control unit, fee income as a share of total revenue, and climate-control penetration with rent premium. Together, they show pricing power and the quality of income before any underwriting adjustment. You can pull all three from the rent roll, trailing 12-month financials, and occupancy reports.
Revenue per occupied climate-control unit
This metric answers a simple question: how much income does each occupied climate-control unit actually bring in?
The formula is straightforward. Divide collected climate-control revenue for the period by the average number of occupied climate-control units during that same period. For a trailing 12-month view, use the full year’s collected revenue and divide it by the average occupied unit count across all 12 months.
Use achieved rent, not street rate. Why? Because concessions chip away at collected income. If you present street-rate figures, expect buyers or lenders to trim them during due diligence. It also helps to track revenue per available unit and rent per occupied square foot as backup metrics.
Once you know what the units are earning, the next step is to look at whether the extra income is steady or all over the map.
Fee income as a share of total revenue
Don’t just track total fee income. Track the mix.
Fee income usually falls into four buckets:
- Administrative or setup fees
- Late fees
- Tenant protection plan or insurance income
- Retail sales like locks and packing supplies
Industry data show that rental income makes up roughly 85–90% of total property revenue, with protection plans adding 5–8%, late and admin fees 2–4%, and retail around 1–2%.
For underwriting, the mix and consistency matter more than the raw total. Protection-plan income and admin fees tend to be recurring and program-based. Late fees are different. If they run too high, they can point to tenant quality problems. Auction or processing fees can swing a lot, so lenders often discount them.
A property where protection-plan income holds a steady share, and late fees stay present but modest, is much easier to defend than one where fee categories jump around from year to year.
That fee picture also needs to be read next to the property’s climate-control share and its pricing spread.
Climate-control penetration and rent premium
Climate-control penetration is the share of total units or rentable square footage that is climate-controlled. You need this number when comparing assets. Two properties can post similar ancillary revenue and still benchmark very differently if one has far more climate-controlled space than the other.
Rent premium is the dollar or percentage lift between achieved climate-control rent and achieved non-climate rent for similar unit sizes. Nationally, climate-controlled units carry a 20%–40% per-square-foot premium over standard space.
But a premium number by itself doesn’t tell the full story. If climate units sit at lower occupancy, or if heavy concessions eat into the effective rate, the premium can look strong on paper and weak in practice. Read it alongside occupancy trends, concession levels, and average tenancy duration to judge whether the pricing holds up.
| Metric | Measures | Underwriting note |
|---|---|---|
| Revenue per occupied climate-control unit | Achieved income per rented unit | Use collected revenue, not street rate |
| Fee income as % of total revenue | Ancillary income durability | Consistency of mix matters more than total size |
| Climate-control penetration | Share of space or units that are climate-controlled | Must be accounted for when comparing across properties |
| Rent premium vs. non-climate units | Pricing uplift for climate space | Evaluate alongside occupancy and concessions to assess comparability |
Use these benchmarks as the starting point before reconciling line items and making underwriting adjustments. These steps are critical when planning a property exit to ensure you capture the full value of the asset.
Revenue integrity checks and underwriting adjustments
Once the benchmarks are in place, the next step is simple: make sure the income holds up under diligence. The benchmarks above only mean anything after the revenue ties out.
That means the rent roll, monthly P&L, and T-12 should all show the same climate-control income, fees, and retail sales. Rent, concessions, late fees, admin or move-in fees, protection-plan income, and retail sales should match across all three reports.
Line-item consistency across financials and rent roll
Start with a three-way reconciliation of physical occupancy, economic occupancy, and collected cash. When those numbers drift apart, the gap usually points to concessions, delinquency, or coding mistakes.
If physical occupancy is high but economic occupancy is lower, the usual issue is heavy concessions, intro discounts, or in-place rents that still lag street rates. If economic occupancy looks fine but collected revenue comes in light, that usually points to delinquency or bad debt. In that case, pull the aging report for climate-control units and check whether a certain unit size or tenant group is behind the shortfall.
Coding mistakes tend to show up as odd swings in one fee line or income posted to the wrong GL account. A monthly variance report by GL account helps a lot here. If a line moves 5% to 10% with no plain operating reason, it deserves a closer look.
Only after the reports reconcile should income be normalized for underwriting.
How to normalize income for underwriting
Once reconciliation is done, strip out nonrecurring income. One-time marketing reimbursements, large bulk rentals, and promo-driven distortions should be removed from the stabilized income figure. They should not set the tone for underwriting.
Promotions should be converted to a full-term effective rate, not a promo-period rate. Along the same lines, if the trailing 12 months include a delinquency spike tied to a one-time disruption, use multi-year bad-debt averages instead of letting that outlier drive the model.
Build stabilized underwriting from gross potential rent. Then deduct concessions, economic vacancy, and normalized bad debt to reach collected income. From there, apply fee income ratios that match historical performance and peer benchmarks. For facilities with active tenant protection programs, that usually lands around 8% to 10% of total revenue.
Physical occupancy is a lease-up signal. economic occupancy is what drives property value. If economic occupancy is below 85%, buyers will usually underwrite to stabilized NOI and apply a lease-up discount.
Benchmark review table: current versus underwritten metrics
The table below shows how current performance can translate into underwritten value. Any offering materials should also include notes on the main adjustments – concession burn-off, protection-plan normalization, and delinquency smoothing – so buyers can follow the logic without guessing.
| Metric | Current Actual | Underwritten Stabilized | Key Adjustment |
|---|---|---|---|
| Achieved rent per occupied climate-control unit | $145/month | $155/month | Remove introductory discounts; align to market comps |
| Rent per occupied sq ft | $1.90/sq ft | $2.05/sq ft | Rate normalization and mix optimization |
| Fee income as % of total revenue | 6.0% | 8.0% to 9.0% | Normalize tenant protection penetration to peer benchmarks |
| Physical occupancy | 88% | 93% | Stabilized assumption based on market demand |
| Economic occupancy | 82% | 90% to 92% | Remove concession drag; normalize bad debt to multi-year average |
The space between current and underwritten figures is where the case gets made. A facility at 82% economic occupancy with a 6% fee income ratio may have upside, but the adjustments need to be easy to defend.
Subtype comparisons for sale preparation
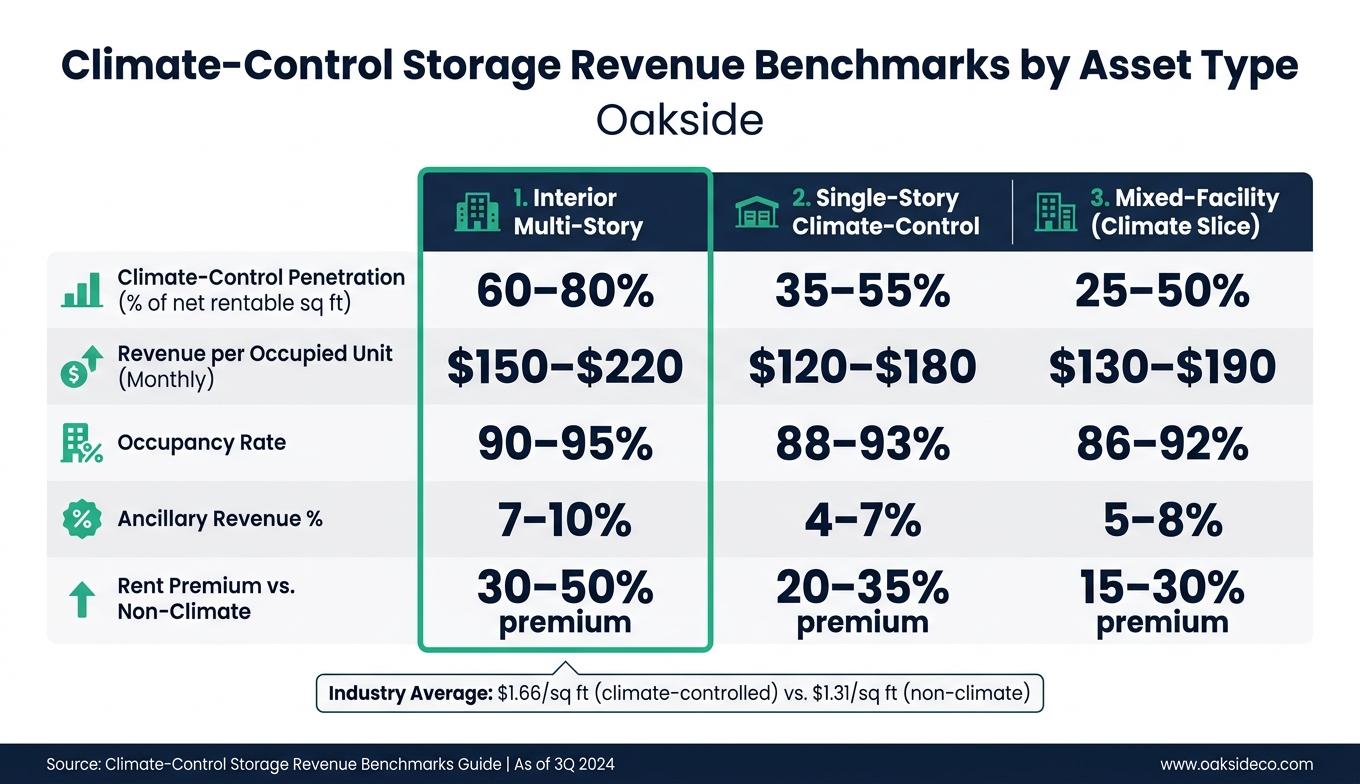
Climate-Control Storage Revenue Benchmarks by Asset Type
Once revenue is normalized, show it by subtype so buyers can test the deal against market ranges. For a climate-control asset, that means breaking out results by unit mix instead of leaning on one facility-wide average. Buyers underwrite by unit type, not by a blended property number.
Comparing revenue across interior, single-story, and mixed-facility climate-control assets
Each climate-control setup performs a little differently, and that changes how buyers look at cash flow staying power and room for growth.
Interior multi-story facilities often bring in extra income from tenant insurance, admin fees, and retail. That piece often lands at 7–10% of climate-control revenue. Rent per occupied square foot usually sits in the $1.40–$2.00 per square foot per month range, though some coastal assets top $3.00 per square foot. Stabilized occupancy of 92–95% is common, and buyers often see this subtype as the steadiest cash-flow play.
Single-story climate-control assets, whether corridor-based or drive-up, tend to post ancillary revenue around 4–7% of climate-control revenue. The rent premium usually runs 1.25x–1.40x above non-climate rates in the same trade area. Occupancy can still be strong, but it reacts more to local supply and often settles in the 88–93% range.
Mixed-facility assets need the most care in how they’re shown. Climate-control and non-climate units should be reported on their own, because blended averages can hide strong climate-control results behind weaker drive-up inventory. Buyers will isolate the climate-control slice and review rent premium consistency and ancillary capture by unit type.
How to present benchmark ranges in offering materials
Use the ranges below to help buyers size up the asset fast.
| Subtype | Climate-Control Penetration (% of net rentable square feet) | Revenue per Occupied Unit (Monthly) | Occupancy | Ancillary Revenue % | Rent Premium vs. Non-Climate |
|---|---|---|---|---|---|
| Interior multi-story | 60–80% | $150–$220 | 90–95% | 7–10% | 30–50% premium |
| Single-story climate-control | 35–55% | $120–$180 | 88–93% | 4–7% | 20–35% premium |
| Mixed-facility (climate slice) | 25–50% | $130–$190 | 86–92% | 5–8% | 15–30% premium |
Put current figures and underwritten figures side by side. Also make sure revenue is defined the same way across every subtype, whether that’s in-place, street, or effective rent.
Position the asset with Oakside Co
For disposition packages, the numbers need to be laid out in the same unit-level format buyers use in underwriting. Oakside Co helps owners build unit-level revenue schedules and normalized underwriting packages for climate-control dispositions.
Conclusion: The benchmarks that matter most
Revenue per occupied unit and fee income share are the main benchmarks to watch. Use them together, and split recurring fees from variable fees like late charges and NSF fees. But those numbers only help if the income actually ties out.
When rent roll categories line up with P&L lines, and miscellaneous income gets reclassified, buyers can reconcile the numbers faster. That cuts down retrade risk. Performing a sensitivity analysis during this phase further protects equity against shifting market conditions.
Once those lines reconcile, normalize the income before underwriting. Normalization connects trailing actuals to underwritten figures by removing one-time items and smoothing concessions. As of 3Q 2024, climate-controlled units averaged $1.66 per square foot versus $1.31 for non-climate space.
After that, compare the asset against subtype peers. Show subtype-specific results for interior multi-story, single-story, and mixed-facility properties, because buyers underwrite the slice, not the blend. That’s what helps position the asset clearly in disposition materials.
FAQs
How do I calculate collected revenue per occupied unit?
Calculate it based on actual cash flow, not just posted rent: subtract concessions, promos, and other deductions from the rent collected on occupied units.
That gives you a clearer picture of true revenue than base rental rates alone. It also shows how unit mix and occupancy shape total net operating income.
What fee income is healthy for climate-control storage?
For professionally managed climate-control storage facilities, ancillary revenue usually accounts for 4% to 7% of total income. That bucket often includes tenant insurance, late fees, administrative fees, and retail sales.
As Nolen Masserman, Managing Director at Oakside, notes, owners should benchmark these fees based on how much they add to stabilized NOI, not just gross revenue or facility size.
When should I separate climate-control results by subtype?
Separate climate-controlled results by subtype when you need to spot revenue leaks, improve rate-setting, or plan capital needs with care.
When you lump occupancy and performance data together, the differences between unit types can disappear. That can blur the picture.
Looking at each subtype on its own helps you see which categories are losing tenants at a faster clip. It also helps you find revenue opportunities through metrics like RevPAF.