


More moves can mean more storage rentals - but I check facility results before changing prices or forecasts. I start with a 5-, 10-, or 15-minute drive-time area, compare the latest complete month with the same month last year, and test whether housing activity leads to rentals 1–3 months later.
I track six local signals:
- Closed existing-home sales: Completed sales that may create moving or housing-gap needs.
- Median days on market: How long homes take to go under contract.
- Active and new listings: Homes available now and possible moves ahead.
- Renter move-outs: Completed departures, with notices tracked separately.
- Apartment lease turnover: Departures relative to occupied units - not a separate demand pool from move-outs.
- Population inflow: Arriving households, checked separately from net population change.
My rule: <u>housing data points to possible demand; facility data checks whether it becomes rentals.</u> I compare these signals with inquiries, move-ins, occupancy, rents, unit sizes, and length of stay. I also check nearby storage supply and nonmoving needs, such as renovations or limited space, before adjusting monthly plans or quarterly investment forecasts.
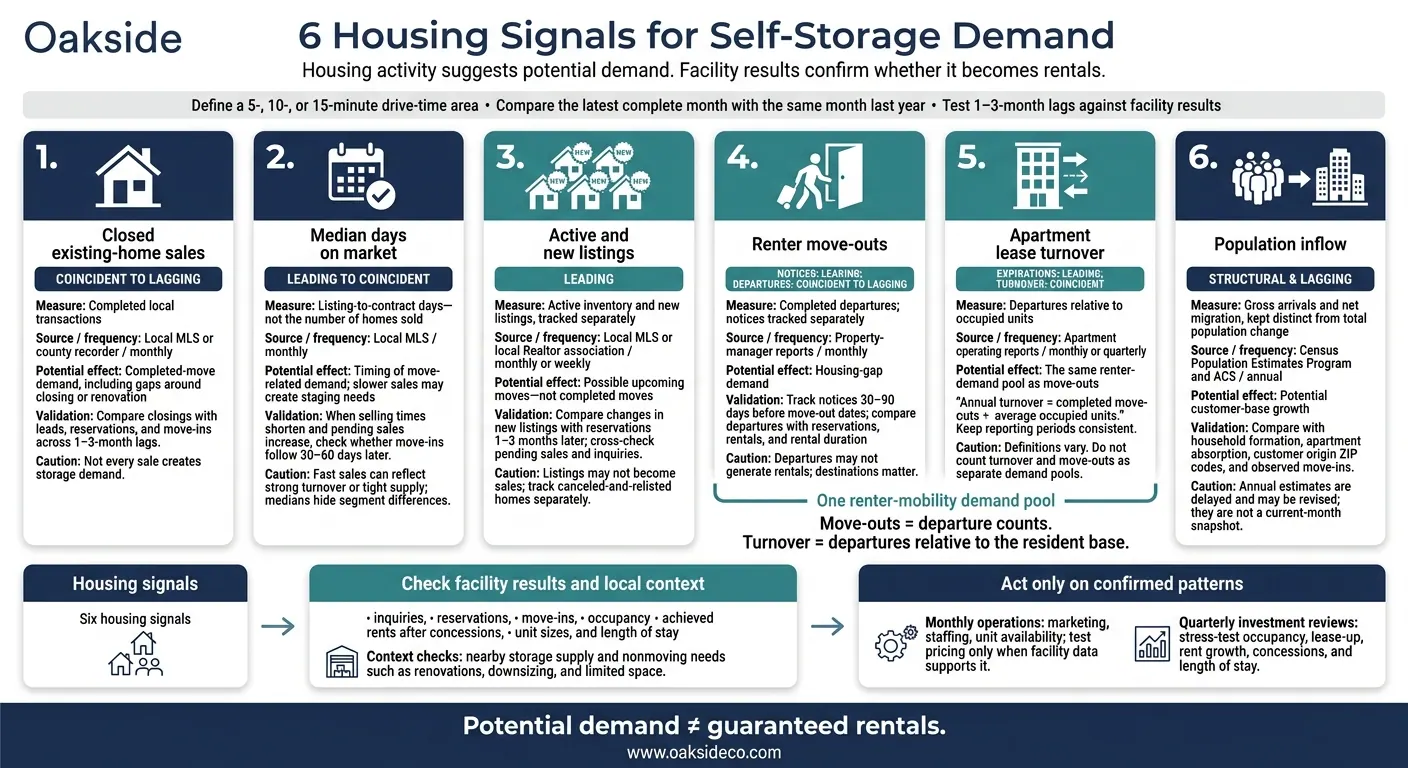
6 Housing Signals for Self-Storage Demand
Before evaluating housing signals, define the facility’s trade area using 5-, 10-, and 15-minute drive-time boundaries. Use 1-, 3-, and 5-mile rings only as a cross-check. Account for bridges, highways, congestion, and other access barriers. Record the facility address, mapping date, and travel-time assumptions.
Overlay the boundary with nearby ZIP codes, census tracts, and apartment submarkets. Choose the smallest geography that reliably matches the trade area. For partial overlaps, weight estimates by households, area, or road access within the boundary, and label the allocation method. Don’t count an entire county’s activity when only part of it is accessible to the facility.
Keep signals separate by timing. New listings can precede household moves. Closed sales, renter move-outs, and apartment turnover generally reflect current activity. Annual population estimates lag but help confirm longer-term trends. Track move activity separately from net population change.
For each review, record every source’s reporting period and data type, including whether figures are preliminary or final. Use the latest released complete period, and leave partial-month activity out of full-month comparisons. Census Bureau ACS 1-year estimates cover 12 months; ACS 5-year estimates combine 60 months. Neither is a current-month snapshot.
Compare the latest complete month with the same month a year earlier. Report counts and percentage changes, and state whether the figures are seasonally adjusted. Flag storms, local shocks, or seasonal drops that distort the benchmark.
With geography and timing defined, closed sales provide the first firm measure of completed turnover.
Why Closed Sales Matter
Closed existing-home sales measure completed turnover. They often create short-term storage demand as people pack, bridge gaps around closing, or renovate. Pending sales can signal future closings, but they’re less reliable than completed sales. Local closing counts are more useful than contract activity alone.
Local Metrics and Data Sources
Get closing dates, addresses, property type, price, and cash or financed status from MLS reports or county records. Compare monthly volume with the same month last year, then compare the trailing 12-month total with the prior 12 months. Break down those counts by ZIP code, price tier, property type, season, and financing status.
Use actual local transaction counts. NAR’s national existing-home-sales series is a seasonally adjusted annual rate - not a monthly closing count.
Demand Timing and Facility Decisions
Once you’re tracking closings, test whether they precede storage move-ins. Compare closing counts with the facility’s leads, reservations, and move-ins across 1- to 3-month lags.
If sustained sales growth lines up with more inquiries, keep inventory available in commonly requested sizes, such as 5-by-10-foot and 10-by-10-foot units. Focus move-related marketing on the ZIP codes generating those leads. For investment reviews, use the facility’s historical relationship between turnover and rentals. This analysis is a core part of a broader self-storage operations strategy. Don’t assume every sale creates a storage customer.
Limits and Cross-Checks
Investor purchases, second homes, and moves into larger homes may create little storage demand. Cash status alone doesn’t tell you why someone bought a property.
Even when sales weaken, renovations, estates, downsizing, and limited household space can still drive rentals. Check tenants’ rental reasons, length of stay, move-outs, occupancy, and achieved rents before using sales changes to forecast revenue.
Connection to Moves and Storage Use
Closed sales measure completed turnover. Median days on market shows how fast homes move toward a sale. It measures how long a home takes to go under contract - not how many homes sell. Use the listing-to-contract period. Faster contracts give households less time to pack and arrange storage, while slower sales may point to storage needs tied to staging.
Local Metrics and Data Sources
Use the same local definition across every market you compare. Compare the latest complete month with the same month a year earlier, then benchmark trade-area results against county and metro figures.
Separate detached homes, condos, townhomes, and price bands so a fast-selling segment doesn't hide slower ones. Selling speed affects when storage demand appears.
Demand Timing and Facility Decisions
When selling times shorten and pending sales increase, check whether facility move-ins follow 30 to 60 days later. If facility records confirm that pattern, time move-related marketing, staff coverage, and larger-unit availability around the expected full-house moves. When selling times lengthen, focus messaging on storage for staging.
Limits and Cross-Checks
Treat faster selling speed as an early signal, not proof of storage demand. Fast sales can reflect either strong turnover or tight supply. Check pending sales and new listings to separate increased move activity from scarce inventory. Verify actual facility move-ins before increasing demand forecasts.
After closed sales and days on market, listing counts help show whether turnover is picking up or stalling.
Connection to Moves and Storage Use
New listings count homes entering the market; active inventory counts homes still available for sale. New listings point to possible upcoming moves, while active inventory shows what hasn’t sold. Neither confirms a completed move.
Local Metrics and Data Sources
Build a monthly scorecard for the facility’s drive-time area using local MLS or Realtor association data. Include new and active listings, pending sales, cancellations or withdrawals, relistings, price reductions, and months of supply.
Demand Timing and Facility Decisions
Use months of supply to gauge how quickly inventory is clearing. When new listings, pending sales, and inquiries increase together, test targeted ads, reservation capacity, or unit-size pricing strategies. If inventory grows while sales and inquiries stay flat, watch another one or two reporting cycles before expecting immediate rent-up.
Limits and Cross-Checks
Separate actual turnover from listing noise. Compare counts with the same month last year, and track canceled-and-relisted homes separately so repeat listings don’t inflate activity.
Keep distressed listings and new construction separate from conventional resales. They follow different timelines, and new homes may not appear in MLS totals. Track permits, starts, units under construction, and completions separately. Stalled listings and new construction don’t automatically lead to storage move-ins.
Connection to Moves and Storage Use
Completed move-outs show turnover. Notices to vacate point to possible storage demand before renters leave.
Local Metrics and Data Sources
Ask property managers and apartment operators for 12–24 months of monthly data covering completed move-outs, notices to vacate, lease expirations, household size, and the apartment unit types renters are leaving.
Calculate annual turnover by dividing completed move-outs by average occupied units. Keep notices separate: they represent expected departures, not completed moves. Use Census American Community Survey table B07013 to check broader renter mobility patterns.
Demand Timing and Facility Decisions
Renter departures are the apartment-side counterpart to home-sale turnover. Track notices 30–90 days before move-out dates and map clusters of lease expirations. Compare that schedule with reservations, inquiries, occupancy, and available storage units before adjusting apartment-targeted ads or staffing.
Renters leaving studios and one-bedroom apartments may need 5-by-5-foot or 5-by-10-foot units. Larger households may need 10-by-10-foot units or more space.
Limits and Cross-Checks
Track where renters are going. Ask managers for grouped destination categories, not details that identify tenants. For both notices and completed move-outs, look for local moves involving lease gaps, downsizing, or temporary housing - situations that may leave renters needing storage between homes. Interstate departures may generate only short-term storage at the origin.
Keep scheduled lease expirations, early terminations, evictions, and transfers separate. Then compare completed departures - not notices alone - with inquiries, reservations, completed rentals, and rental duration. Track move-outs first, then test whether they translate into storage reservations and move-ins.
Apartment lease churn gives you a property-level view of renter mobility.
Connection to Moves and Storage Use
Lease turnover tracks how often renters renew or leave. Those departures can lead to short-term storage demand.
Local Metrics and Data Sources
Track renewals, non-renewals, lease expirations, and move-outs by submarket and rent tier. Also break down churn by apartment unit type to estimate which storage unit sizes renters may need.
Demand Timing and Facility Decisions
Use lease churn to check whether renter mobility is increasing or easing before updating move-related forecasts. Compare lease expiration dates with non-renewals to anticipate when renters may move into storage.
Limits and Cross-Checks
Pair lease churn with population inflow to check whether new residents are replacing departing renters. Renter movement doesn't guarantee storage demand. Check inquiries, reservations, and storage move-ins before changing forecasts.
The final local signal is population inflow: are new households replacing those that leave?
Connection to Moves and Storage Use
New households entering the trade area may need storage between arriving and moving into their homes. Separate net migration from total population change. Gross arrivals and departures reveal more moving activity than net migration alone.
Local Metrics and Data Sources
Use five-year ACS estimates at the tract or ZIP Code Tabulation Area level to find nearby neighborhoods gaining residents within the trade area. Use ACS migration flows to check where residents came from, then compare with county-level domestic and international migration data from the Census Population Estimates Program. Check geographic boundaries and reporting periods before combining datasets.
Demand Timing and Facility Decisions
Connect arrivals to new household formation, apartment absorption, and housing searches. Also review employer hiring and relocations as reasons people move. Arrivals from higher-cost markets may rent temporarily, but check their housing choices rather than assuming they need storage. Track domestic and international arrivals separately, since shared or employer-provided housing can delay storage demand.
Each month, compare these signals with customer origin ZIP codes, inquiries, and facility move-ins. Rising apartment absorption alongside arrivals can support targeted marketing or higher pricing. But increase revenue forecasts only after move-ins and occupancy confirm the trend. Treat inflow as a check on your forecast, not a forecast on its own.
Limits and Cross-Checks
Compare inflow with local storage supply. People who move directly into larger homes or shared housing may have less need for storage. ACS migration flows lag by a year; they show prior residence, not current arrivals. Match each dataset’s measurement period to facility performance. Use inflow in underwriting and sensitivity analysis only when it lines up with household growth, storage supply, and observed move-ins.
Use the table below to compare each signal’s source, reporting lag, and expected effect on demand.
| Signal | Metric | Data source | Update frequency | Timing | Demand effect | Main limitation |
|---|---|---|---|---|---|---|
| Closed existing-home sales | Closed transactions | Local MLS or county recorder | Monthly | Coincident to lagging | Completed-move demand | Not every sale creates storage demand |
| Median days on market | Listing-to-contract days | Local MLS | Monthly | Leading to coincident | Timing of move-related demand | Medians hide segment differences |
| Active and new listings | Inventory and new listings, tracked separately | Local MLS or local Realtor association | Monthly or weekly | Leading | Potential move-related demand | Listings may not become sales |
| Renter move-outs | Completed departures; notices tracked separately | Property-manager reports | Monthly | Notices: leading; departures: coincident to lagging | Housing-gap demand | Departures may not generate rentals |
| Apartment lease turnover | Departures relative to occupied units | Apartment operating reports | Monthly or quarterly | Expirations: leading; turnover: coincident | Same demand pool as move-outs | Definitions vary |
| Population inflow | Gross arrivals and net migration | Census Population Estimates Program and ACS | Annual | Structural and lagging | Potential customer-base growth | Delayed estimates that may be revised |
Move-outs and turnover are not interchangeable. Move-outs count departures; turnover measures departures relative to the resident base. Use counts to track departures and rates to compare apartment properties. Keep the numerator, denominator, and reporting period consistent - and do not count these measures as separate demand pools.
For migration data, annual describes the measurement period, not the release date.
Compare changes in new listings with reservations 1 to 3 months later. Then check whether closed sales line up with move-ins. This helps identify which signals need a closer look in facility-level underwriting.
Once you’ve identified the signals, check whether they show up in facility performance. Build a one-page dashboard that records each signal’s direction, timing, geography, segment, and operating impact, along with its source date, method, and confidence level. Connect the six signals to move-ins, occupancy, rents, unit mix, and length of stay.
Give completed moves and facility leases priority. Use customer ZIP codes to confirm which signals lead to rentals in your trade area - and which unit sizes customers need. Check those findings against reservations, concessions, move-out reasons, and nearby supply.
In monthly operating reviews, use confirmed changes to adjust marketing, staffing, and unit availability. Housing activity alone isn’t a reason to increase rents. Check achieved move-in rents after concessions, inquiry-to-rental conversion, delinquency, and early move-outs. Test pricing by unit type only when facility data supports it. If conversion weakens, stop or adjust the test.
For quarterly investment reviews covering acquisitions, valuations, and dispositions, stress-test occupancy, lease-up, rent growth, concessions, and length of stay under base, stronger-turnover, and weaker-turnover cases. When reviewing dispositions, separate sustained demand from gains driven by seasonality, concessions, or limited availability. Don’t change underwriting based on one active month.
Oakside Co provides transaction support and data-driven analysis to help investors interpret these signals in acquisitions and dispositions. It is not a demand signal.
Housing signals point to potential demand - not guaranteed rentals. Pair them with property data: occupancy, rents, move-ins, customer origins, and planned storage deliveries, and the risk of a self-storage market crash.
Slower turnover doesn’t mean storage demand disappears. Renovations, downsizing, remote work, household formation, and limited space can drive rentals even without a home sale.
If turnover slows while occupancy holds steady, use facility records to separate short-term, move-related demand from longer-term demand for extra space.
How can I tell whether housing turnover actually drives my rentals?
Compare your facility’s move-ins, move-outs, net rentals, and tenant churn with local home sales volume, days on market, and apartment lease churn. Look for rental activity that follows shifts in these housing indicators.
When housing activity increases, high occupancy and firming street rates point to turnover-driven demand. Heavy discounting, on the other hand, may suggest weaker demand.
Check occupancy and lease-up against local absorption and population inflow. Use data from within a three-mile radius, not regional averages.
Which signals should I trust when local trends conflict?
When local trends point in different directions, compare occupancy, street rates, and move-in pace instead of relying on a single metric.
Give hyper-local, facility-level data more weight than regional or national averages. Watch for patterns that persist: street rates staying below prior-year peaks, heavy discounts during peak leasing months, or move-in volume that doesn’t bounce back in spring and summer. These signals help separate structural demand weakness from normal seasonal ups and downs.
How can I forecast demand with limited facility history?
When facility history is limited, start with hyper-local indicators and verified third-party data. Set a 3-mile trade area, then review population density, household formation rates, and income levels.
Check building permits and planned development to assess whether the market could become saturated. Nearby facilities’ occupancy rates, achieved rents, and lease-up speeds can serve as demand proxies. Track web inquiries, reservations, and call traffic to gauge how much demand the market can absorb right now.