
I’d set your 2026 occupancy target using nearby properties - not a national average. Q2 2026 same-store results for three large U.S. REITs showed 90.4% average occupancy, but that figure isn’t a target for every facility. Compare properties with similar locations, unit mixes, and stages of lease-up.
Here’s what I’d check before using a benchmark:
- Match the numbers: Separate unit, square-foot, and economic occupancy. Use the same reporting periods and inventory rules.
- Check local conditions: Review demand, competing supply, property features, and leasing pace.
- Look beyond leased units: Track collected rent, concessions, delinquency, and revenue per available square foot.
- Test the cash flow: Build downside, base, and upside cases to see how occupancy affects NOI and value.
- Keep monthly records: Use a dashboard and dated rent rolls to guide pricing, spending, and sale planning.
As of October 8, 2026, I’d keep reported results separate from year-end forecasts. The goal is <u>income that holds up</u> - not just a higher occupancy percentage.
National Occupancy Figures and Data Limits
National figures offer context - not a single industry occupancy rate. Don’t combine results from different samples. These benchmarks are comparison points, not universal targets, and the supplied sources do not establish a national series for stabilized properties.
| Source | Reporting basis | Measurement period | Property sample | Occupancy metric | Verified figure | Limitations |
|---|---|---|---|---|---|---|
| Yardi Matrix National Self Storage Report | Market research; development inventory | December 2025 | 2,883 properties in various stages of development | National occupancy | No operating occupancy figure | Development inventory is not an operating-occupancy sample. |
| First-quarter REIT report | Same-store REIT results | Q1 2026 | Five publicly traded REITs; property count not reported | Average / quarter-end same-store occupancy | 89.0% / 89.3% | Portfolio mix, weighting, and unit-versus-square-foot basis unspecified. |
| Second-quarter REIT report | Same-store REIT results | Q2 2026 | Three largest U.S.-based REITs; property count not reported | Average / quarter-end same-store occupancy | 90.4% / 91.0% | Different sample from Q1; calculation method unspecified. |
| Global Self Storage disclosure | Company same-store results | June 30, 2026 | 12 properties | Period-end same-store occupancy | 94.7% | Small portfolio; not national. |
Set property targets using local supply, demand, and asset features. Before applying a benchmark, check how the source calculates occupancy and which properties qualify for its same-store sample. Keep forecasts clearly separate from observed results.
Occupancy Targets by Property Profile
These categories overlap. Where the sources don’t support a property-level range, use local evidence rather than forcing a national benchmark onto the asset.
| Property profile | Metric | Target basis | Interpretation | Supporting measures |
|---|---|---|---|---|
| New facility | Occupancy and absorption by unit type | Staged lease-up milestones; no universal range | Initial vacancy reflects inventory entering service | Achieved rents, concessions, marketing cost, deliveries |
| Lease-up property | Net absorption; unit and square-foot occupancy | Monthly or quarterly absorption milestones | Leasing pace matters more than a stabilized comparison | Move-ins, move-outs, remaining inventory |
| Stabilized conventional facility | Square-foot and economic occupancy | Local stabilized comparables and property history | National REIT results offer context, not a prescribed range | Achieved rent, retention, delinquency, NOI margin |
| Institutional portfolio | Consistently weighted same-store occupancy | Own history and comparable disclosures | Portfolio averages can hide weak assets | Asset-level variation, revenue growth, NOI |
| Supply-constrained submarket | Occupancy by unit type | Local history, waitlists, and documented supply constraints | High occupancy without rent growth may signal underpricing | Waitlists, available inventory, retention, supply pipeline |
| Boat and RV storage | Space occupancy by product type | Local and historical benchmarks by outdoor, covered, and enclosed format | Conventional-storage targets do not apply to every property | Seasonal utilization, achieved rent per space, churn, costs |
Local Demand, Supply, and Property Features
Start with metropolitan statistical area (MSA) conditions, then narrow the benchmark to the immediate trade area. Use a consistent three- to five-mile radius or defined drive-time area. Review population, household formation, migration, housing turnover, employment, and small-business use. Growth alone won’t support higher occupancy if new deliveries outpace absorption.
Measure supply separately. Track existing rentable square feet per capita, unit counts, construction, proposed deliveries, expected opening dates, and zoning limits. For boat and RV storage, also count spaces by outdoor, covered, and enclosed format. Square footage alone doesn’t account for parking layout, depth, or access limits.
Check the target against the property’s history and features, including access, visibility, security, climate control, unit mix, pricing, and concessions. Review achieved rents and retention by category - not just blended occupancy. For vehicle storage, factor in seasonal demand and each format’s costs before treating full spaces as evidence of strong returns.
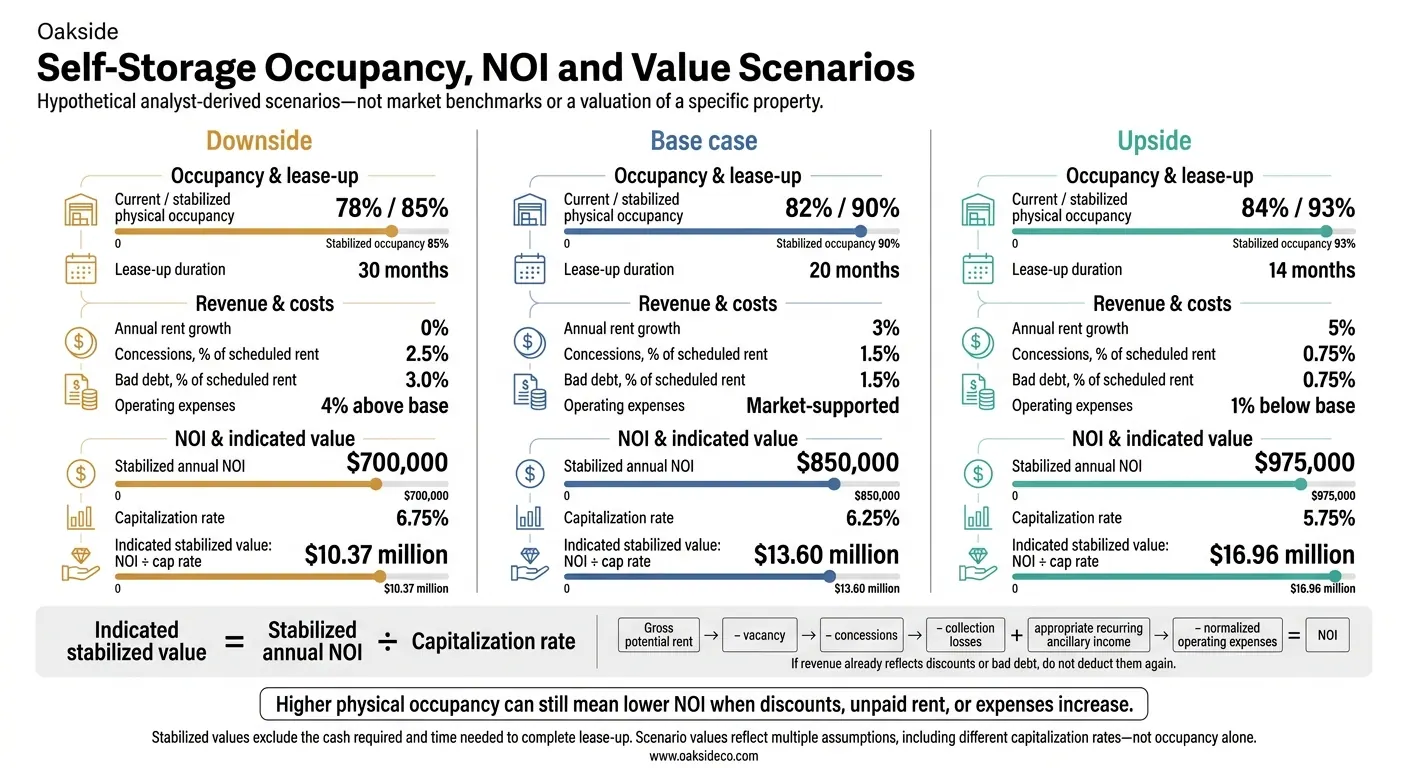
Self-Storage Occupancy, NOI and Value Scenarios
Pricing, Leasing, and Property Improvements
Use the local benchmark to test pricing and leasing decisions. Manage revenue by unit type, not just total occupancy. Compare asking rents, renewals, effective rent, retention, delinquency, and collections. Track revenue per available square foot (RevPAF) with a consistent definition of revenue.
Check whether closing the local occupancy gap also improves pricing, retention, and RevPAF. If occupancy climbs but RevPAF drops, discounts are buying occupancy. Use collections, retention, and leasing volume to assess marketing spend and manager performance.
Tie capital spending to a documented constraint, such as access problems or demand for climate-controlled space. Before approving a project, estimate the added occupied square feet, effective rent, added operating costs, construction downtime, and payback.
Lease-Up, NOI, and Valuation Scenarios
For acquisitions and financing, turn occupancy figures into cash-flow estimates. Reconcile trailing-12-month results with current rent rolls and collections. Separate physical occupancy from economic occupancy, and check whether recent gains rely on promotions.
Build downside, base, and upside cases rather than relying on a single occupancy target. Label inputs historical, market-supported, or analyst-derived so lenders and buyers can assess the basis for projected cash flow.
The figures below are hypothetical analyst-derived scenarios, not market benchmarks or a valuation of a specific property.
Assumption Downside Base case Upside Current / stabilized physical occupancy 78% / 85% 82% / 90% 84% / 93% Lease-up duration 30 months 20 months 14 months Annual rent growth 0% 3% 5% Concessions, % of scheduled rent 2.5% 1.5% 0.75% Bad debt, % of scheduled rent 3.0% 1.5% 0.75% Operating expenses 4% above base Market-supported 1% below base Stabilized annual NOI $700,000 $850,000 $975,000 Capitalization rate 6.75% 6.25% 5.75% Indicated stabilized value: NOI ÷ cap rate $10.37 million $13.60 million $16.96 million
Build NOI from collected revenue, not scheduled rent. Deduct vacancy from gross potential rent, then subtract concessions and collection losses once. Add appropriate recurring ancillary income and subtract normalized operating expenses. If revenue already reflects discounts or bad debt, don't deduct them again.
Higher physical occupancy can still mean lower NOI when discounts, unpaid rent, or expenses increase. The table’s stabilized values also exclude the cash required and time needed to complete lease-up.
Occupancy Records for a Property Sale
When a sale is likely, organize occupancy records so buyers can check performance without delay. Prepare monthly occupancy history, dated rent rolls, concession records, collections, unit-level availability, and local supply evidence.
Reconcile management reports with deposit records, delinquency records, access records, and lien-sale records so buyers can test reported performance. Oakside Co supports disposition planning with analysis and transaction management.
Once you have the right benchmark, turn it into a monthly operating scorecard.
Set Reporting Standards and Check Sources
Use the occupancy formulas above. Record the reporting basis, cutoff date, and inventory changes in a metric dictionary so each month follows the same rules. Compare each metric with the peer set used to establish the benchmark.
Document the GPR basis and how you handle concessions, discounts, delinquency, bad debt, tenant-protection fees, and other non-rent revenue. Keep dated snapshots so you can check past results.
Tag benchmarks by maturity, location, unit mix, climate control, vehicle-storage format, and operating model. Include the reporting period, sample, geography, denominator, and same-store status. Keep same-store reporting separate from property stabilization, and don’t combine their samples.
Within the trade area, track planned, permitted, under-construction, and delivered supply separately. Time-stamp availability checks: online listings may leave out units or trail current vacancies.
Track Occupancy, Revenue, and Leasing Metrics
Use the dashboard below as a reporting template, not a set of targets. It covers occupancy, revenue, and leasing measures. Dashes indicate property data not supplied; N/A means no comparable submarket figure is available.
Fill in the current and prior-year columns using dated records. Compare monthly results with the previous month and annual results with the same month last year. Keep nearby asking rents separate from achieved rents.
Use this table to turn benchmark research into property-level thresholds.
| Metric | Definition or unit | Current | Prior year | Monthly change | Year-over-year change | Submarket comparison | Target |
|---|---|---|---|---|---|---|---|
| Unit occupancy | Occupied ÷ rentable units; % | - | - | Percentage points | Percentage points | N/A | Range |
| Square-foot occupancy | Occupied ÷ rentable square feet; % | - | - | Percentage points | Percentage points | N/A | Range |
| Economic occupancy | Collected rental revenue ÷ GPR; % | - | - | Percentage points | Percentage points | N/A | Range |
| Occupancy by unit size | Separate size/type bands; % | - | - | Percentage points | Percentage points | N/A | Range per band |
| Revenue per available square foot (RevPAF) | Rental revenue ÷ rentable square feet; $/square foot/month | - | - | $ | % | N/A | Range |
| Effective rent | Collected or billed rent after applicable discounts and concessions; $/square foot/month | - | - | $ | % | N/A | Range |
| Net rentals | Move-ins minus move-outs; units/month | - | - | Units | Units | N/A | Monthly goal |
| Retention | Renewals ÷ eligible expirations; % | - | - | Percentage points | Percentage points | N/A | Range |
| Length of stay | Average or median tenant tenure; months | - | - | Months | Months | N/A | Range |
| Delinquency | Past-due ÷ billed rent; %, aged 30/60/90+ days | - | - | Percentage points | Percentage points | N/A | Ceiling |
| Bad debt | Uncollectible rent; $ and % of billed rent | - | - | $ / percentage points | $ / percentage points | N/A | Ceiling |
| Concessions | Free rent, discounts, and promotions; $ and % of GPR | - | - | $ / percentage points | $ / percentage points | N/A | Ceiling |
| Online availability | Advertised vacancies by size and type; units and % of inventory | - | - | Units | Units | N/A | Availability range |
| Nearby asking rents | Advertised rents for comparable units; $/unit or $/square foot | - | - | $ | % | N/A | Reference only |
| New supply | Planned, under-construction, and newly delivered competing space; square feet and units | - | - | Square feet / units | Square feet / units | N/A | Forecast input |
Set a minimum operating threshold, normal target range, and action threshold for each property. Tie lease-up targets to absorption and mature-property targets to revenue quality.
Update operating results monthly and review investment assumptions and cap rate projections at least quarterly. Keep old targets and document revisions when supply, demand, management, or unit mix changes.
Before changing a target, verify the data, record the event, and assign one owner to each follow-up action.
Set 2026 occupancy targets using comparable assets and matching time periods. Base your range on local demand and supply - not national averages.
Use the monthly dashboard to check whether physical and economic occupancy support lasting revenue and NOI.
Before committing capital or underwriting a sale, build downside, base, and upside scenarios. Compare the NOI and value each scenario produces, not just occupancy.
Your target should hold up under scrutiny and support property operations and sale planning. For a broader look at the asset class, see our self-storage guide. For property-specific benchmarking and transaction planning, contact Oakside Co.
How can I set occupancy targets with limited local data?
Pair economic occupancy - what you actually collect - with short-term trends and market signals. Review 24–36 months of monthly street rates, concessions, and move-in pace. Account for seasonality instead of annualizing the data.
For underwriting, aim for an achievable stabilized economic occupancy, often 88%–92%, and stress-test it at around 70%. Compare hyper-local demand with supply using net rentable square feet per capita. Also check the gap between physical and economic occupancy.
When should I raise rents instead of filling units?
Focus on increasing rents when physical occupancy exceeds 90%–95% and economic occupancy is strong. Economic occupancy reflects revenue collected after concessions and bad debt. Higher rents can increase net operating income and asset value.
If physical occupancy is high but economic occupancy is low, tackle discounts, operating efficiency, and collections first. Before changing rates, compare Revenue Per Available Square Foot (RevPAF) with local market benchmarks to check whether your pricing falls below the market.
How do I calculate my break-even occupancy?
Add annual operating expenses (OPEX) and annual debt service to find your break-even revenue. Then divide that total by Potential Gross Income (PGI) to calculate break-even economic occupancy. PGI is the maximum annual revenue your facility could generate at 100% occupancy using current market rates.
To estimate physical break-even occupancy, add 3 to 8 percentage points to your economic occupancy figure. This accounts for typical revenue gaps caused by concessions, free rent, and delinquency.