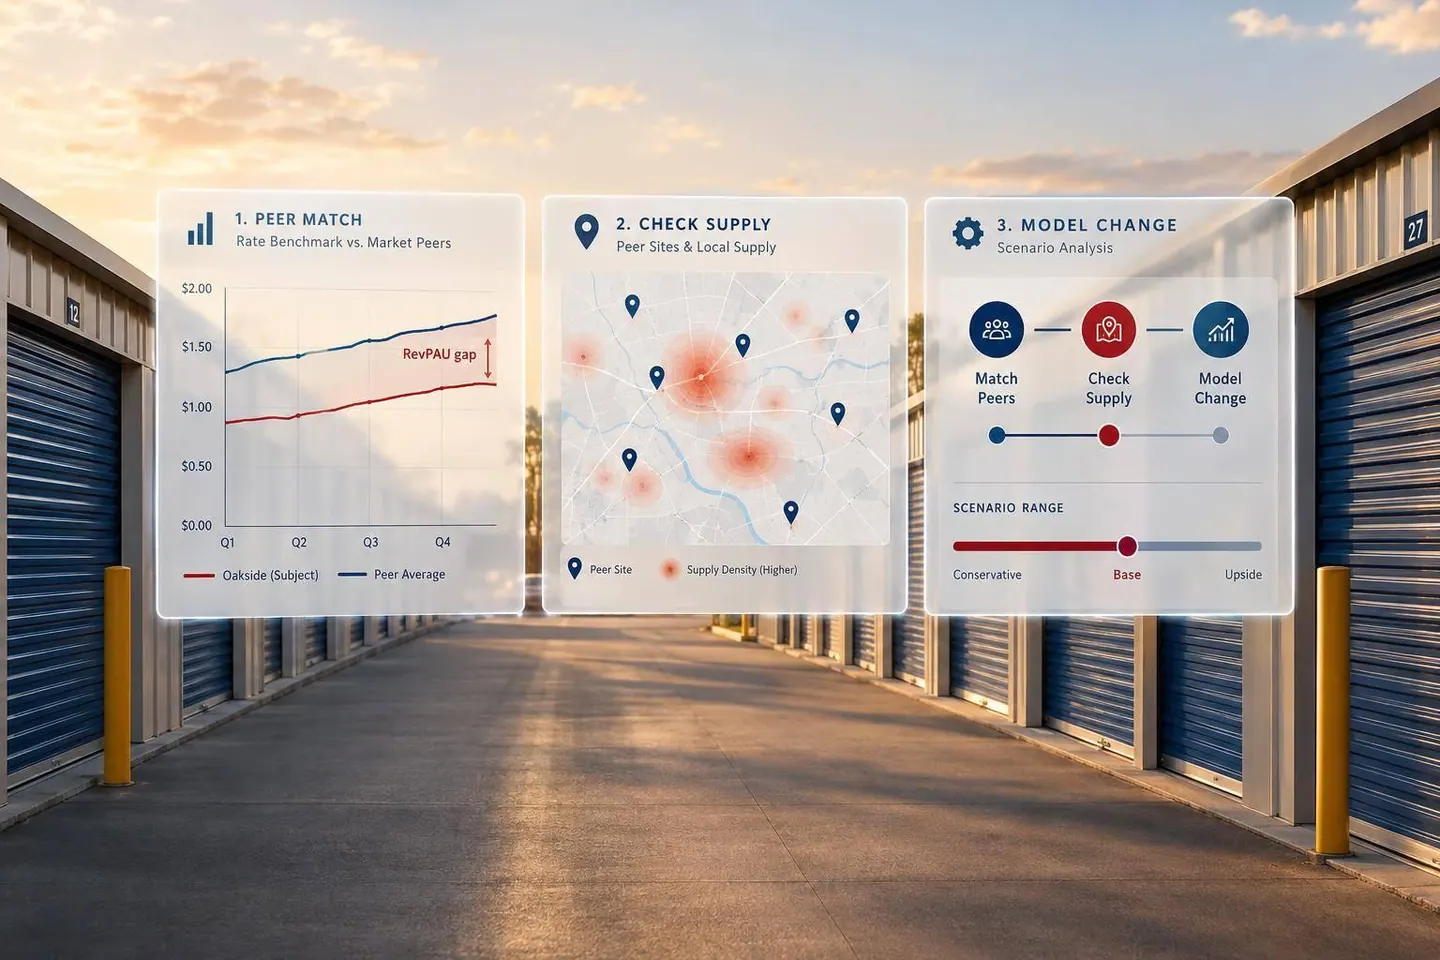


If I had to sum it up in one line: institutional owners usually buy for scale and steadier income, while private owners often buy for flexibility, local edge, and more concentrated upside.
Here’s the short version:
- Institutional capital controls a large share of self-storage, with about 45% of U.S. self-storage space under institutional ownership as of October 2024.
- Private buyers still drive most deal volume, making up 82% of self-storage acquisitions in a 2025 market report.
- In boat and RV storage, independent and small regional owners still dominate, with about 85% to 90% of facilities held by private operators in 2026.
- The biggest differences usually come down to deal size, hold period, leverage, market selection, and concentration risk.
- Institutional portfolios often lean toward larger portfolios, stricter debt limits, and more diversification.
- Private portfolios often lean toward single assets, smaller deals, floating-rate or bridge debt, and heavier exposure to one market or operator.
- A higher return target does not mean a better deal. It often means more lease-up risk, more refinance risk, or more dependence on one business plan working on time.
- The right fit depends on your cash needs, risk tolerance, hold period, and ability to run the asset well.
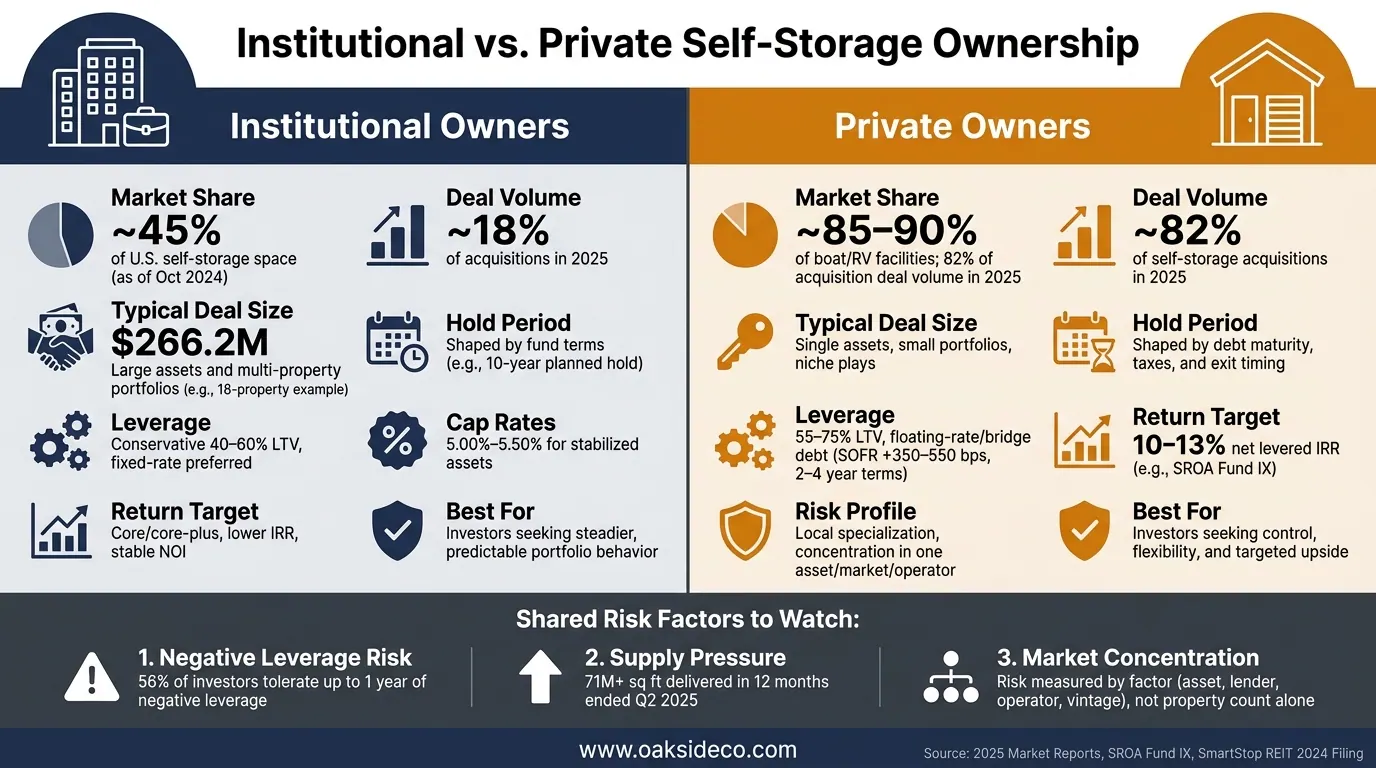
Institutional vs Private Self-Storage Ownership: Key Differences at a Glance
| Area | Institutional owners | Private owners |
|---|---|---|
| Main focus | Scale, repeatable deals, steadier income | Flexibility, select deals, local edge |
| Typical deal size | Large assets and portfolios | Single assets, small portfolios, niche plays |
| Hold period | Often shaped by fund terms | Often shaped by debt, taxes, and exit planning |
| Debt style | More fixed-rate, lower leverage, portfolio rules | More deal-by-deal, often higher leverage |
| Market approach | More geographic spread and liquidity focus | More local specialization |
| Main risk | Process drag, buying too broadly, supply overlap across markets | Concentration in one asset, lender, market, or operator |
| Best fit | Investors seeking steadier portfolio behavior | Investors seeking more control and targeted upside |
If you’re deciding where to place capital, I’d keep the test simple: does the portfolio’s debt, market exposure, and hold period match what you can actually afford to carry if rents soften, rates stay high, or exit liquidity gets thin? This is especially critical if a market crash looms due to oversupply or economic shifts. That’s the lens that matters most in this comparison.
Institutional and private owners part ways early on: how much money they need to put to work and what kind of asset can absorb it. You see that gap right away in deal size.
Why Institutions Favor Larger, Repeatable Large Transactions
Institutions usually need bigger deals to make underwriting, reporting, and compliance worth the effort. That pushes them toward multi-property portfolios or large portfolio buys, where they can apply the same playbook across many assets at once: standardized operations, centralized revenue management, and consistent reporting.
Recent deals make that pretty clear. Related Cos. acquired an 18-property portfolio across five Southwestern states - about 1.3 million rentable square feet and 9,600 units - for $266.2 million. That kind of acquisition is built around operating scale and geographic diversification, which helps explain why it lines up so well with institutional mandates.
For most institutions, self-storage is also just one slice of a broader real estate allocation. So a deal has to work not only on its own, but inside the full portfolio. That includes concentration limits, leverage policies, ESG requirements, reporting, and liquidity needs.
How Private Buyers Target Smaller and More Selective Deals
Private capital works differently. It can underwrite smaller, more targeted opportunities and go after single assets, small portfolios, development sites, or joint ventures. Many institutions wouldn't look at these on a standalone basis. But that's often where the opening is. The flip side is simple: smaller deals come with less built-in diversification, so both risk and upside sit in fewer assets.
Private ownership also covers a wide range of approaches. A family office may buy a stabilized facility and hold it for decades, with a focus on steady income, tax planning, and intergenerational wealth. A private equity sponsor may buy an under-managed property, improve collections, update access controls, rework the unit mix, and sell after the business plan is done. Same property type. Very different goals.
How Business Plan and Fund Life Shape Hold Period
Hold period usually follows the capital structure and the business plan. For institutional funds, the investment period and fund life often start the clock. SROA Capital's published overview, for example, identified a $750 million target fund size, a three-year investment period with two six-month extensions, and a 10-year planned hold. That setup creates a set ownership window no matter how any single asset performs.
Private value-add capital often moves faster. In those cases, hold period is more likely to be shaped by debt maturity, refinance risk, tax timing, and exit-market conditions rather than a fund deadline.
The table below sums up the main allocation differences.
| Dimension | Institutional | Private |
|---|---|---|
| Strategy focus | Often combines stabilized assets with scalable value-add or development programs, depending on mandate | More flexibility to pursue highly specific value-add opportunities, including under-managed facilities and local expansions |
| Exit options and limits | May require portfolio liquidity, institutional reporting, valuation support, investment-committee approval, and alignment with fund deadlines | May allow a negotiated single-asset sale, refinancing, recapitalization, or continued ownership, although partnership agreements and debt terms can restrict timing |
Core Income Goals vs. Value-Add Return Targets
Unlevered IRR measures property-level return before financing. Levered IRR measures equity return after debt. Equity multiple shows total dollars returned for each dollar invested. And cash-on-cash yield shows annual cash income as a share of invested equity.
Those metrics can point in very different directions. If the assumptions don't match, the comparison falls apart.
Institutional core and core-plus portfolios usually care most about stable occupancy, steady NOI, and fewer capex swings. In exchange, they accept lower return targets. The tradeoff is simpler: less upside, but more predictable cash flow and lower execution risk.
That lines up with recent pricing. Stabilized institutional-quality self-storage assets have traded at about 5.00%–5.50% cap rates. That 5.00%–5.50% range fits the income profile core buyers tend to want. PGIM research estimated that levered core returns could top unlevered core returns by around 100 basis points, while value-add strategies could pick up about 300 basis points more from leverage and repositioning work.
Private value-add and development strategies aim for higher returns because they take on more risk. That can mean lease-up risk, construction exposure, and added operating complexity. The ownership label matters less than the risk profile and the kind of capital backing the deal. SROA Fund IX, for example, targeted a 10%–13% net levered IRR with leverage at 60% LTV, capped at 70% LTV. So the line between strategies isn't always about who owns the asset.
The main point is simple: compare returns only when the inputs line up. A higher levered IRR on a short value-add hold is not a clean match for a lower unlevered IRR on a longer core hold.
Debt Policy as a Portfolio Construction Choice
Debt policy affects liquidity, cash flow stability, refinancing risk, and equity returns. For both institutional and private owners, debt structure shapes how much of a property's performance ends up with equity holders - and how exposed the portfolio becomes when the market shifts.
Institutional owners often manage debt at the portfolio level. That usually means setting maximum LTV limits, minimum debt-service coverage ratios, and rules around floating-rate exposure and lender concentration. SmartStop Self Storage REIT's 2024 filing shows what that looks like in practice. The company managed a mix of fixed-rate loans, acquisition facilities, and SOFR caps across its portfolio, including a $100.2 million acquisition facility at 7.34% and an $89.24 million CMBS loan at 3.89%. That's not ad hoc underwriting. It's duration matching and rate management by design.
Private owners often make financing choices one asset at a time. A self-storage feasibility study points to bridge debt for value-add and lease-up projects at about 70%–80% loan-to-cost, often with interest-only structures, two- to four-year terms, and pricing around SOFR plus 350–550 basis points. That's an indicative example, not a market-wide rule. Those terms can fit a fast-moving business plan, but they also pack refinancing risk into a short window. If stabilization takes longer than planned, or rates stay high, the owner may face a capital call, a forced sale, or a loan extension at a higher cost.
The table below shows how each ownership type often handles core debt choices.
| Debt consideration | Institutional core/core-plus portfolio | Private value-add or entrepreneurial portfolio |
|---|---|---|
| Target loan-to-value | Often conservative, commonly around 40%–60% for stabilized assets | Frequently broader, often about 55%–75%, with higher leverage possible for select projects |
| Rate structure | Greater preference for fixed-rate or effectively fixed-rate debt | More willingness to use floating-rate bridge or construction debt when pursuing a business plan |
| Recourse | Strong preference for nonrecourse financing with customary carve-outs | More willingness to accept partial or full recourse, completion guarantees, or repayment guarantees |
| Interest-rate protection | Swaps, caps, collars, or other hedges are typically governed by formal treasury policies | Rate caps are common on floating-rate loans; hedging decisions may be more transaction-specific |
| Refinancing risk | Managed through longer maturities, staggered debt expirations, lender diversification, and liquidity reserves | May rely on refinancing after lease-up, expansion, or stabilization |
| Impact on equity returns | Moderate leverage is used to enhance returns without making debt the primary source of performance | Leverage may be used aggressively to increase levered IRR and equity multiple |
When acquisition cap rates drop below borrowing costs, debt can hurt cash yield at first instead of helping it. That's called negative leverage. Recent survey data suggest that nearly 56% of investors could tolerate one year of negative leverage. That risk should be modeled directly in the base case.
These return and debt choices also shape how much market concentration a portfolio can absorb.
Geographic Diversification vs. Local Market Specialization
Once leverage is set, market selection shapes how much volatility a portfolio can take. Institutions usually buy for repeatability. Private owners often buy where they know the streets, the customers, and the local quirks. That difference matters.
Institutions tend to screen markets based on growth, incoming supply, and exit liquidity across a range of locations. They’re not usually making one-off bets. Private buyers, by contrast, may lean into a local edge. If they know how to run a property better than the next buyer, they may accept a market that looks less attractive on a broad screen.
The gap between markets right now shows why this matters. Chicago and Minneapolis posted year-over-year rent growth of about 2.9% and 1.3%, while several Sun Belt markets worked through new supply. At the same time, more than 71 million square feet was delivered in the 12 months ended Q2 2025, which is near record levels. Markets such as Phoenix, Orlando, Tampa–St. Petersburg, Dallas, and Houston still have large future supply pipelines.
Primary markets usually come with deeper liquidity. Secondary markets may offer a lower basis, but the buyer pool is often thinner. So the choice isn’t just about price. It’s also about who might buy the asset later, and on what terms.
A private buyer with strong local operating skills may be comfortable buying in a secondary market if the basis leaves room for renovation or expansion. An institution may lean toward a more liquid MSA that can handle a larger acquisition today and a future portfolio sale later. That tradeoff feeds straight into concentration risk.
Portfolio Concentration and Exposure Limits
Concentration risk doesn’t just come from owning too few properties. It can come from one asset, one lender, one operator, one vintage, or one regional cycle. That’s where portfolios can get sneaky. On paper, an owner may hold several assets. In practice, the risk may still be tied to the same few drivers.
Private portfolios often build this kind of exposure over time. Owners add assets bit by bit and keep working with the same lenders, brokers, and operators they already trust. Institutions usually have more ways to spread exposure across assets, MSAs, operators, strategies, and vintage years. But that spread comes at a cost. Ten assets in ten markets can also mean ten insurance markets, ten tax systems, ten zoning frameworks, and ten operator relationships to manage.
The table below shows six main risk factors, where exposure tends to pile up for each ownership type, and which signals are worth watching early.
| Risk | Private portfolio exposure | Institutional portfolio exposure | Key indicators |
|---|---|---|---|
| Asset-level risk | High - one facility may drive most portfolio cash flow | Lower through diversification, but property-level risk remains | Occupancy, delinquency, security incidents, repair backlog |
| Local oversupply | Direct exposure to one corridor or submarket | Can offset with supply-constrained markets elsewhere | Supply per capita, deliveries, concessions, rent trends |
| Interest-rate changes | High with rate resets or maturity clustering | More ability to stagger maturities and diversify financing | Debt-service coverage, maturity schedule, SOFR exposure |
| Insurance and property-tax pressure | One shock can affect a large share of cash flow | Spread geographically, though catastrophe exposure may remain | Premium renewals, deductibles, reassessments, millage rates |
| Operator dependence | High if one local manager controls most assets | Lower through multiple operators and centralized controls | KPI variance, staff turnover, online conversion, complaints |
| Thin exit market | Higher in small or secondary markets with thin buyer pools | Lower for scalable portfolios in primary-market MSAs | Bid depth, transaction volume, financing availability |
A private owner doesn’t need institutional scale to put basic concentration controls in place. A simple dashboard can do a lot of work. Track each asset’s share of portfolio net asset value, debt, NOI, and projected capital expenditure exposure. That kind of view can flag trouble before it turns into a full-blown problem.
The key distinction is between knowledge concentration and financial concentration. The first can be an edge. Knowing one market better than anyone else can pay off. The second is where things get dangerous. If too much of the portfolio depends on one operating team, one rate reset, or one reassessment, one bad turn can hit everything at once.
That’s why diversification should be measured by risk factor, not by property count alone. An institution with ten assets in the same supply-heavy MSA may carry more concentration risk than a private owner with five assets across separate markets tied to different demand drivers.
Those exposure limits set the right allocation mix.
A Checklist for Matching Strategy to Capital
The comparison between institutional and private ownership starts to matter when you tie it to your own numbers, goals, and limits. Before you commit capital, write out clear answers to these questions:
- How much equity is available after reserves, and how much needs to stay uncommitted for liquidity?
- Is the main goal current income, long-term appreciation, or a specific value-add target?
- What hold period is realistic, and does it line up with the debt maturity and the business plan?
- What level of leverage still works if occupancy drops and interest costs rise?
- Do you have the operating ability to carry out the plan, or do you need a third-party partner?
- Do you know the market well enough to underwrite supply, demand, rents, taxes, and competition?
- What is the maximum exposure you can accept to one asset, market, operator, or strategy?
Your answers should steer you toward one of three paths: core income, value-add, or development. From there, sort each deal into the right lane and match that lane to your capital base, hold period, and operating ability.
Institutional buyers usually lean toward repeatable, lower-risk allocation. Private buyers often have more room to go after smaller, more selective, higher-touch deals. That difference matters. A plan that fits a large fund may be a poor fit for an owner working with a tighter capital base or a more hands-on approach.
The same idea carries over to market selection. Regional concentration can make sense, but only if you have a documented local edge that makes up for the added risk. If not, it makes more sense to cap exposure to any one market.
For many owners, this is where outside help earns its keep. Good underwriting and clean execution can make the difference between a deal that looks fine on paper and one that actually performs. For owners working through these choices in self-storage and boat and RV assets, Oakside Co provides data-driven underwriting, transaction management, and disposition support for self-storage and boat/RV assets.
Conclusion: The Right Portfolio Structure Depends on Goals and Risk Capacity
Institutional and private owners make different allocation choices for plain reasons. Institutional portfolios grow around diversification and process. Private portfolios grow around flexibility and control. The right structure depends on the owner's mix of income needs, growth goals, operating ability, leverage tolerance, and downside capacity - not the label alone.
How do I know which portfolio style fits my goals?
Start with your liquidity needs and time horizon. If you want a faster cash-out, lean toward strategies built for more liquid exits. If you’re playing the long game and aiming for more value over time, put more weight on longer-hold, scaling approaches.
Then pressure-test the deal. Check whether the returns still hold up under downside cases, including exit cap rates, rent growth, and break-even occupancy using DSCR across multiple years. The assets should also line up with the market tier and property quality in your underwriting.
When does higher leverage become too risky?
Higher leverage starts to look dangerous when the return depends more on the loan than on how the property performs. That’s when the gap between levered and unlevered IRRs gets too wide.
In today’s market, that risk shows up fast when permanent financing stays expensive and break-even occupancy creeps close to stabilized market occupancy, often in the 60% to 65% range. At that point, there isn’t much room for error. If a deal only works when everything goes exactly right, that’s a red flag.
How should I measure concentration risk?
Look past national averages and zoom in on hyper-local submarket data within a 3-mile radius. Check square feet per capita against recent deliveries and local absorption rates.
It also helps to review the development pipeline, with extra attention on projects in permitting. Those projects can hint at future oversupply before it shows up in the numbers.
As Nolen Masserman, Managing Director at Oakside notes, storage demand is highly local, and zoning or municipal barriers can create risks or opportunities broad market sentiment may miss.