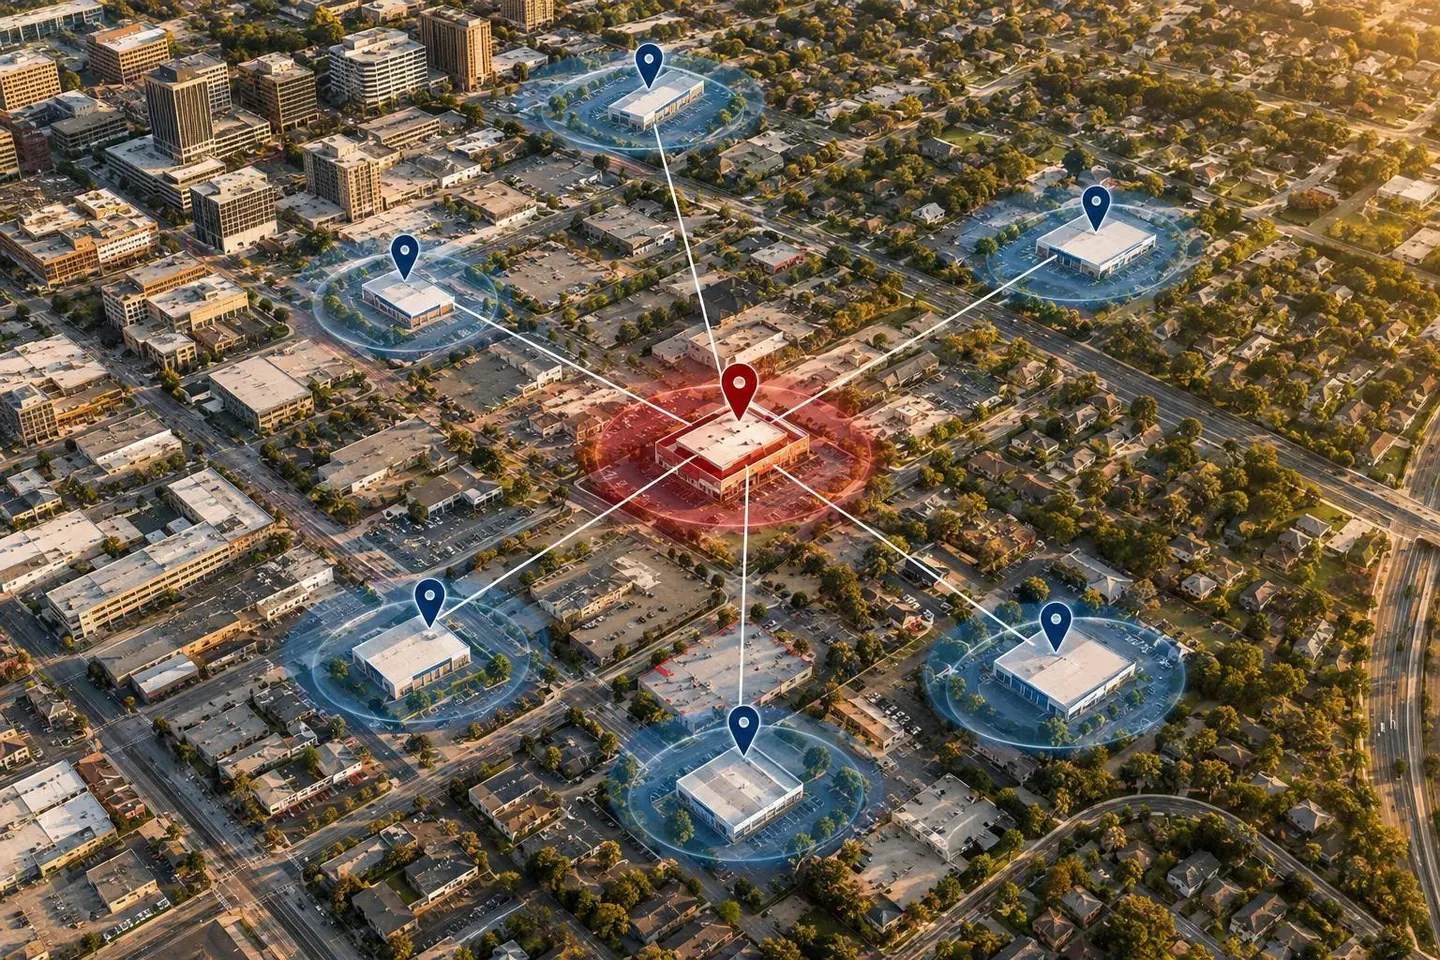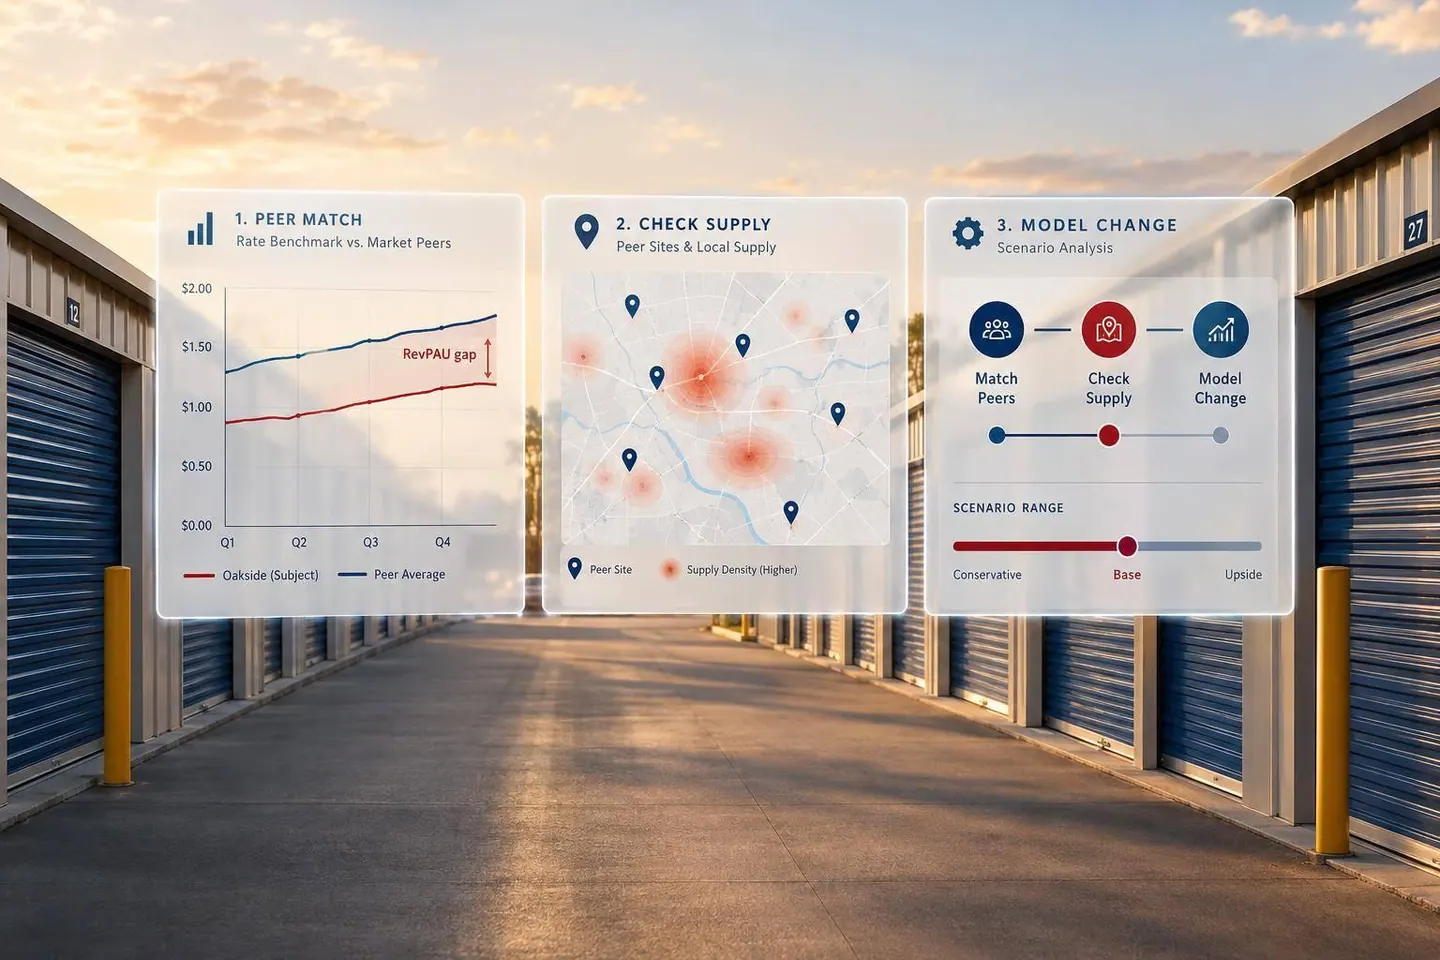

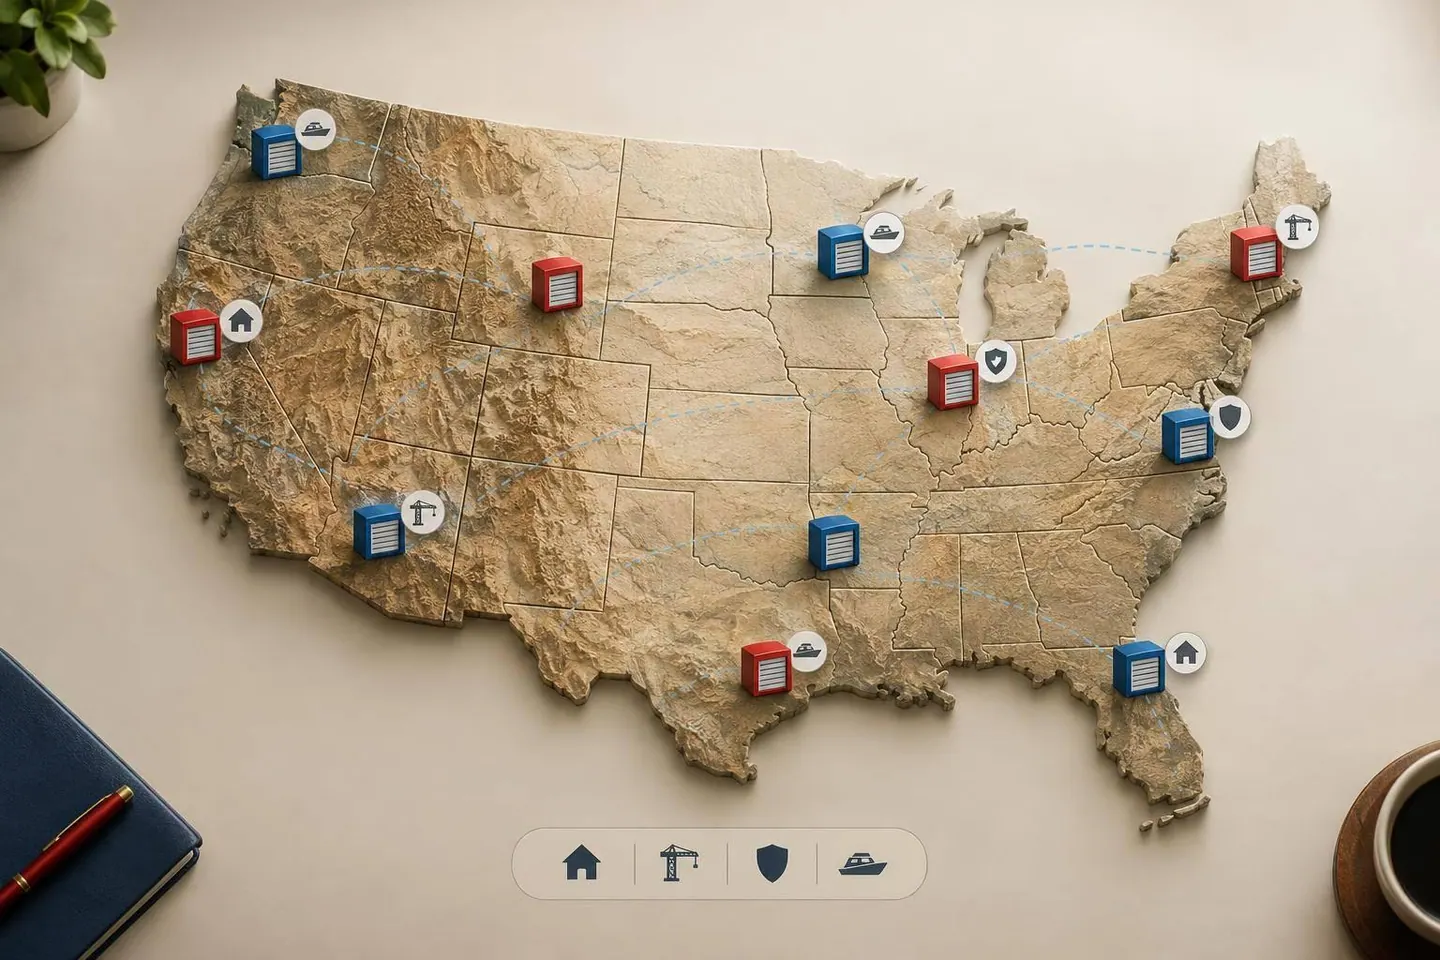
I’d spread storage investments across demand sources - not just state lines. Before buying, I’d check household growth within 3–5 miles, competing projects due over the next 24–36 months, insurance quotes, and recent local sales.
My starting point: match each market to the job it needs to do in your portfolio. Growth, steady income, higher rents, and seasonal boat/RV demand come with different costs and risks.
Quick Comparison
| Market group | Portfolio role | Demand to check | Main cost or supply risk | Pricing and exit check |
|---|---|---|---|---|
| Sun Belt | Growth exposure | Household moves, jobs, boat/RV ownership | New supply, heat, storms, flooding | Compare achieved rents, concessions, and local sales |
| Midwest | Steadier income | Employment, housing turnover, winter vehicle storage | Snow costs, property upkeep, slower growth | Confirm buyer depth, especially in smaller markets |
| Mountain West | Migration and recreation exposure | Household formation, vehicle registrations, recreation access | New supply, wildfire, water limits, snow | Separate major-metro pricing from smaller-market pricing |
| Coastal | Higher-rent income | Density, renter demand, marina access | Insurance, taxes, land costs, storm damage | Check whether rent premiums cover higher costs |
| Lake and recreation | Seasonal boat/RV income | Ownership, ramp access, parking restrictions | Seasonal vacancies, water levels, site limits | Use annual income and sales of similar storage formats |
These groups overlap. A coastal or lake property may also sit in the Sun Belt or Midwest.
My bottom line: <u>different locations don’t always mean different risks</u>. I’d compare at least three years of income and expenses, then test lower rents, higher costs, and a delayed sale before deciding whether an acquisition adds balance.
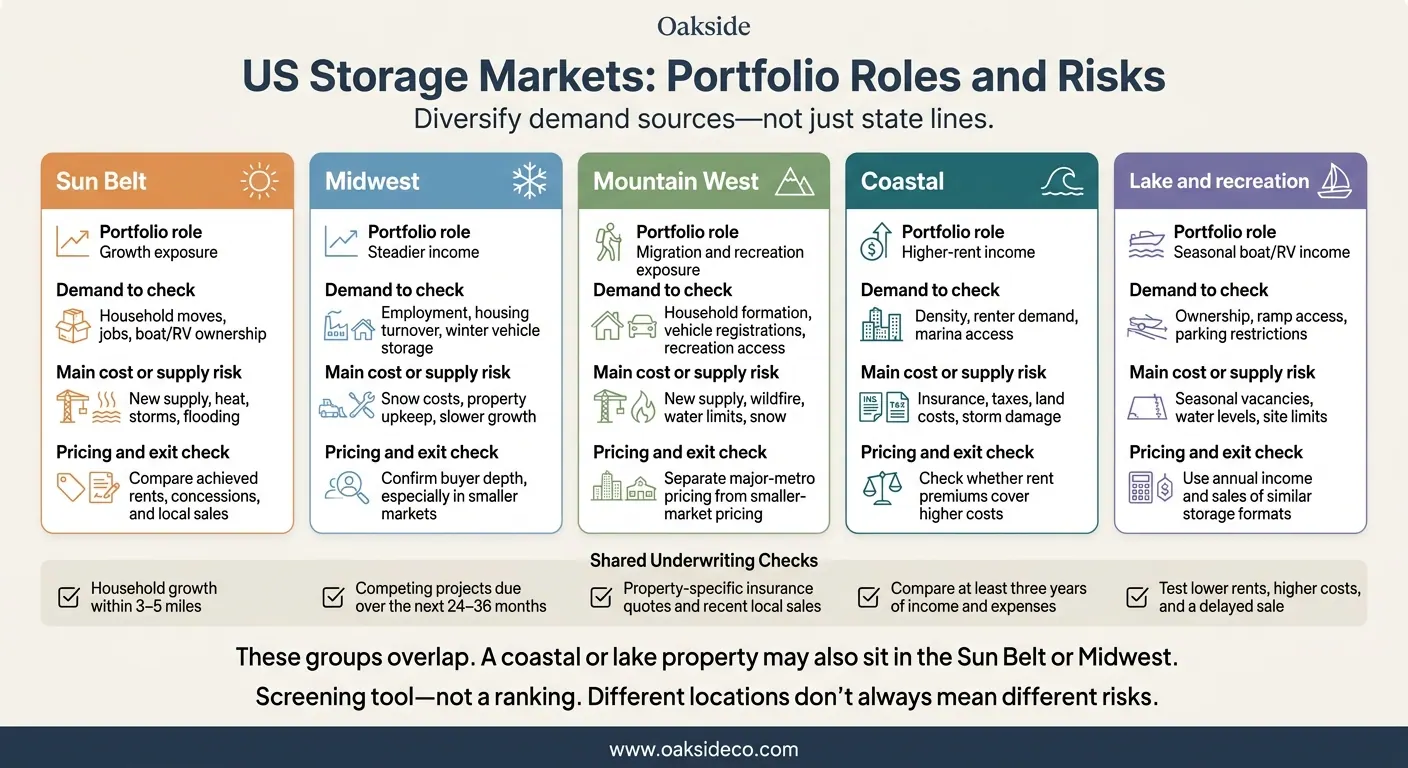
US Storage Markets: Portfolio Roles and Risks
Demand and Housing
Texas, the Carolinas, Georgia, Tennessee, Arizona, and selected Oklahoma markets attract new residents and jobs. But major metros and secondary markets don't perform the same way. Self-storage demand follows moves, new households, and housing constraints. Check home sales and apartment turnover before assuming population growth will fill units. Florida’s reported net domestic migration fell from 310,892 in 2022 to 22,517 in 2025.
Boat/RV demand needs separate underwriting. Review ownership rates, marina and highway access, HOA parking restrictions, and demand for covered spaces.
Climate and Seasonality
These growth markets also come with greater weather risk. Longer recreation seasons support boat/RV use, but they don't guarantee higher rents.
In Florida and coastal areas of Texas and the Carolinas, review hurricane and flood exposure alongside insurance coverage. Inland Texas and Oklahoma require hail and tornado analysis. Georgia and Tennessee also face severe storms and flooding. In Arizona, factor in cooling, water, and utility costs.
Get property-specific insurance quotes before setting your offer, including deductibles and exclusions.
Supply and Development Risk
Growth does not offset an overbuilt trade area. Phoenix, Charlotte, and some Texas corridors have faced high levels of development or rent pressure. Map permitted projects and deliveries expected over the next 24–36 months. Then compare occupancy by facility age, concessions, and achieved rents.
For boat/RV properties, assess covered and uncovered spaces separately. Heavy Sun Belt development has weakened rent growth in this segment, too.
Pricing and Deal Flow
Development and institutional ownership support strong deal flow, but stabilized facilities and lease-ups need separate underwriting. Compare local transactions, replacement cost, financing terms, tax reassessments, and insurance renewals - not regional averages.
Use the Sun Belt as a growth-and-income allocation, with limits by state, insurer, flood exposure, and development pipeline. Test acquisitions against 12–24 months of rent pressure and slower absorption instead of paying for an assumed recovery. The Midwest offers a counterweight: steadier demand, less new supply, and lower growth, but often a better balance between supply and demand.
Demand and Housing
The Midwest offers a counterweight to the Sun Belt: steadier demand and less development pressure. Compare Chicago, Minneapolis, Indianapolis, Columbus, Detroit suburbs, and selected Plains markets - Des Moines, Omaha, Kansas City, Wichita, and Sioux Falls - using local demand, not state averages.
Chicago and Minneapolis have dense household and employment bases. Indianapolis, Columbus, and Detroit-area suburbs need closer checks on logistics and manufacturing jobs. In Plains markets, look for a mix of employers that supports demand. Separate household moves and apartment turnover from business demand for larger drive-up units.
Climate and Seasonality
Steadier demand doesn't remove winter costs. Account for snow removal, roof loads, winter access problems, and freeze-thaw pavement damage in underwriting. Plains properties also need hail and tornado analysis.
Model enclosed boat/RV demand separately. Check lake access, recreational ownership, and fall move-ins against spring move-outs. Before counting on winter storage income in Michigan, Minnesota, Wisconsin, and Missouri recreation corridors, review winterization features, shore power, drainage, turning space, and room to pile snow.
Supply and Development Risk
Low supply can help, but it doesn't create demand.
Minneapolis’ reported lease-up inventory fell from 20.3% in 2022 to 4.1% in June 2025, reducing competitive lease-up space.
That decline can ease competition for existing portfolio assets. Check vacant retail and industrial buildings that could become storage, not just ground-up projects.
In university and medical-employment markets such as Madison, compare tenant demand with the timing of nearby openings.
Pricing and Deal Flow
Even when supply tightens, the pool of potential exit buyers still determines whether the purchase basis works. A lower purchase price is not always better value. Midwest assets may cost less than coastal properties, but deferred maintenance, property taxes, uneven population trends, and limited exit liquidity can erase that discount.
Compare achieved rents by unit type, NOI margins, and recent local sales. In smaller Missouri and Plains markets, identify likely exit buyers before bidding. Then test sensitivity for flat rent growth, a delayed sale, and a higher exit cap rate. Match the hold strategy to buyer depth, not just a lower entry basis.
Migration fuels demand across the Mountain West, but supply, climate, and resale risks vary sharply by metro.
Demand and Housing
Evaluate Denver and Colorado Springs, Salt Lake City, Boise, Reno-Las Vegas, and Albuquerque-Santa Fe as separate submarkets. This helps balance migration-led growth against smaller-market volatility.
Base underwriting on household formation, renter-heavy submarkets, housing permits, achieved storage rents, and local housing costs. When evaluating self-storage vs RV storage investment returns, look beyond apartment growth for boat and RV demand. Vehicle registrations, recreation access, and home-parking restrictions are better indicators of parking needs.
Climate and Seasonality
Growth comes with location-specific operating costs. High-elevation properties need budgets for snow removal, freeze protection, and winter access. Warmer Nevada and New Mexico markets face heat and UV exposure, which often supports demand for covered or enclosed parking.
Check wildfire maps, get property-specific insurance quotes, and confirm water service and fire-protection capacity.
Supply and Development Risk
New deliveries can shift Mountain West pricing quickly, especially in markets with limited demand.
A 2025 Coeur d’Alene review reported nearly 22 square feet of storage per resident, roughly 100,000 square feet in the pipeline, and typical monthly unit rents near $105; asking rates were flat to slightly higher.
Check occupancy and concessions to see whether planned supply is already putting pressure on rents. For boat and RV projects, verify outdoor-parking permissions, screening, paving, drainage, and turning space.
Build pipeline pressure into rent assumptions and exit pricing.
Pricing and Deal Flow
Compare recent closed sales and achieved rents within each submarket. Major metros support larger buyer pools; smaller recreation markets do not.
When adding smaller recreation markets to diversify a portfolio, underwrite their seasonal cash flow and exit demand separately. Pricing depends on local buyer depth, seasonal income stability, and recent comparable sales.
Demand and Housing
Coastal markets can command strong household-storage rates, but operating costs and regulatory risks run higher, too. Underwrite each subregion separately. Dense Northeast and Pacific Coast metros support recurring household storage. The Mid-Atlantic and Gulf/Atlantic coasts call for separate reviews of renter demand, infill, and recreation use.
Evaluate boat/RV demand on its own. It depends on marina access, highway links, ownership patterns, and parking restrictions.
Boston shows the pricing ceiling: average monthly rates reached $254 in August 2025, with just 0.7 square feet of storage per resident.
Weigh that rent potential against each location’s storm exposure.
Climate and Seasonality
Check hurricane, flood, humidity, and salt-air exposure. Get property-specific insurance quotes before bidding. Named-storm deductibles, flood coverage, and business-interruption terms can change returns enough to affect a deal.
Commercial flood coverage is generally separate from standard business insurance. The NFIP provides commercial limits of up to $500,000 for the building and $500,000 for contents. For boat/RV assets, test seasonal occupancy, evacuation access, and post-storm downtime separately.
Supply and Development Risk
Entitlement barriers favor adaptive reuse in New York, San Francisco, and Los Angeles, but they also increase expansion costs. Review conversion costs, parking rules, and fire/life-safety upgrades.
Coastal supply is not uniformly tight: Tampa’s construction pipeline equaled 6.5% of existing inventory in late 2025.
Supply constraints can support pricing - but only when taxes, insurance, and reserves stay under control.
Pricing and Deal Flow
High rents don’t guarantee high returns. Underwrite coastal assets as a higher-rent, higher-cost portfolio allocation. Compare price per rentable square foot, going-in cap rate, taxes, insurance, and reserves. Favor properties whose rent premium covers the higher operating costs.
Lake and recreation markets shift the emphasis from urban density to seasonal demand and parking rules.
Demand and Housing
Separate year-round household demand from seasonal boat/RV storage, second-home, and tourism demand. Compare Great Lakes markets in western Michigan, northeast Ohio, Wisconsin, and Minnesota’s lake districts with reservoir destinations such as Table Rock Lake, Lake Norman, Lake Travis, and Canyon Lake.
Measure towing time to ramps and campgrounds - not just shoreline miles. Check road width, turning space, and gate clearance, too.
Climate and Seasonality
Northern Great Lakes and inland-lake markets can earn income from winter storage. Model enclosed storage, winterization, snow removal, and off-season occupancy separately.
In warmer reservoir markets, test how drought-related ramp closures and changing water levels could affect demand. A longer boating season doesn't guarantee steady occupancy.
Supply and Development Risk
Count all competing supply: covered yards, dry-stack storage, wet slips, dealer lots, and campground parking. Confirm that zoning allows outdoor boat/RV storage and large canopies - even if it already allows self-storage.
Before valuing expansion land, check wetlands, shoreline setbacks, floodways, and stormwater requirements. An inland parcel with better towing access may work better than a shoreline site.
Pricing and Deal Flow
Apply specific self-storage pricing strategies to open, covered, enclosed, and indoor winter storage separately. Put monthly rents, seasonal packages, and ancillary fees on the same basis before comparing them.
Potential acquisitions include marina-adjacent sites, former industrial yards, farm conversions, and expansion pads at existing self-storage properties - but verify legal access, zoning, drainage, and environmental conditions before assuming conversion potential.
Value documented annual income, not peak summer occupancy. Include ancillary fees only when local operating records support them.
Compare regions using the same underwriting factors. Treat this section as a screening tool, not a ranking, and use the table below to assess assets at the metro and submarket level.
Demand and Housing
For self-storage, compare household formation, housing turnover, renter share, employment, and business activity. For boat/RV storage, check ownership rates, recreational access, parking restrictions, marina capacity, and the mix of large vehicles owners need to store.
Climate and Seasonality
Northern and mountain assets face winter access limits. Sun Belt and coastal properties need heat, wind, and flood analysis, while Western properties also need a wildfire review. Use property-level hazard records and current insurance quotes rather than assumed regional premiums.
Supply and Development Risk
Track recent openings, proposed projects, occupancy, and concessions within each trade area. Nationally, 53.4 million net rentable square feet was under construction in June 2025, equal to 2.7% of existing stock.
Review conventional units separately from open, covered, and enclosed boat/RV storage. For each format, check land availability, entitlements, and whether construction is feasible.
Pricing and Deal Flow
Compare recent sales across matching asset types and occupancy levels. Use dollars per rentable square foot for self-storage and dollars per stall or acre for boat/RV assets. Check the acquisition basis against replacement cost.
Assess exit depth through local sales, the buyer pool, and lender appetite - not regional averages. Where evidence is limited, use ranges for projected rents, lease-up, insurance increases, and exit capitalization rates.
The matrix below puts those tradeoffs side by side.
| Market group | Self-storage demand | Boat/RV demand | Population and housing | Climate and seasonality | Supply risk | Pricing and deal-flow depth |
|---|---|---|---|---|---|---|
| Sun Belt | Check achieved rents against household and business growth. | Verify ownership and parking needs across longer recreation seasons. | Test migration against housing deliveries and turnover. | Assess heat, wind, and flood exposure. | Check opening dates and concessions in growth corridors. | Check pricing and exit depth through local sales and buyer activity. |
| Midwest | Assess whether lasting employment and housing demand support occupancy. | Verify ownership and off-site storage needs. | Check household formation and job diversity. | Budget for winter access and freeze-thaw damage. | Verify competition despite slower growth. | Check pricing and exit depth through local sales and buyer activity. |
| Mountain West | Assess demand from migration and housing activity. | Use registrations to test recreation- and migration-driven demand. | Compare household growth with apartment deliveries and home sales. | Assess snow, wildfire, drought, and elevation-related costs. | Check land constraints, approvals, and buildability. | Check pricing and exit depth through metro-specific sales and buyer activity. |
| Coastal | Assess demand from density and limited household space. | Check ownership-driven demand against usable land constraints. | Review density, renter share, and housing turnover. | Assess local wind, flood, and other hazard exposure. | Check land costs and entitlement barriers. | Check pricing and exit depth through local sales and buyer activity. |
| Lake and recreation | Verify year-round household and business demand. | Confirm ownership-driven demand independently of population growth. | Separate permanent households from second-home activity. | Model seasonal demand separately from property hazards. | Survey competing supply by storage format. | Check pricing and exit depth through format-matched sales and buyer activity. |
Treat regional advantage as a hypothesis, not a promise. The table below turns regional traits into portfolio tradeoffs, helping you assess what each acquisition adds - and where it concentrates risk.
| Market group | Portfolio advantage | Principal disadvantage | Diligence priority |
|---|---|---|---|
| Sun Belt | Population growth, household formation, and migration can expand the tenant base. | Fast-paced development can put pressure on lease-up and concessions. Storm risk and rising insurance costs can also reduce NOI. | Test submarket supply, achieved rents, concessions, lease-up occupancy, property-tax trends, and insurance quotes. |
| Midwest | Steadier income can balance growth-focused holdings. Winter vehicle storage can add demand. | Smaller markets may have fewer buyers, and winter operating costs can climb. | Verify local buyer depth, transaction volume, winter operating expenses, roof and pavement condition, snow-removal contracts, and demand outside peak moving months. |
| Mountain West | Migration, recreation, and outdoor-industry activity can support demand for household and boat/RV storage. | Affordability limits and climate exposure can weaken demand or increase costs. Snow, wildfire, or extreme heat can restrict access and disrupt operations. | Compare wage and rent growth with home prices. Review entitlement and utility capacity, assess property hazards, and test RV and vehicle demand separately from household growth. |
| Coastal | Scarcity value and rent premiums can complement lower-cost holdings. | Higher land, tax, labor, insurance, and compliance costs can erase scarcity value. | Test whether achievable rent premiums cover carrying costs. Check replacement cost, permitting timelines, insurance deductibles, and lender requirements. |
| Lake and recreation | Facilities near lakes and recreation corridors can draw boat, RV, trailer, and seasonal demand that's less tied to metro household growth. | Seasonality can make winter cash flow uneven and concentrate exposure in a smaller tenant and buyer pool. | Compare annualized occupancy with seasonal occupancy. Measure winter move-outs and delinquency, verify boat and RV dimensions and power requirements, and review access roads and flood exposure. |
To test whether an acquisition diversifies cash-flow drivers - not just locations, compare at least three years of operating results. Then stress-test revenue, insurance, taxes, and exit timing.
Start with the portfolio role, then match the region. Combine growth exposure with supply-constrained income only when each asset passes its own underwriting. Warm-weather assets can offset winter-storage cash flow, but compare full-year performance - not just peak occupancy.
Use the matrix below to screen acquisition fit, not to set fixed allocation targets. For every row, check demand, competition, pricing, construction, entitlements, insurance, and exit liquidity.
| Portfolio role | Demand profile | Climate risk | Supply risk | Seasonality | Buyer depth | Acquisition gates |
|---|---|---|---|---|---|---|
| Sun Belt growth | Household formation, migration, renter mobility, employment growth | Location-specific heat, hurricanes, flooding, severe storms | Moderate to high; deliveries, concessions, entitled pipeline | Moderate; weather- and housing-driven move-in cycles | Broad in many markets; strong buyer competition | Test demand, competition, pricing, insurance, construction costs, entitlements, and exit liquidity. |
| Supply-constrained Midwest income | Stable households, affordability, employment anchors | Freezing, snow, roof loads, winter access | Moderate to low where zoning, land, or construction limits supply | Winter-sensitive occupancy and expenses | Moderate; potentially less institutional competition than coastal markets | Test occupancy durability, winter costs, competing pipeline, achievable rents, and buyer depth. |
| Mountain West expansion | Migration, population growth, outdoor recreation, constrained housing in selected markets | Wildfire, drought, water availability, heat, access | Varies by submarket; entitled land and infrastructure constraints | Recreation and winter demand cycles | Variable; thinner outside major metros | Assess insurance terms, water, utilities, wildfire mitigation, pipeline, and exit liquidity. |
| Coastal infill income | Dense households, renter mobility, limited land, urban or port employment | Flooding, wind, storm surge, salt air, insurance exposure | Land and entitlement constraints; redevelopment competition | Less seasonality in day-to-day operations; storm-related disruptions | Deeper transaction and financing markets | Assess zoning, density, insurance, construction feasibility, rents, replacement cost, and institutional exit demand. |
| Lake/recreation boat and RV exposure | Boat/RV registrations, marina access, HOA restrictions, campground traffic, seasonal owners | Flooding, wind, hail, snow, wildfire, shoreline exposure | Purpose-built supply may be limited; demand is highly site-specific | High; winter storage, boating seasons, snowbird cycles | Variable; narrower buyer pools for specialized assets | Assess registrations, vehicle dimensions, access, parking restrictions, rents, drainage, security, insurance, and exit comparables. |
Oakside Co provides data-driven analysis, transaction management, investor network access, and disposition support for self-storage and boat/RV portfolios.
How do I spot overlapping risks across regions?
Review 24 to 36 months of performance data to distinguish seasonal shifts from weakening demand. Across regions, high physical occupancy can mask shared pricing pressure - especially when rents stay flat, discounts run deep, or physical occupancy outpaces economic occupancy.
Compare local household formation, nearby supply pipelines, and street-rate trends. Then test scenarios to see how slower migration or spikes in construction could affect each asset.
How should I size each region’s portfolio allocation?
Base each region’s allocation on local demand and supply limits, not a rigid formula or national averages. Review household formation, migration, zoning barriers, and 24 to 36 months of performance data.
In the Sun Belt and coastal markets, weigh migration-driven demand against oversupply. In the Midwest and Northeast, account for seasonality and limited new supply. For boat and RV storage, focus on locations near recreational hubs and areas where restrictive HOA rules push owners toward off-site storage.
Can seasonal boat/RV income offset self-storage slowdowns?
Yes, but only where boat/RV demand is seasonal and local. Oakside notes that snowbird markets and lake or coastal areas can see fall occupancy peaks and late-spring declines, depending on recreation seasons and geography.
When underwriting, assess the local boat/RV fleet and storage demand tied to local restrictions or HOA rules. Test longer lease-up periods and higher initial vacancy during self-storage’s weaker periods.