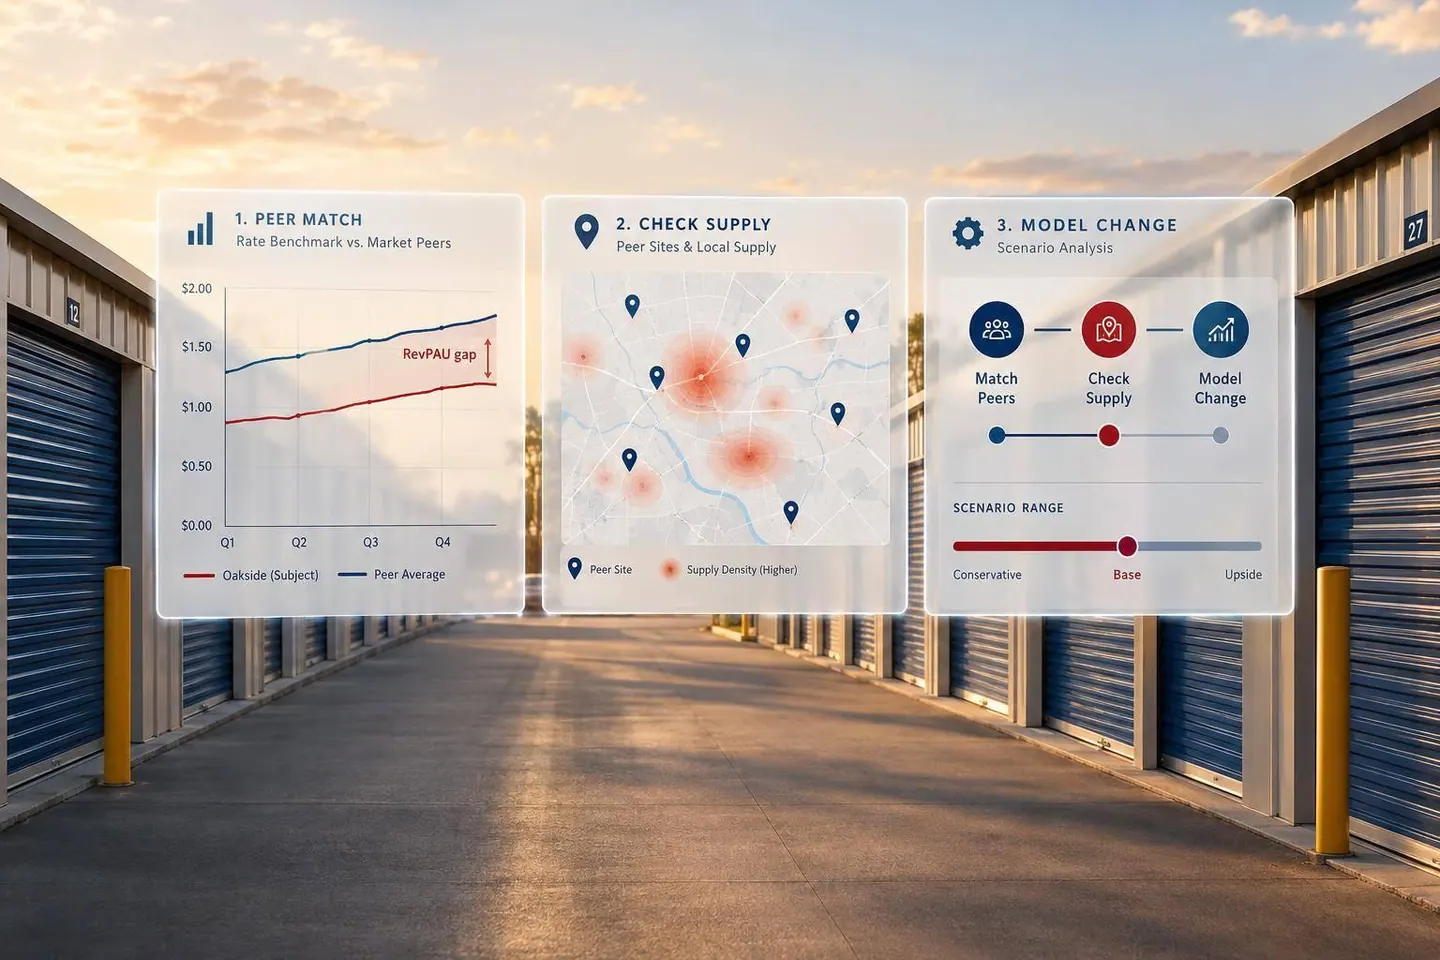


Higher rents don’t always mean more income. Before changing prices, I check five rent-growth KPIs against occupancy, move-outs, and collections - not just advertised rates.
Here’s what I track:
- In-place rent growth: Changes in rent for the same existing tenants.
- New move-in rate growth: Changes in starting rent for new leases.
- Achieved rate growth: Changes in realized rent per occupied unit or square foot.
- Asking rate change: Changes in published or quoted prices.
- Discount-adjusted growth: Changes in effective rent after promotions and concessions.
The test is what stays in your income. For example, a 5% increase in rent per occupied unit paired with a 5% drop in occupied units leaves rental income about 0.25% lower, assuming everything else stays the same.
Quick Comparison
| KPI | Question I use it to answer |
|---|---|
| In-place | Are existing tenants paying more - and staying? |
| New move-in | Are new tenants accepting higher starting rents? |
| Achieved | Are pricing changes reaching rental income? |
| Asking | How are quoted prices changing? |
| Discount-adjusted | How much rent remains after incentives? |
I review these monthly using matching unit types and the same accounting basis, with year-over-year checks for seasonality. <u>Keep self-storage and boat/RV investment returns separate</u>, then test pricing changes in one unit category before applying them across the property.
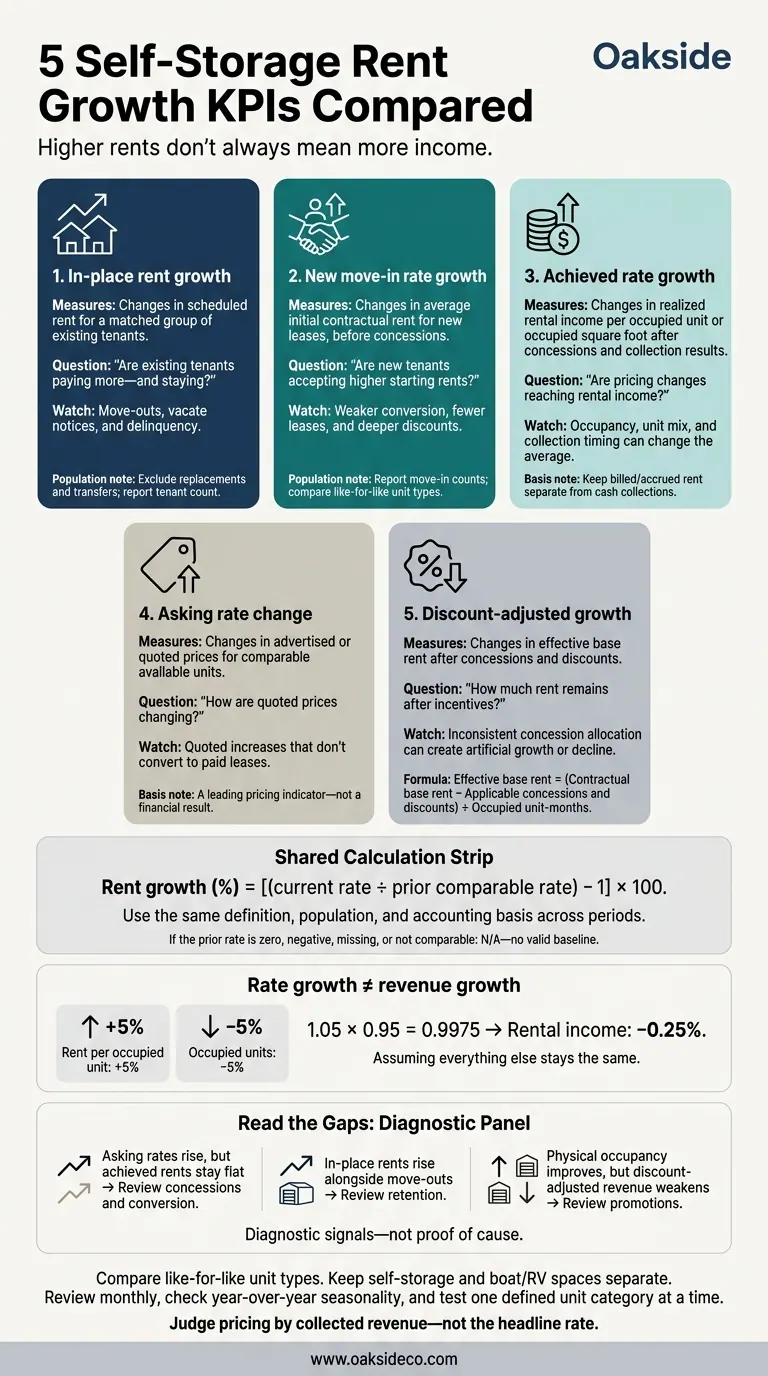
5 Self-Storage Rent Growth KPIs Compared
Before comparing the five KPIs, set the math: Rent growth (%) = [(current rate ÷ prior comparable rate) − 1] × 100. Keep the rate definition, occupancy basis, and inventory inclusion rules the same across periods. If the prior rate is zero, negative, missing, or not comparable, report “N/A - no valid baseline” alongside the current dollar rate and unit count.
Use month-over-month comparisons for recent movement, the same month last year for seasonality, and a trailing 12-month average versus the prior 12-month average for trends. Apply the same averaging method throughout. Strong leasing in late spring and summer can make a monthly increase look more lasting than it is. Keep at least 24 months of monthly history.
Track rent per occupied unit in $/unit and per occupied square foot in $/sq. ft. Show occupied units and occupied square footage beside each rate. Keep the unit mix constant across periods so inventory changes don’t look like rent growth.
Break out each KPI by like-for-like unit group. Separate climate-controlled from drive-up self-storage, and report uncovered, covered, and enclosed boat/RV spaces separately. Also separate spaces with electrical hookups. Don’t combine 10-by-20-foot and 12-by-40-foot spaces into one average.
Keep billed/accrued rent separate from cash collections. Contractual rent measures charges for the period; collections also reflect delinquency and payment timing. Before reporting growth, reconcile the rent roll, billing records, collections report, and general ledger. Apply this same basis to each KPI below.
Rate Definition and Calculation
Calculate growth using the same basis and a matched group of existing tenants. Exclude replacements and transfers, and report the tenant count alongside the growth rate.
Unit Types and Markets
Break out results by unit type and submarket, including boat/RV spaces, tenant tenure, and time since the last increase. Compare rents with current asking rates for like-for-like spaces to group tenants as below-market, near-market, or above-market.
pricing strategies
Start with below-market tenants who have good payment histories and enough time since their last increase. The gap between their rent and the asking rate shows potential room for an increase - not a guaranteed amount.
Check rental agreements, local rules, and notice requirements before making changes. Avoid applying the same percentage increase to tenants already paying above asking rates.
Related Metrics and Warning Signs
Track move-outs, vacate notices, and delinquency at 30, 60, and 90 days to assess whether increases are working. Report matched-cohort growth separately from total-property growth. Compare departing tenants’ rents with replacement tenants’ move-in rates.
Use these results as the baseline before comparing new move-in and achieved-rate growth.
Rate Definition and Calculation
After reviewing existing-tenant pricing, measure what new tenants actually pay as part of your self-storage operations. New move-in rate growth tracks the change in average initial contractual rent for tenants whose leases start during the period. It measures pricing earned from new demand - not just posted rates.
Include web, phone, and in-person leases. Calculate the average using comparable unit types or weight it by actual move-in volume:
[ \text{New Move-In Rate Growth} = \frac{\text{Current-period average initial contractual rent} - \text{Prior-period average initial contractual rent}} {\text{Prior-period average initial contractual rent}} \times 100 ]
Compare year over year to separate seasonal patterns from pricing changes.
Initial contractual rent is the recurring monthly lease amount before concessions. Also report promotion-adjusted rent using one fixed introductory period. Measure rent only at lease start.
Unit Types and Markets
Break down results by unit type and channel within each market. That keeps changes in the mix of leased units from looking like pricing growth.
For self-storage, separate climate-controlled and drive-up units, then break out key sizes. For boat/RV storage, separate covered and uncovered spaces and note power or water access. Review move-in counts alongside channel results.
Pricing Decisions
Use new-move-in growth to decide whether to increase asking rates, hold pricing, or offer targeted promotions. Test increases only where conversion, occupancy, and net move-ins remain healthy.
If conversion drops or vacant inventory builds, hold pricing or target promotions to slower-moving unit types. Review results monthly by unit type, and flag small samples so a few leases don’t drive the decision.
Related Metrics and Warning Signs
Track lead-to-lease and reservation-to-move-in conversion, occupancy, and net move-ins - move-ins minus move-outs. Also monitor early move-outs within 30, 60, and 90 days for each move-in cohort.
Higher starting rents don’t always mean lasting revenue gains. Rising initial contractual rents paired with deeper discounts or weaker conversion suggest that higher move-in pricing isn’t producing durable revenue. Use this KPI alongside achieved rate growth to see how much of the new-lease gain remains after concessions and collections.
Rate Definition and Calculation
Achieved rate shows how much rent remains after concessions and collection losses. Achieved rent is realized rental income per occupied unit or square foot after rent changes, concessions, discounts, write-offs, and turnover. Use the same revenue basis throughout.
Divide rental income by average occupied units or occupied rentable square feet. Calculate growth as (current achieved rent ÷ prior achieved rent − 1) × 100.
Unit Types and Markets
Compare like-for-like unit types within each market to keep changes in unit mix from skewing results. Separate climate-controlled, drive-up, and boat/RV spaces by relevant features. For boat/RV assets, use occupied spaces or linear feet rather than square feet.
Also separate stabilized tenants from lease-up inventory. Otherwise, a shift toward premium units can look like pricing growth.
Pricing Decisions
Use achieved rate to check whether gains in asking and move-in rents carry through to the financials. Tie both periods to the income statement and show each step: asking → in-place → discount-adjusted → achieved.
Related Metrics and Warning Signs
Track physical and economic occupancy, revenue per available square foot, concessions, delinquency, and total rental revenue alongside achieved rate.
Achieved rent can rise while total rental income falls if occupancy drops. If accrued achieved rent increases while collected achieved rent falls, review collections before increasing prices.
Rate Definition and Calculation
After realized rent, check whether current quotes are moving in the right direction. Asking rate change tracks changes in quoted prices for available units. It’s a leading pricing indicator - not a financial result. Compare units with the same type, size, location, and amenities across both periods:
[ \text{Asking Rate Change}=\frac{\text{Current Quoted Rate}-\text{Prior Quoted Rate}}{\text{Prior Quoted Rate}}\times100 ]
Report dollar change, percent change, and $/sq. ft. separately. Keep street, in-store, web, promotional, and fee-inclusive rates in separate fields. Web prices often include short-term discounts and can sit well below the walk-in street rate.
Unit Types and Markets
Compare like-for-like units within each market, matching size, access, condition, and amenities. For boat/RV spaces, also account for length and width, covered versus open-air protection, maneuvering room, gate access, and utilities. A higher quote may reflect better features - not stronger pricing.
Pricing Decisions
Use quote trends to decide where to increase, hold, or reduce promotions. Test one unit category for 2 to 4 weeks, comparing inquiries, conversion, move-ins, and vacancy days with the pretest period. Keep changes that improve leasing without weakening occupancy or realized revenue.
If leasing slows, try a smaller price increase or restore part of the discount. For boat and RV assets, adjust prices by space length, access quality, and seasonal demand rather than applying the same increase to every space.
Related Metrics and Warning Signs
Review asking-rate changes alongside occupancy, concessions, conversion, and leasing pace. Rising quotes paired with flat achieved rents and higher vacancy point to weak pricing.
Also check how many units are available at each quote. One premium vacancy can skew the advertised average without showing broader pricing strength. Use asking-rate change as the pricing signal before checking whether discounts are eroding net growth.
After tracking asking-rate changes, use this KPI to see how much rent remains after promotions.
Rate Definition and Calculation
Discount-adjusted growth measures the change in effective base rent after concessions. Use the same monthly, quarterly, or annual period for each calculation:
[ \text{Effective Base Rent} = \frac{\text{Contractual Base Rent} - \text{Applicable Concessions and Discounts}}{\text{Occupied Unit-Months}} ]
Report growth against the prior comparable period. To adjust for unit size, divide by occupied square-foot-months instead.
Count free months, introductory offers, online discounts, promotional credits, waived rent, and rate-guarantee adjustments once each. Reconcile these amounts to the general ledger. Track unexercised guarantees separately as potential exposure, and keep waived fees and ancillary income separate from base rent.
Unit Types and Markets
Compare like-for-like unit types, tenant cohorts, markets, and channels. Separate climate-controlled units from drive-up units, and covered boat/RV spaces from uncovered spaces.
For boat/RV assets, compare matching seasonal periods. Concessions can reduce full-year effective rent even when monthly contract rates stay steady.
Pricing Decisions
Give every promotion an expiration date, then check that billing returns to the intended rate. Before extending an offer, confirm that the added occupied unit-months and tenancy length justify the cost.
High occupancy doesn't always mean strong effective rent. If occupancy is high but effective rent lags, limit discounts to slower-moving unit types or channels instead of renewing property-wide offers.
Related Metrics and Warning Signs
Review monthly results alongside economic occupancy and revenue per available square foot (RevPAF), then check quarterly trends. Look into rising occupancy paired with falling effective rent, short tenant stays, or unexplained ledger differences. Compare discount-adjusted growth with achieved rate growth to separate pricing gains from collections.
These five KPIs track different parts of rent growth. The table shows what each measures, which pricing decisions it guides, and where it can mislead. Keep each KPI’s population consistent over time: existing tenants and new leases are different groups.
Use (current-period rate − prior-period rate) ÷ prior-period rate × 100 for all five KPIs.
| KPI | What the rate measures | What changes | Pricing decision informed | Principal limitation or warning signal |
|---|---|---|---|---|
| In-place rent growth | Change in scheduled rent for a matched group of existing tenants, including existing-tenant rate increases | Existing tenants’ scheduled rents | Whether and when to increase existing-tenant rents | Churn risk: aggressive increases can lead to move-outs, notices, or delinquency |
| New move-in rate growth | Change in initial contractual rent for new leases | Starting rents for incoming tenants | New-lease pricing, online rates, and lease-up plans | Weaker leasing volume: higher rates on fewer leases may hide weak demand |
| Achieved rate growth | Change in average rent realized across occupied units after pricing changes, concessions, and collection results | Realized rental income per occupied unit | Whether pricing changes translate into realized rent | Mix and timing effects: occupancy, unit mix, lease age, and collection timing can shift the average without a true price gain |
| Asking rate change | Change in advertised or quoted rent for available units | Published prices for quoted units | Website, channel, and available-unit pricing | Quoted increases that don’t convert to paid leases |
| Discount-adjusted growth | Change in effective rent after concessions, discounts, or free-rent periods | Net base rent for units receiving discounts, reflected in the defined cohort’s average | Whether to reduce, target, or rework promotions | Inconsistent concession allocation: treating discounts differently can create artificial growth or decline |
Read the gaps between KPIs - not just the percentages. If asking rates rise while new move-in rates fall, incoming tenants may be resisting quoted prices. If in-place rents rise while move-in rates fall, the gap between existing-tenant and new-tenant pricing may be growing. Check lease counts and move-outs before treating either pattern as stronger pricing power.
Before comparing measures, label each as contractual, billed, collected, or net effective rent. Those distinctions help you use the gaps to decide whether to increase rates, tighten discounts, or hold pricing.
Bring the five KPIs into a monthly pricing review to turn measurement into action. Keep the reporting cutoff, unit categories, and channel breakdown consistent. Track month-over-month, year-over-year, and trailing-12-month results. For boat/RV assets, put more weight on year-over-year comparisons.
Use changes in the KPIs to guide your next checks:
- Asking rates rise, but achieved rents stay flat: Review concessions and conversion.
- In-place rents rise alongside move-outs: Review retention.
- Physical occupancy improves, but discount-adjusted revenue weakens: Review promotions.
These are diagnostic signals, not proof of cause. Compare signed rates with quoted rates, review tenant tenure and notice reasons, and check discount depth and duration.
Before changing rates, confirm the signal with operating data. Check unit mix, collections, delinquency, available inventory, market conditions, and new supply. Test one defined unit category at a time, rather than the whole property.
For acquisitions, compare underwriting assumptions with actual tenant performance at 30, 60, 90, and 180 days. Check whether projected rents and concessions translate into collected revenue and NOI. Separate pricing shortfalls from lease-up pace, seasonality, or unit mix before revising rent assumptions.
Oakside Co helps owners connect pricing results to increase self-storage property value, using those results to decide whether to increase, hold, or rework rents.
Read all five KPIs together before changing rents. Each answers a different question: asking rates show intent, new move-ins show acceptance, in-place rents show existing-tenant pricing, achieved rates show realized rent, and discount-adjusted rent shows net rent after concessions.
Rate growth does not equal revenue growth. Higher rents can be offset by vacancy, delinquency, or churn. Judge the change by collected revenue - not the headline rate.
Check the property-wide trend first, then review each unit type separately.
Compare like-for-like categories within the same market or submarket, keeping 10x10 climate-controlled units separate from 10x20 drive-up units, and covered boat spaces separate from uncovered RV spaces.
Review each segment against occupancy, collections, retention, local supply, and seasonal demand.
How much vacancy can a rent increase offset?
There’s no one-size-fits-all ratio: rent growth needs to offset vacancy losses when tenants move out. Track the gap between physical and economic occupancy to see how that balance is playing out.
According to Nolen Masserman, Managing Director at Oakside, economic occupancy typically trails physical occupancy by 3% to 8% in stabilized assets. After rent increases, tenant churn shouldn’t push that gap beyond 10%. A gap above that threshold signals that discounts or vacancies are eating into the intended net operating income gains.
How many leases make a pricing test reliable?
The provided search results do not specify a minimum lease count for a reliable pricing test. Pricing decisions should instead rely on verified facility-level performance data, historical trends, and local market analysis.
To gauge whether a market can support price changes, track inquiry volumes, conversion rates, and occupancy trends over time. Ideally, use at least 24 months of data to account for seasonal shifts.
Which rent growth KPIs best predict NOI?
Economic occupancy is the most reliable KPI for predicting NOI. It measures revenue actually collected after concessions, bad debt, and delinquency - not just how many units are occupied. A gap greater than 10% between physical and economic occupancy can point to management or collection problems that reduce NOI and property value.
RevPAF (revenue per available foot), delinquency-adjusted occupancy, unit-level rent growth, and lease-up speed also help keep projections tied to actual cash flow, rather than potential revenue.