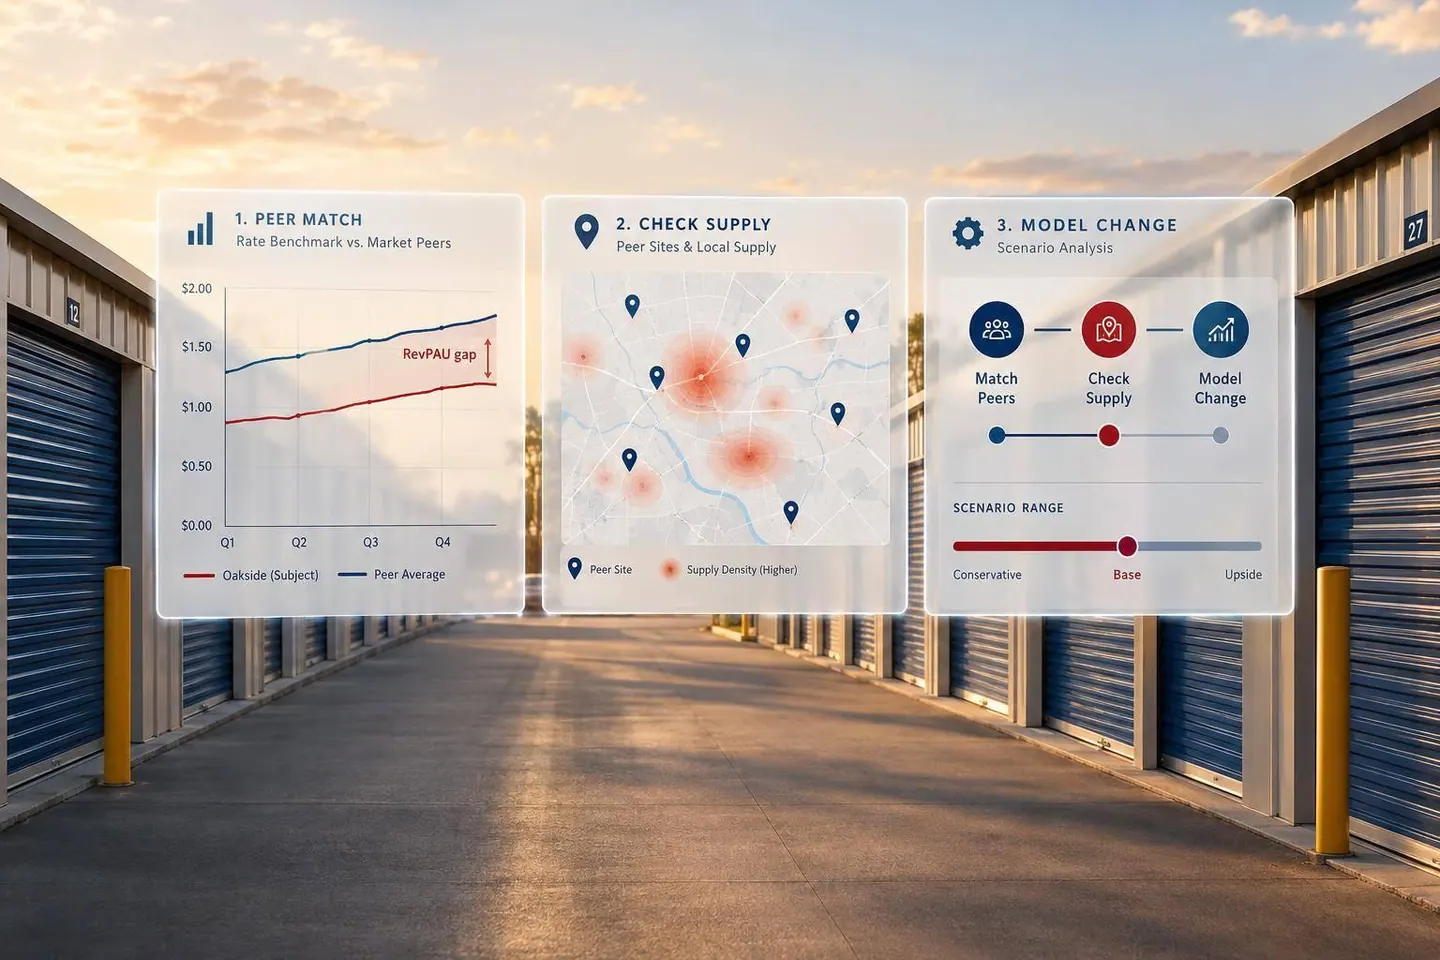

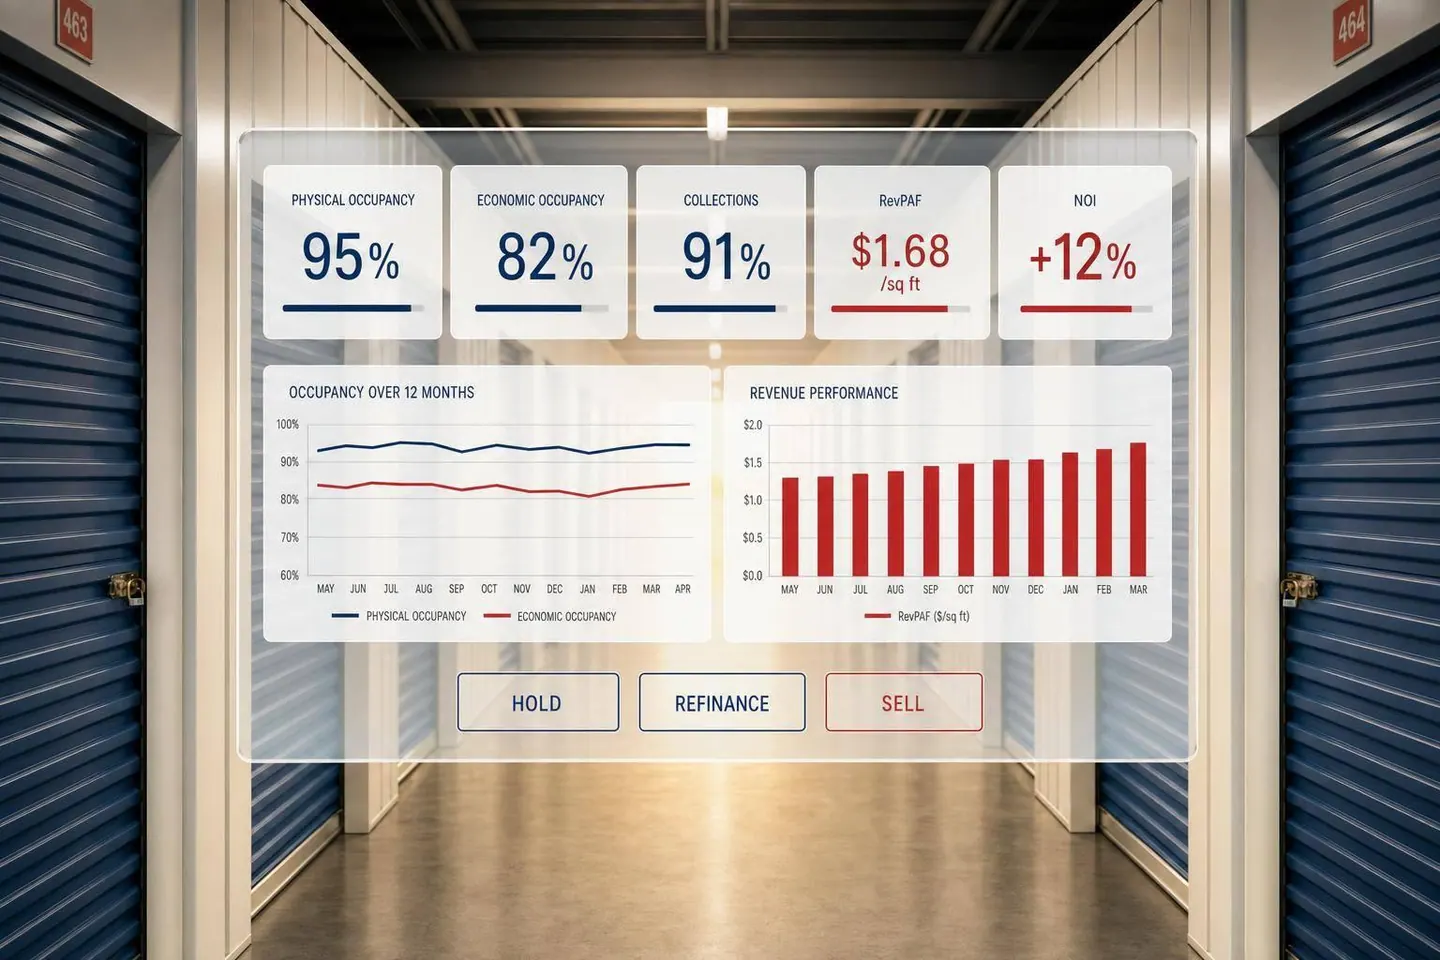
A self-storage property can be 90%+ occupied and still lose NOI. That’s the main point. If I’m an owner, I can’t stop at occupancy. I need to track whether rented units are turning into collected revenue, whether discounts or delinquency are dragging down results, and whether expenses are eating away at cash flow.
Here’s the short version:
- Occupancy alone is not enough. Yardi Matrix reported 90.2% same-store occupancy in 2025, yet achieved rents were up just 0.2%, revenue rose 0.1%, and NOI fell 1.1%.
- I need to compare physical occupancy and economic occupancy. If physical occupancy is high but economic occupancy lags, that gap often points to concessions, below-market rents, delinquency, or bad debt.
- Revenue needs context. I’d watch gross potential rent, average rent, achieved rent per occupied square foot, and RevPAF to see if growth is coming from price, unit mix, or discounting.
- Collections matter. A single delinquency number is not enough. I’d break it into aging buckets like 1–30, 31–60, 61–90, and 90+ days.
- Expenses decide whether growth sticks. Revenue gains can disappear if taxes, insurance, payroll, or utilities move the wrong way. That’s why NOI, NOI margin, and expense ratio stay on the dashboard.
- Leasing metrics help explain what happens next. Leads, calls, web inquiries, tours, reservations, conversion rate, retention, and move-in source help me see whether weak results come from demand, pricing, follow-up, or unit availability.
- Review timing matters.
- Daily: move-ins, move-outs, reservations, leads, calls, payments
- Weekly: pricing, effective rent, conversion, marketing cost, delinquency aging
- Monthly: occupancy, revenue, concessions, expenses, NOI, budget variance
- Quarterly/Annual: DSCR, rent-roll quality, capex, refinance readiness, sale support
- The dashboard should push action, not just display numbers. KPI cards, line charts, waterfall charts, heat maps, and exception tables should make problem areas easy to spot.
- For hold, refinance, or sale decisions, I need clean trend data. That means separating trailing NOI from forward NOI, showing DSCR, tracking capital needs, and tying results back to valuation or debt decisions.
In plain English, I’d use a storage KPI dashboard to answer one question fast: Is this asset just full, or is it producing cash flow in a way that supports a hold, refinance, or sale?
A good storage dashboard should center on four groups: occupancy and inventory, revenue and collections, expenses and NOI, and benchmarking. Start with inventory first. (For a broader look at management, see our self storage operations guide). Then move into revenue, expenses, and, last, comparisons against plan and portfolio.
Occupancy and Inventory Metrics
Track unit occupancy and square-foot occupancy as two separate numbers.
Unit occupancy = occupied units ÷ total rentable units × 100
Square-foot occupancy = occupied rentable square feet ÷ total rentable square feet × 100
That split matters. A property can look full when you count units, while bigger units are still sitting empty. If you only watch one number, you can miss that.
Alongside those occupancy figures, include:
- Total rentable units
- Total rentable square feet
- Available units
- Available square feet
- Reserved units
- Move-ins
- Move-outs
- Net rentals (move-ins minus move-outs for the period)
Also, flag offline units on their own. This is one of those small details that can change how you read the whole property.
Say a site has 1,000 units, 850 occupied, and 50 offline. On paper, that leaves 100 physically available units, but only 50 are actually leasable. If you don’t separate offline inventory, a manager might read low availability as weak demand when the issue is just that some units can’t be rented.
Revenue, Pricing, and Collections Metrics
Revenue and collections tell you whether occupancy is turning into cash flow.
Start with gross potential rent (GPR). This is the revenue a property would bring in if every rentable unit were leased at market rate, before discounts, concessions, delinquency, or bad debt.
From there, track economic occupancy to see how much of that rent potential is being turned into collected revenue:
Economic Occupancy = Collected Rental Revenue ÷ Gross Potential Rent × 100
If monthly GPR is $100,000 and collected revenue is $92,000, economic occupancy is 92.0%. If physical occupancy is 95.0%, that 3-point gap usually points to discounts, concessions, delinquency, bad debt, or rents that are below market.
It also helps to track average rent per occupied unit, achieved rent per occupied square foot, and RevPAF (total rental revenue ÷ total rentable square feet). RevPAF blends pricing and utilization into one yield metric, which makes it more useful than looking at occupancy or average rent on their own.
For collections, show the delinquency rate (delinquent balance ÷ billed charges × 100) and break it into aging buckets:
- Current
- 1–30 days
- 31–60 days
- 61–90 days
- 90-plus days
Put that next to bad debt, both in dollars and as a share of billed or potential revenue. One delinquency number by itself doesn’t tell the full story. It can hide whether the issue is a short-term payment delay or money that’s likely gone for good.
Expenses, NOI, and Leasing Efficiency Metrics
Once you can see where revenue is leaking, the next step is to check whether expenses are making the gap worse.
Use these core formulas:
NOI = revenue − operating expenses
NOI margin = NOI ÷ revenue
Expense ratio = expenses ÷ revenue
For example, a property with $150,000 in revenue and $52,500 in operating expenses produces $97,500 NOI, a 35.0% expense ratio, and a 65.0% NOI margin.
At the property level, NOI should exclude financing costs, depreciation, amortization, and income taxes.
Then layer in leasing metrics. These are the numbers that show what’s feeding future occupancy and revenue: leads, phone calls, web inquiries, tours, reservations, conversion rate, customer acquisition cost, tenant retention, average length of stay, and source of move-ins.
Here’s the simple way to think about it: leasing metrics point to what’s coming next, while occupancy, collections, and NOI show what already happened. Looking at both together makes it much easier to spot the cause of a weak result. Is demand soft? Is follow-up poor? Is pricing off? Are units unavailable? Or is the problem collections?
Benchmarking and Portfolio Comparisons
After the operating numbers, compare them against the targets and the past.
Each metric should be shown against budget, prior month, prior year, original underwriting, and portfolio average. Don’t stop at the raw number. Show the variance too.
For example, if current economic occupancy is 91.5% versus a 93.0% budget and 92.2% last year, the dashboard should show variances of −1.5 percentage points and −0.7 percentage points side by side. That makes the shortfall easy to spot without forcing someone to do the math in their head.
At the portfolio level, use weighted figures based on rentable square feet or units, not simple averages. For RevPAF, calculate it as aggregate rental revenue ÷ aggregate rentable square feet. Don’t use the average of each property’s separate RevPAF.
It also helps to segment comparisons by market, vintage, unit type, size, and occupancy stage. A newly opened facility and a stabilized asset may sit in the same portfolio, but they shouldn’t be judged by the same benchmark.
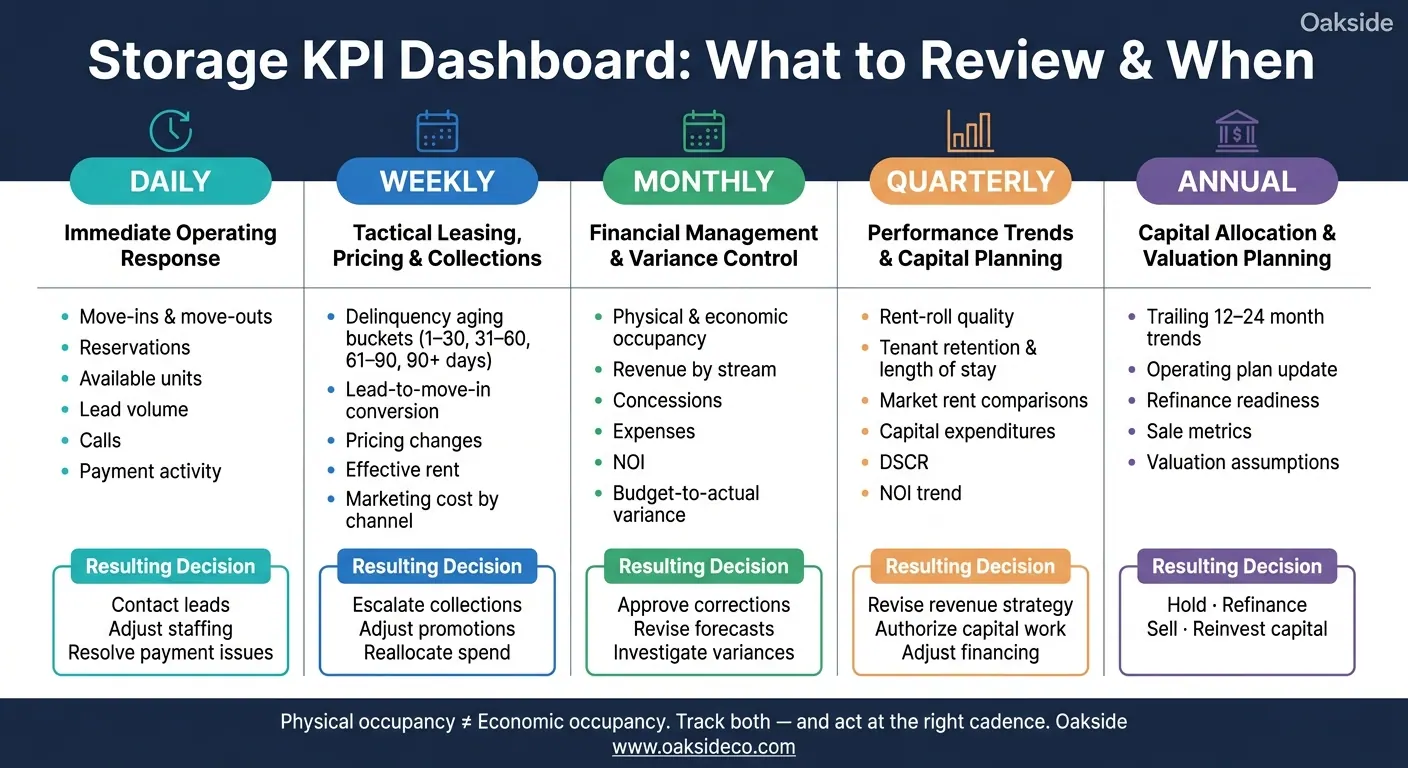
Storage KPI Dashboard: Reporting Cadence & Key Metrics by Review Frequency
The right review schedule depends on two things: how fast the metric moves and what decision it helps you make.
Daily, Weekly, and Monthly Reporting Cadence
Daily monitoring is for metrics that need a fast response. That includes move-ins, move-outs, reservations, available units, lead volume, calls, and payment activity. This matters even more for lease-up properties, where small changes in reservation pace or conversion can shift the stabilization timeline.
Weekly reviews are where owners and operators make tactical calls. Delinquency aging buckets, lead-to-move-in conversion, pricing changes, effective rent, and marketing cost all belong in this window. And when you review delinquency, don't stop at the total. Look at the aging buckets. That's how you spot whether collections are slipping or just delayed. Weekly reporting is also the best time to compare marketing channels and shift spend away from a source that isn't pulling its weight.
Monthly reporting is the main financial checkpoint. Physical and economic occupancy, revenue by stream, concessions, expenses, NOI, and budget-to-actual variance all need a closed accounting period to mean much. In plain terms, monthly reporting should tie operating results back to closed-period financials and budget. That's what makes it the main checkpoint for variance control.
Quarterly and Annual Owner Reviews
Weekly and monthly reporting helps run the property. Quarterly and annual reporting helps shape capital decisions.
Quarterly reviews focus on operating trends and market position. Rent-roll quality, tenant retention, length of stay, market rent comparisons, capital expenditures, debt-service coverage ratio, and NOI progression fit here. These metrics need a few months of history before patterns start to stand out across periods.
Annual reviews take a step back and deal with capital allocation and valuation. This is when owners update the operating plan, revisit debt terms, assess refinance readiness, and look at sale positioning. The annual review should use trailing 12- to 24-month trends and explain the drivers behind variances, not just list the end results. Those reviews shape hold, refinance, sale, and capital-allocation decisions.
Reporting Cadence Comparison Table
| Reporting cadence | Purpose | Core KPIs | Resulting owner decision |
|---|---|---|---|
| Daily | Immediate operating response | Move-ins, move-outs, reservations, available units, lead volume, calls, payment activity | Contact leads, adjust staffing, resolve payment issues |
| Weekly | Tactical leasing, pricing, and collections | Aging buckets, lead-to-move-in conversion, pricing changes, effective rent, marketing cost | Escalate collections, adjust promotions, reallocate spend |
| Monthly | Financial management and variance control | Physical and economic occupancy, revenue by stream, concessions, expenses, NOI, budget-to-actual variance | Approve corrections, revise forecasts, investigate variances |
| Quarterly | Performance trends and capital planning | Rent-roll quality, retention, length of stay, market rents, capital expenditures, DSCR, NOI trend | Revise revenue strategy, authorize capital work, adjust financing assumptions |
| Annual | Capital allocation and valuation planning | Trailing 12- to 24-month trends, operating plan, refinance readiness, sale metrics, valuation assumptions | Hold, refinance, sell, or reinvest capital |
The next step is deciding how to present each KPI so exceptions jump off the page.
Once reporting cadence is set, the next step is choosing visuals that make problems stand out fast.
Pick each visual based on the decision it needs to support: status, trend, comparison, or exception. Keep the first view to five or six key measures so owners can scan it in seconds and see where attention is needed.
Physical occupancy tracks rented units or rented space. Economic occupancy, by contrast, compares collected revenue with gross potential rent. They are not the same metric, and they shouldn't be used as if they are.
Every chart title or subtitle should state the period, measure, unit, and comparison basis. For example: Square-foot physical and economic occupancy, January–September 2026, compared with budget and prior year. Labels also need to make the setup clear: unit-based or square-foot occupancy, monthly or YTD revenue, actual or annualized dollars, and which revenue items are included in economic occupancy.
Best visual format for each KPI type
Start the dashboard with a top row of KPI cards for physical occupancy, economic occupancy, revenue, delinquency, NOI, and budget variance. Each card should show the current value, the comparison period, the variance, and a directional indicator. That way, owners can spot what needs action right now. For example: Physical occupancy: 91.4%, +1.2 percentage points versus prior month; Economic occupancy: 86.9%, 4.5 points below physical occupancy.
Use the simplest chart that makes the variance easy to spot.
| KPI type | Best visual | Why it works |
|---|---|---|
| Current occupancy, revenue, NOI, delinquency, budget variance | KPI card | Shows status at a glance with directional context |
| Monthly occupancy, revenue, achieved rent, revenue per available square foot, delinquency, expenses, NOI | Line chart | Shows trend |
| Actual vs. budget, actual vs. prior year, property comparisons | Grouped bar chart | Makes side-by-side differences easy to read |
| Delinquency aging (1–30, 31–60, 61–90, 90-plus days) | Stacked bar chart | Shows whether balances are fresh or moving toward lien, auction, or bad-debt risk |
| Occupancy, achieved rent, or revenue per available square foot by property and unit type | Heat map | Shows patterns across properties and unit types |
| Gross potential rent → collected revenue; revenue → NOI | Waterfall chart | Shows the dollar impact of discounts, concessions, delinquency, bad debt, and expenses on NOI |
| Rate per occupied square foot vs. occupancy; expense per rentable square foot vs. NOI margin | Scatter plot | Highlights outliers and relationships, such as rate versus occupancy |
| Properties or categories outside thresholds | Exception table | Directs attention to items that need a decision or action |
Use the same color scale on heat maps across reporting periods. Otherwise, a color shift can come from the legend changing instead of performance changing.
For drill-down, build a clear hierarchy: portfolio → property → unit type → unit detail. The metric definition should stay the same at each level. If portfolio-level economic occupancy is short, the dashboard should let you move straight to the property causing it, then to the unit category - say, climate-controlled 10×10s - and then to the individual accounts.
After picking the chart, the next step is deciding what action it should trigger.
Using the dashboard as an exception tool
The point isn't to show every metric. It's to surface the ones that need a decision. Build exception rules around four comparisons: budget, prior month, prior year, and underwriting.
Each row in an exception table should include:
- Property
- KPI
- Actual result
- Comparison basis
- Variance
- Likely driver
- Responsible party
- Next review date
Exception reporting ties data to accountability for underwriting, budget, and valuation assumptions. Charts show patterns. Exception tables make it clear who needs to act.
A KPI dashboard should help you answer one practical question: should you hold, refinance, or sell? The right view makes that call less about gut feel and more about what the property is actually doing.
Hold and refinance decision inputs
A hold case looks strongest when the property is steady month after month, not just in one good stretch. You want to see occupancy stay stable across seasons, achieved rents move up without heavy concessions, collections come in on time, and NOI trend higher.
Take one example: an asset with 91% physical occupancy, 88% economic occupancy, falling delinquency, and 5% year-over-year NOI growth gives a solid case for continuing to hold. That tells you the property is not only filling units, but also turning that demand into cash flow.
Once that operating picture looks steady, the next step is debt capacity. Can the asset carry new loan terms without strain? That’s where the dashboard needs to do more than show occupancy.
For a refinance, lenders look at stabilized NOI, DSCR, economic occupancy, expense trends, and capital needs over time, not one strong month. So the dashboard should show current DSCR and pro forma DSCR under the proposed loan. It should also test downside cases, including:
- Lower occupancy
- Higher expenses
- Flat rent growth
That kind of stress test matters. A refinance can look fine on paper until one weak leasing period or a jump in costs changes the math.
Sale readiness and decision inputs
For a sale, the dashboard should shift from debt support to buyer diligence. Buyers don’t pay for headline occupancy alone. They want cash flow they can verify.
That means the dashboard should show normalized NOI, trailing-12-month performance, economic occupancy, achieved rent versus current market rent, delinquency aging, and near-term capital expenditure needs.
One point matters more than most: trailing NOI and forward NOI should never be blended together. Keep them separate.
Trailing NOI shows what the property actually produced. Forward NOI shows what the asset may produce based on stated assumptions. When those numbers are split clearly, buyers can see the difference between in-place performance and future upside. That makes projections easier to trust and less likely to get brushed off as wishful thinking.
Clear historical reporting also helps diligence move faster and can support a stronger valuation case.
Conclusion: Key dashboard measures and next steps
Owners who track occupancy, pricing, collections, expenses, NOI, and leasing efficiency at the right pace - and use simple visuals to flag outliers - are in a much better spot when a hold, refinance, or sale window opens.
Oakside Co works with self-storage owners to validate KPI definitions, normalize NOI, run scenario analysis, and prepare buyer- or lender-ready materials that turn property data into a capital plan.
Why isn’t occupancy enough?
Physical occupancy on its own doesn't tell the whole story. It shows how many units are rented, but it doesn't show how much money the property is bringing in.
A facility can post high occupancy and still lag on income because of delinquency, concessions, or flat rental rates. Economic occupancy gives you a clearer picture by comparing actual revenue to gross potential revenue.
What causes a gap between physical and economic occupancy?
A gap shows up when occupied units don't bring in the full rent you expected to collect. This usually happens because of concessions, free-month move-in deals, late or missed payments, and bad debt.
Physical occupancy tells you how many units are rented. Economic occupancy tells you how much income you actually collected. Those two numbers are often close, but they're not the same.
A gap of 3% to 8% is common. Once it moves above 10%, that's often a sign of collection issues or discounting that's too aggressive.
Which KPIs matter most for hold, refinance, or sale decisions?
Focus on NOI, economic occupancy, RevPAF, and DSCR.
NOI drives value. That means your expense line needs to be cleaned up before you lean on the number. In plain English: normalize expenses so the property is being judged like a business, not like one owner’s personal setup.
That usually means:
- adding a market-rate management fee of 6% to 8%
- removing personal expenses that don’t belong in property operations
This matters because a messy NOI can paint the wrong picture. If expenses are too low on paper, value can look better than it should.
Economic occupancy also deserves more attention than physical occupancy. Physical occupancy tells you how many units are filled. Economic occupancy tells you how much rent is actually being collected after concessions, bad debt, and delinquencies. And that’s the number tied to income.
A gap of 3% to 8% between physical and economic occupancy is common. If the spread is bigger than that, it can point to revenue leaks. Maybe tenants are getting too many concessions. Maybe collections are weak. Maybe delinquency is creeping up. Either way, it’s a sign to dig deeper, not just nod and move on.
RevPAF helps you see income performance on a per-square-foot basis, while DSCR shows whether the property’s income can cover debt payments. Together with NOI and economic occupancy, they give you a much clearer read on how the deal is actually performing.